![[*]](/icons/foot_motif.gif) -
N. Arimoto2,3
-
N. Arimoto2,3
A&A 391, 55-65 (2002)
DOI: 10.1051/0004-6361:20020609
C. Ikuta
1,
-
N. Arimoto2,3
1 - School of Physics & Astronomy,
University of Nottingham, Nottingham, NG7 2RD, UK
2 -
National Astronomical Observatory of Japan,
2-21-1, Osawa, Mitaka, Tokyo 181-8588,
Japan
3 -
Institute of Astronomy, University of Tokyo,
2-21-1, Osawa, Mitaka, Tokyo 181-0015,
Japan
Received 22 October 2001 / Accepted 12 April 2002
Abstract
Star formation and chemical enrichment histories
of the dwarf spheroidal galaxies (dSphs) Draco, Sextans,
and Ursa Minor are investigated by means of chemical evolution models and
a simulation code for colour-magnitude diagrams (CMDs).
The CMD simulation code is designed to
fully consider effects of the chemical evolution on
stellar evolution and photometric properties.
For this aim, star formation and chemical enrichment histories
are calculated consistently in the code.
Comparisons between the chemical evolution models and
the observed abundance patterns reveal that
the star formation rates were very low (1-5% of that
of the solar neighbourhood disc) and that
the initial star formation continued
for a long duration (>3.9-6.5 Gyr) in these dSphs.
This star formation history can reproduce
morphologies of the observed CMDs,
such as narrow red giant branches and
red horizontal branches and succeeds in
solving the second parameter problem of the dSph Draco.
Hence, both of the abundance patterns
and the morphologies of the CMDs
can be explained by the star formation histories characterised
by the low star formation rate and the long duration of the
star formation period. Because of the low star formation rates,
plenty of gas remains at the final epoch
of star formation. We suggest that gas stripping by the Galaxy results in
termination of star formation in the dSphs.
Key words: galaxies: dwarf - galaxies: abundances - galaxies: evolution - galaxies: Local Group - galaxies: stellar content
 t
t
 et al. 1999).
Using high dispersion (R=34 000) spectroscopy,
Shetrone et al. (2001) have recently
presented abundances of various elements in
the three dSphs Draco, Sextans, and Ursa Minor,
which are all satellite galaxies of the Milky Way.
They report that the abundance ratios of
et al. 1999).
Using high dispersion (R=34 000) spectroscopy,
Shetrone et al. (2001) have recently
presented abundances of various elements in
the three dSphs Draco, Sextans, and Ursa Minor,
which are all satellite galaxies of the Milky Way.
They report that the abundance ratios of  elements (O, Si, Mg, etc.)
relative to iron ([/Fe]) are nearly equal to solar
at low metallicity ([Fe/H] < -1.4).
This suggests that the stars were formed in the gas enriched
by Type Ia supernovae (SNe Ia) as well as by
Type II supernovae (SNe II),
that is, star formation in the dSphs continued over
the lifetime (typically 1-2 Gyr) of SNe Ia progenitors.
This result allows us to directly study the
chemical enrichment histories (CEHs) of
the dSphs Draco, Sextans, and Ursa Minor.
elements (O, Si, Mg, etc.)
relative to iron ([/Fe]) are nearly equal to solar
at low metallicity ([Fe/H] < -1.4).
This suggests that the stars were formed in the gas enriched
by Type Ia supernovae (SNe Ia) as well as by
Type II supernovae (SNe II),
that is, star formation in the dSphs continued over
the lifetime (typically 1-2 Gyr) of SNe Ia progenitors.
This result allows us to directly study the
chemical enrichment histories (CEHs) of
the dSphs Draco, Sextans, and Ursa Minor.
One problem in deriving an accurate SFH from stellar colours is the so-called age-metallicity degeneracy. Older stars become redder and the same is true for more metal-rich stars. Hence, young and metal-rich stars show colours similar to old and metal-poor ones. We have empirically solved the age-metallicity degeneracy for the three dSphs cited above to derive their star formation histories (SFHs) to a level of accuracy that is impossible in other galaxies in the Local Group. To reveal SFHs in detail would help to understand how large galaxies and the environments affect the evolution of dwarf galaxies.
In addition to a study of the evolution of dwarf galaxies themselves,
one can also learn about the possible merging history of
the Milky Way by comparing the abundances of the satellite
dwarf galaxies with those of Galactic field halo stars.
In a hierarchical galaxy formation scenario,
larger galaxies grew at the expense of
smaller gaseous fragments
(e.g., White & Rees 1978; Kauffmann et al. 1993; Blumenthal et al. 1994;
Cole et al. 1994). From the observational perspective,
Searle & Zinn (1978) proposed
a model in which the Galactic halo was formed via
infall and destruction of proto-Galactic fragments.
Increasing empirical and analytical evidence
suggests that the Galactic halo was, at least in part,
assembled from chemically-distinct, low-mass fragments
(e.g., Searle & Zinn 1978; Yanny et al. 2000).
Such evidence includes the recent
discovery of the tidally disturbed dSph
Sagittarius which is falling onto
the Galaxy (Ibata et al. 1994)
as well as the numerous reports of kinematical substructure among
halo field stars (e.g., Chen 1998).
The scenario can be tested by comparing abundance
patterns of field stars in the Galactic halo
and those of satellite dwarf galaxies.
If today's dwarf galaxies in the Local Group
were the counterparts of proto-Galactic gaseous fragments,
the abundance patterns of dwarf galaxies should be similar to those
of field stars in the Galactic halo.
The observations by Shetrone et al. (2001), however, have shown that the
patterns of abundance ratio in the dSphs are different
from those of the Galactic halo stars.
The dSphs have
![$-0.4 \le {\rm [Mg/Fe]} \le 0.4$](/articles/aa/full/2002/31/aa2018/img20.gif) ,
while field stars in the Galactic halo have
,
while field stars in the Galactic halo have
![$0.2 \le {\rm [Mg/Fe]} \le 0.6$](/articles/aa/full/2002/31/aa2018/img21.gif) .
The authors concluded that the Galactic halo was unlikely
to have formed via
the accretion of objects similar to the dSphs Draco, Sextans, and Ursa Minor.
.
The authors concluded that the Galactic halo was unlikely
to have formed via
the accretion of objects similar to the dSphs Draco, Sextans, and Ursa Minor.
In this paper, we discuss the SFHs and the CEHs of the three dSphs Draco, Sextans, and Ursa Minor. Using the abundance patterns and the CMDs, we show that the low (1-5% of the solar neighbourhood) star formation rate and relatively long duration (3.9-6.5 Gyr) of initial star formation explain both the abundance patterns and morphologies of CMDs such as well-populated red horizontal branch (RHB) and the tight red giant branch (RGB).
The paper is organised as follows. In Sect. 2, chemical evolution model is confronted with the observed stellar abundances to study the CEHs and SFHs. In Sect. 3, by calculating CMDs by using our CMD simulation code (Ikuta 2001), we will show that the SFHs derived in the previous section succeed in reproducing observed CMDs. Discussions and conclusions are presented in Sects. 4 and 5, respectively.
Generally stellar birth rate is separated into two
independent functions. The birth rate of stars with mass between
m and
 is described as
 ,
where C(t) and
,
where C(t) and  are the SFR and the
initial mass function (IMF), respectively (Tinsley 1980).
The IMF is assumed to be time invariant
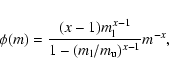
with a power-law spectrum. Normalising to unity, we have
are the SFR and the
initial mass function (IMF), respectively (Tinsley 1980).
The IMF is assumed to be time invariant
with a power-law spectrum. Normalising to unity, we have
 and
and
 ,
respectively. The Salpeter IMF has x=1.35 in this definition.
Similarly to the solar neighbourhood disc model of
chemical evolution (Arimoto et al. 1992),
the Salpeter IMF is assumed in this section.
Models with different IMFs will be discussed in Sect. 4.
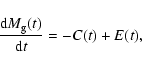
The gas mass
,
respectively. The Salpeter IMF has x=1.35 in this definition.
Similarly to the solar neighbourhood disc model of
chemical evolution (Arimoto et al. 1992),
the Salpeter IMF is assumed in this section.
Models with different IMFs will be discussed in Sect. 4.
The gas mass
 changes through star formation:
 |
(2) |
 7 percent of the galaxy mass; MacLow & Ferrara 1999).
Metal-enhanced wind is often introduced to
explain observed properties of dwarf galaxies (e.g., Vader 1986).
MacLow & Ferrara (1999) showed that indeed most of the metals are able to
leave dwarf galaxies during star burst,
although the mass loss rate is small.
Virtually no metals are retained in dwarf galaxies
if high energy is supplied by supernova explosions
(see Table 3 in their literature for details).
Complete metal loss means no chemical enrichment in dwarf galaxies.
This is inconsistent with observations which show clearly that dSphs are
chemically polluted. Their results suggest that
only star formation of a low rate
allows a dwarf galaxy to retain a large fraction of heavy
elements produced in massive stars.
As will be shown later, very low SFRs are indeed
required to explain the observed abundances and CMDs.
Thus, a simple model is adopted here and a galaxy is assumed to be
a closed system.
7 percent of the galaxy mass; MacLow & Ferrara 1999).
Metal-enhanced wind is often introduced to
explain observed properties of dwarf galaxies (e.g., Vader 1986).
MacLow & Ferrara (1999) showed that indeed most of the metals are able to
leave dwarf galaxies during star burst,
although the mass loss rate is small.
Virtually no metals are retained in dwarf galaxies
if high energy is supplied by supernova explosions
(see Table 3 in their literature for details).
Complete metal loss means no chemical enrichment in dwarf galaxies.
This is inconsistent with observations which show clearly that dSphs are
chemically polluted. Their results suggest that
only star formation of a low rate
allows a dwarf galaxy to retain a large fraction of heavy
elements produced in massive stars.
As will be shown later, very low SFRs are indeed
required to explain the observed abundances and CMDs.
Thus, a simple model is adopted here and a galaxy is assumed to be
a closed system.
![\begin{figure}
\par\includegraphics[width=8.8cm,clip]{CI2018f1.epsi}\end{figure}](/articles/aa/full/2002/31/aa2018/img33.gif) |
Figure 1:
Theoretical abundance patterns together with the observations
(Shetrone et al. 2001) for stars in the dSphs Draco, Sextans,
and Ursa Minor. The meaning of the marks is written on the panel.
The same IMF (the Salpeter IMF: x=1.35)
with upper (
)
and lower (
 )
mass limits are adopted in all the model, while
different values of )
mass limits are adopted in all the model, while
different values of
 Gyr-1)
are assumed; model A ( Gyr-1)
are assumed; model A (
 Gyr-1:
dotted line); model B ( Gyr-1:
dotted line); model B (
 Gyr-1:
dashed line); model C ( Gyr-1:
dashed line); model C (
 Gyr-1:
solid line); and model D ( Gyr-1:
solid line); and model D (
 Gyr-1:
dotted-dashed line). (This figure is available in color in electronic form.) Gyr-1:
dotted-dashed line). (This figure is available in color in electronic form.) |
| Open with DEXTER | |
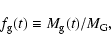
The SFR is assumed to be proportional
to the gas fraction
 :
:
 |
(3) |
 |
(4) |
 (Gyr)
and
(Gyr)
and  are the timescale of star formation
and the initial total mass of a galaxy, respectively.
are the timescale of star formation
and the initial total mass of a galaxy, respectively.
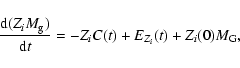
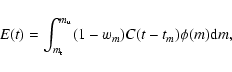
The evolution of the abundance
of the ith element Zi(t) is given as
 |
(5) |
 |
(6) |
![$\displaystyle E_{Z_i}(t)=
\int_{m_{\rm t}}^{m_{\rm u}}\!\!\!\!\!\!\left[{(1\!-\!w_m)Z_i(t-t_m)\!+\!p_{im}}\right]
C(t-t_m) \phi(m){\rm d}m ,$](/articles/aa/full/2002/31/aa2018/img41.gif) |
(7) |
 for a progenitor of Type II supernova (SNeII)
is
for a progenitor of Type II supernova (SNeII)
is
 (Tsujimoto et al. 1995).
Nucleosynthesis of SNeII and
of SNeIa are explicitly included, since the
former profoundly produce the
elements
(e.g., O, Mg, Si, Ca),
while the latter the iron-peak elements (e.g., Fe, Ni, Co).
The data of nucleosynthesis are taken
from Thielemann et al. (1996)
for SNeII, Nomoto et al. (1996) for SNeIa,
and Renzini & Voli (1981) for low-mass (
(Tsujimoto et al. 1995).
Nucleosynthesis of SNeII and
of SNeIa are explicitly included, since the
former profoundly produce the
elements
(e.g., O, Mg, Si, Ca),
while the latter the iron-peak elements (e.g., Fe, Ni, Co).
The data of nucleosynthesis are taken
from Thielemann et al. (1996)
for SNeII, Nomoto et al. (1996) for SNeIa,
and Renzini & Voli (1981) for low-mass (
 )
stars.
Progenitors of SNe Ia are generally considered to have
longer lifetimes than those of SNe II, since a majority of them are
likely to be Chandrasekhar mass white dwarfs
(e.g., Nomoto et al. 1997).
Observations for disc (Edvardsson et al. 1993)
and halo (e.g., McWilliams et al. 1995; Gratton & Sneden 1987)
stars in the Milky Way show that there is a sudden decline of [/Fe]
in the [/Fe]-[Fe/H] diagram. The decline
is generally interpreted as an onset of SN Ia explosions.
Studying observed [O/Fe] break
at
)
stars.
Progenitors of SNe Ia are generally considered to have
longer lifetimes than those of SNe II, since a majority of them are
likely to be Chandrasekhar mass white dwarfs
(e.g., Nomoto et al. 1997).
Observations for disc (Edvardsson et al. 1993)
and halo (e.g., McWilliams et al. 1995; Gratton & Sneden 1987)
stars in the Milky Way show that there is a sudden decline of [/Fe]
in the [/Fe]-[Fe/H] diagram. The decline
is generally interpreted as an onset of SN Ia explosions.
Studying observed [O/Fe] break
at
![$\rm [Fe/H] \sim -1$](/articles/aa/full/2002/31/aa2018/img45.gif) for disc and halo stars in the Milky Way,
Yoshii et al. (1996)
suggested that the effective lifetime of SNe Ia
is around 1.5 Gyr. A new SNIa model (Hachisu et al. 1999)
suggested that occurrence of SNeIa depends on the metallicities of progenitors
as well as the lifetimes. Based on the new SN Ia model,
Kobayashi et al. (1998) predicted that SN Ia events occur only
for the progenitors with
for disc and halo stars in the Milky Way,
Yoshii et al. (1996)
suggested that the effective lifetime of SNe Ia
is around 1.5 Gyr. A new SNIa model (Hachisu et al. 1999)
suggested that occurrence of SNeIa depends on the metallicities of progenitors
as well as the lifetimes. Based on the new SN Ia model,
Kobayashi et al. (1998) predicted that SN Ia events occur only
for the progenitors with
![$\rm [Fe/H] \ge -1.1$](/articles/aa/full/2002/31/aa2018/img46.gif) .
On the observational side,
element to iron abundance ratios
of the three dSphs, Draco, Sextans, and Ursa Minor
(Shetrone et al. 2001) have indicated
a significant contribution from SNeIa at a metallicity lower than
[Fe/H] =-1.0. The observed trends of [/Fe]
are difficult to explain by the new SNIa model.
Thus, the metallicity effect on SNeIa is not considered here
and the lifetime of the progenitors
is assumed to be 1.5 Gyr (Yoshii et al. 1996).
.
On the observational side,
element to iron abundance ratios
of the three dSphs, Draco, Sextans, and Ursa Minor
(Shetrone et al. 2001) have indicated
a significant contribution from SNeIa at a metallicity lower than
[Fe/H] =-1.0. The observed trends of [/Fe]
are difficult to explain by the new SNIa model.
Thus, the metallicity effect on SNeIa is not considered here
and the lifetime of the progenitors
is assumed to be 1.5 Gyr (Yoshii et al. 1996).
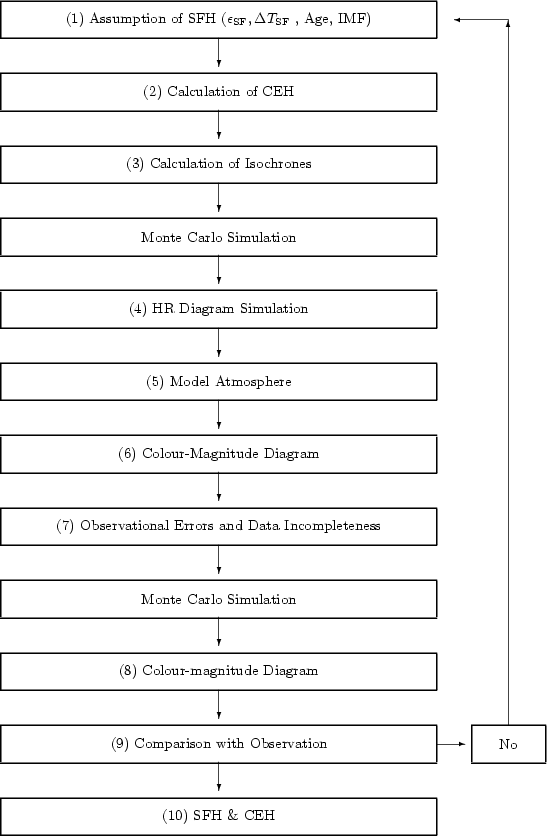 |
Figure 2: Flow-chart of a CMD simulation code. |
| Open with DEXTER | |
| Model | x |
 (Gyr-1)
 |
 (Gyr)
(Gyr) |
| A | 1.35 |
 |
2.5 |
| B | 1.35 |
 |
3.9 |
| C | 1.35 |
 |
6.5 |
| D | 1.35 |
 |
12 |
| E | 1.75 |
 |
1.6 |
| F | 1.95 |
|
1.8 |
| G | 2.15 |
|
2.2 |
Figure 1 reproduces the observed stellar abundances of the dSphs
Draco, Sextans, and Ursa Minor in the [Mg/Fe]-[Fe/H] diagram
(Shetrone et al. 2001). Despite the narrow widths of the RGB
(see Fig. 1 of Shetrone et al. 2001), the iron abundances exhibit
a large dispersion (
![$-3 \le {\rm [Fe/H]} \le -1.4$](/articles/aa/full/2002/31/aa2018/img54.gif) ), and
the abundance ratios of the -elements
(e.g., Mg) to iron are near or below solar.
The abundance ratio [Mg/Fe] starts to decrease
at
), and
the abundance ratios of the -elements
(e.g., Mg) to iron are near or below solar.
The abundance ratio [Mg/Fe] starts to decrease
at
![$\rm [Fe/H] \simeq -2$](/articles/aa/full/2002/31/aa2018/img55.gif) .
On the other hand, [Mg/Fe] in the solar neighbourhood
decreases with [Fe/H] at around
.
On the other hand, [Mg/Fe] in the solar neighbourhood
decreases with [Fe/H] at around
![$\rm [Fe/H]\ge -1$](/articles/aa/full/2002/31/aa2018/img56.gif) ,
which is generally interpreted as
the onset of SNeIa explosions (e.g., Matteucci & Greggio 1986).
Supposing that the decline of
[Mg/Fe] in the dSphs is also caused by SNeIa, the star formation
should have continued longer than the lifetime
(typically 1-2 Gyr) of progenitors of SNeIa and the SFRs
should be much lower than that of the solar neighbourhood.
A time-delay model (Matteucci & Brocato 1990)
of the SNeIa precisely predicted that the low star formation rate
results in lower [Mg/Fe] ratios relative to stars in the Galaxy.
,
which is generally interpreted as
the onset of SNeIa explosions (e.g., Matteucci & Greggio 1986).
Supposing that the decline of
[Mg/Fe] in the dSphs is also caused by SNeIa, the star formation
should have continued longer than the lifetime
(typically 1-2 Gyr) of progenitors of SNeIa and the SFRs
should be much lower than that of the solar neighbourhood.
A time-delay model (Matteucci & Brocato 1990)
of the SNeIa precisely predicted that the low star formation rate
results in lower [Mg/Fe] ratios relative to stars in the Galaxy.
In Fig. 1, theoretical abundance patterns of our models A-D
are superposed. The models assume different
of
 (Gyr-1) as indicated in Fig. 1.
The model parameters are summarised in Table 1.
A typical value of
for the solar neighbourhood disc is
(Gyr-1) as indicated in Fig. 1.
The model parameters are summarised in Table 1.
A typical value of
for the solar neighbourhood disc is
 Gyr-1 (Arimoto et al. 1992).
The models B-D shown in Fig. 1
give a good fit to the observed abundance patterns.
Since the abundance ratios resulting from the model A are too
high to reproduce the observed ones, the model A is rejected.
The model D with
 Gyr-1
is not appropriate, either. Since
chemical evolution is so slow,
it takes around 15 Gyr to reach
Gyr-1
is not appropriate, either. Since
chemical evolution is so slow,
it takes around 15 Gyr to reach
![$\rm [Fe/H]=-1.4$](/articles/aa/full/2002/31/aa2018/img59.gif) ,
which is the highest abundance observed in these galaxies.
If this model is adopted, the star formation must continue
till now. Clearly this is inconsistent with
the fact that no star formation occurs currently in these galaxies.
Thus, only models B and C remain as being acceptable.
We note that the observational data for the dSph Sextans have
lower signal-to-noise ratios than those for the dSphs Draco and
Ursa Minor (see Table 2 of Shetrone et al. 2001) and
the abundances of the dSph Sextans are less reliable than
those of the other two dSphs. Thus, it is
not necessary to take the discrepancy between
the model predictions and the abundances of the dSph Sextans too seriously.
,
which is the highest abundance observed in these galaxies.
If this model is adopted, the star formation must continue
till now. Clearly this is inconsistent with
the fact that no star formation occurs currently in these galaxies.
Thus, only models B and C remain as being acceptable.
We note that the observational data for the dSph Sextans have
lower signal-to-noise ratios than those for the dSphs Draco and
Ursa Minor (see Table 2 of Shetrone et al. 2001) and
the abundances of the dSph Sextans are less reliable than
those of the other two dSphs. Thus, it is
not necessary to take the discrepancy between
the model predictions and the abundances of the dSph Sextans too seriously.
![\begin{figure}
\par\includegraphics[width=8cm,clip]{CI2018f3.epsi}\end{figure}](/articles/aa/full/2002/31/aa2018/img60.gif) |
Figure 3: CMD of the C0 region of the Draco dSph observed by Piatek et al. (2001). The points marked with open circles correspond to some confirmed RR Lyrae stars (Baade & Swope 1961). |
| Open with DEXTER | |
In short, the abundance patterns of the dSphs Draco, Sextans, and Ursa Minor all suggest that the chemical enrichment occurred with SFRs which are much lower than normal spiral galaxies (only 1-5%).
The models B and C fit well to the observed trends in the [Mg/Fe]-[Fe/H] diagram. Next, we discuss if the colour-magnitude diagrams (CMDs) predicted by these models can reproduce the observed ones. The CMDs provide us with the most detailed information to follow SFHs and CEHs back to the oldest stars. The SFH derived from the abundance patterns in the previous section must give a consistent CMD with the observations.
Simulating numerical CMDs has become a standard technique to study the SFHs of nearby galaxies through the observed CMDs. Galaxies are composed of complex stellar populations, and the observed CMDs are affected by photometric errors and detection incompleteness. A Monte Carlo simulation allows us to take into account both simultaneously. A composite stellar population is randomly generated according to predictions of stellar evolution theory with the IMF and SFR being assumed, and then uncertainties of the data such as the increasing scatters and rising incompleteness at fainter magnitudes are taken into account.
Because of these advantages, this approach is becoming more and more frequently used to study the stellar populations of nearby galaxies. The approach was first applied by Ferraro et al. (1989) and was fully described by Tosi (1991) and Greggio et al. (1993). A more quantitative method, the R-method, to compare simulated and observed CMDs was presented by Bertelli et al. (1992) and was described by Vallenari et al. (1996) in more detail. The statistical comparison was further developed by Tolstoy & Saha (1996) and Tolstoy (1996) by adopting Bayes' theorem. Now several groups have constructed CMD simulators and have investigated SFHs of galaxies in the Local Group (e.g., Aparicio et al. 1996; Dolphin 1997; Hernandez et al. 1999; Gallart et al. 1999).
We should point out, however, that there were two problems in the previous studies. First, all the approaches so far developed use the so-called optimising method of stellar population synthesis. The best mixture of stellar population is searched iteratively to reproduce the CMDs. Problems with this approach are the unproven uniqueness of the solution (e.g., Greggio et al. 1999) and a lack of evolutionary information.
Second, stellar metallicity was assumed a priori in all the simulation codes presented previously. Some introduced metallicity variation in time (e.g., Gallart et al. 1999), but the variation assumed was independent of the SFH. Since the metallicity affects evolutionary tracks and atmospheres of stars, the colours and luminosities of stars are changed by metallicity. Thus, it is crucial to use a simulator of CMDs which fully takes into account a CEH to interpret the CMDs properly and to derive the SFHs accurately. The simplification and/or neglect of chemical evolution lead to a serious problem called the age-metallicity degeneracy. Since stellar colours become bluer when stars are younger and/or poorer in metallicity, there are at least two interpretations for a given position of a star in the CMD; young and metal-rich or old and metal-poor. Therefore, an assumption of the metallicity (or age) of a certain stellar population may result in wrong estimation of age or metallicity, due to the age-metallicity degeneracy.
Aiming to solve the degeneracy, we have built a numerical simulation code of CMD morphology (Ikuta 2001). In the code, we adopt an evolutionary method of stellar population synthesis (e.g., Arimoto & Yoshii 1986). A galaxy is assumed to have been a proto-galactic gas cloud at the beginning. Stars formed and newly processed elements were ejected from stars at the end of their lives either via stellar wind or via supernova explosions (SNeIa and SNeII). The gas was chemically enriched and the next generation of stars changed their evolution and photometric properties due to a metallicity increase. The code is particularly designed to disentangle stellar age and metallicity both of which heavily affect the morphology of CMDs. To take into account effects of chemical evolution, a fine interpolation in stellar ages and metallicities is adopted in our code. The later stages of stellar evolution, in particular, horizontal branch (HB), asymptotic giant branch (AGB), and post-AGB stars are treated in a sophisticated way, since these bright stars are crucial for this purpose. In this section, the procedure of our Monte Carlo simulation of CMDs and the ingredients are detailed.
![\begin{figure}
\par\includegraphics[angle=270,width=18cm,clip]{CI2018f4.epsi}\end{figure}](/articles/aa/full/2002/31/aa2018/img61.gif) |
Figure 4:
Simulated CMDs of models B (left) and C (right).
In model B,
(Gyr-1) and
 Gyr are assumed, while
(Gyr-1)
and Gyr are assumed, while
(Gyr-1)
and
 Gyr are adopted in model C.
In the both models, we assumed the same upper and lower mass limits
(
and
,
respectively),
the Salpeter IMF, and the galactic age of 12 Gyr.
Observational errors and data incompleteness
are taken from Piatek et al. (2001). Gyr are adopted in model C.
In the both models, we assumed the same upper and lower mass limits
(
and
,
respectively),
the Salpeter IMF, and the galactic age of 12 Gyr.
Observational errors and data incompleteness
are taken from Piatek et al. (2001). |
| Open with DEXTER | |
(Gyr),
the duration of star formation
(Gyr),
the slope of the IMF (x), and the age of a galaxy.
Second, chemical evolution is calculated, which
gives the total number of stars at each metallicity at each
time step. Third, a HR diagram is calculated
by using stellar evolutionary tracks, where a
Monte Carlo simulation is performed to assign stellar masses.
Fourth, the effective temperature
 and
luminosity L of a star are transformed to
colour and magnitude by using a library of stellar model atmospheres.
Fifth, a Monte Carlo simulation is performed again
to take into account observational errors and detection completeness,
and thus the CMD is obtained.
A number of stars in the simulated CMD is adjusted to an observed CMD.
Finally, the simulated CMD is confronted
with the observed one by visual inspection. If they are inconsistent,
the parameters of the SFH are changed, and the simulation is re-started.
If the simulated CMD fits the observation,
the SFH and CEH are derived. Ingredients of the simulation, such as
stellar evolutionary tracks, model atmospheres,
and observational conditions, are described in the subsequent section.
and
luminosity L of a star are transformed to
colour and magnitude by using a library of stellar model atmospheres.
Fifth, a Monte Carlo simulation is performed again
to take into account observational errors and detection completeness,
and thus the CMD is obtained.
A number of stars in the simulated CMD is adjusted to an observed CMD.
Finally, the simulated CMD is confronted
with the observed one by visual inspection. If they are inconsistent,
the parameters of the SFH are changed, and the simulation is re-started.
If the simulated CMD fits the observation,
the SFH and CEH are derived. Ingredients of the simulation, such as
stellar evolutionary tracks, model atmospheres,
and observational conditions, are described in the subsequent section.
Stellar evolutionary tracks give luminosities,
effective temperatures, and surface gravities of stars with
given mass and chemical composition as a function
of age. The tracks depend on the basic parameters
such as the initial mass and chemical compositions.
The properties of stellar populations in galaxies also
depend on other properties not explicitly
included in most of current stellar evolution models, i.e.,
the stellar rotation and close binary companions.
The numerical calculations are also sensitive to the treatment
of the convection, such as a mixing length parameter
 and convective overshooting.
![\begin{figure}
\par\includegraphics[width=18cm,clip]{CI2018f5.eps}\end{figure}](/articles/aa/full/2002/31/aa2018/img64.gif) |
Figure 5:
Simulated CMDs of models B (panel a))
and C (panel b)). Adopted
errors and data completeness are the same as those in Fig. 4,
while the number of stars in each panel is increased for
presentation purposes.
Colours correspond to the following metallicity ranges;
blue:
![$\rm [M/H]<-2.0$](/articles/aa/full/2002/31/aa2018/img11.gif) ;
green: ;
green:
![$-2.0 \le {\rm [M/H]} < -1.8$](/articles/aa/full/2002/31/aa2018/img12.gif) ;
orange: ;
orange:
![$1.8 \le {\rm [M/H]} < -1.6$](/articles/aa/full/2002/31/aa2018/img13.gif) ;
red: ;
red: [M/H].
 |
| Open with DEXTER | |
The Padova stellar evolutionary tracks are adopted
for stars from the main sequence (MS)
to the early asymptotic giant branch (EAGB) stars.
The Padova tracks cover wide ranges in age
(0 to 16 Gyr) and metallicity (Z=0.0001 to Z=0.05),
and are one of the most complete sets of stellar evolutionary
models currently available.
The Padova tracks were calculated with revised radiative
opacities (Iglesias et al. 1992) and with
 .
The adopted tracks were
calculated for the following set of chemical compositions:
(
Y=0.230, Z=0.0001; Girardi et al. 1996),
(
Y=0.230, Z=0.0004; Fagotto et al. 1994a),
(
Y=0.240, Z=0.004; Fagotto et al. 1994b),
(Y=0.250, Z=0.008; Fagotto et al. 1994b),
(
Y=0.280, Z=0.02; Bressan et al. 1993), and
(
Y=0.352, Z=0.05; Fagotto 1994a).
.
The adopted tracks were
calculated for the following set of chemical compositions:
(
Y=0.230, Z=0.0001; Girardi et al. 1996),
(
Y=0.230, Z=0.0004; Fagotto et al. 1994a),
(
Y=0.240, Z=0.004; Fagotto et al. 1994b),
(Y=0.250, Z=0.008; Fagotto et al. 1994b),
(
Y=0.280, Z=0.02; Bressan et al. 1993), and
(
Y=0.352, Z=0.05; Fagotto 1994a).
To obtain the isochrone for a given metallicity, the original isochrones are linearly interpolated in metallicity. Since the metallicity changes stellar evolution non-linearly, any extrapolation in metallicity should be avoided. Thus, stars of metallicity lower (Z<0.0001) and higher (Z>0.05) than the Padova tracks do not appear in our simulated CMDs and are not considered here. This is justified, because no significant populations of such extreme metallicities are known to exist in dwarf galaxies. In addition to these, close binary systems are not included, since the input tracks are only for isolated single stars. Although our code does not explicitly include binary stars, it effectively takes into account apparent binary stars as stellar blends. Gallart et al. (1999) reported a study that is more detailed on this issue.
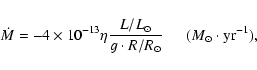
For the RGB evolution, the mass loss law of Reimers (1977) is adopted;
 |
(8) |
 |
(9) |
 and M are stellar luminosity,
surface gravity, radius, effective temperature, and initial mass, respectively.
The mass loss efficiency parameter
and M are stellar luminosity,
surface gravity, radius, effective temperature, and initial mass, respectively.
The mass loss efficiency parameter
 is assumed to be 1/3 (Renzini & Voli 1981).
The horizontal branch (HB) stars are distributed on the HR diagram
according to a modified Gaussian mass distribution
equation (Lee et al. 1990);
![$\displaystyle \Phi (M) \propto \left[ M-(\overline{M_{\rm HB}}-\Delta M)\right]...
...\rm RGB} -M) \exp \left[-\frac{(\overline{M_{\rm HB}}-M)^2}
{\sigma^2} \right],$](/articles/aa/full/2002/31/aa2018/img70.gif) |
(10) |
 is a mass dispersion factor,
and
is a mass dispersion factor,
and
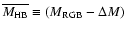 is the mean mass of HB stars. A value of
 has been chosen to represent the HB distributions
similar to those of Galactic globular clusters (Rood 1973; Lee et al. 1990).
This is equivalent to considering the statistical dispersions
of mass loss rate along the RGB.
has been chosen to represent the HB distributions
similar to those of Galactic globular clusters (Rood 1973; Lee et al. 1990).
This is equivalent to considering the statistical dispersions
of mass loss rate along the RGB.
To convert the theoretical temperature-luminosity data
to the observable colour-magnitude plane, a stellar spectral library
by Lejuene et al. (1998) is used.
This consists of Kurucz's (1992) spectra for hotter
stars (O-K), Bessell et al.'s (1989, 1991) and Fruks
et al.'s (1994) spectra for M giants, and Allard & Hauschudt's (1995)
for M dwarfs. In the original model spectra,
systematic deviations become apparent
when colour-temperature relations computed from the
models are compared to the empirical ones at
 .
The library adopted here is a version that
the authors made by correcting the original library.
The corrections are especially important for M star models.
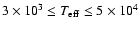
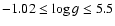
The fundamental parameters
(
,
g, and
.
The library adopted here is a version that
the authors made by correcting the original library.
The corrections are especially important for M star models.
The fundamental parameters
(
,
g, and
![${\rm [M/H]}=\log (Z/Z_\odot)$](/articles/aa/full/2002/31/aa2018/img75.gif) )
are wide enough to cover all spectral types and luminosity
classes that appear in observed CMDs;
)
are wide enough to cover all spectral types and luminosity
classes that appear in observed CMDs;
 ,
,
 ;
;
![$ -5.0 \le [{\rm M/H}] \le 1.0$](/articles/aa/full/2002/31/aa2018/img78.gif) .
To reduce computational time, synthetic magnitudes and
colours tabulated by Lejuene et al. (1998) are
linearly interpolated in log Z, log
,
and log g.
.
To reduce computational time, synthetic magnitudes and
colours tabulated by Lejuene et al. (1998) are
linearly interpolated in log Z, log
,
and log g.
In Sect. 2, models B and C are shown to
fit well the observed trends in the [Mg/Fe]-[Fe/H] diagram.
Next, we discuss if the CMDs predicted by
these models can reproduce the observed ones.
Ideally, the SFH would be studied using a CMD
which satisfies the following two conditions: (1) it covers a whole galaxy;
(2) it is significantly deeper than the turnoff
of the oldest stellar population.
Unfortunately, such CMDs are not available for the galaxies discussed here.
The situation, however, is better for the dSph Draco.
Recently Piatek et al. (2001) imaged nine fields in and around
the Draco dSph by using the KPNO 0.9m telescope and presented
the CMDs down to a luminosity level
2 mag fainter than the HB.
Thus, we mainly discuss the dSph Draco
in this section and briefly mention the dSphs Sextans and Ursa Minor.
Figure 3 shows the observed CMD of the C0 field in the Draco dSph (Piatek et al. 2001), which is characterised by the narrow RGB and the well-populated red HB. The HB in Fig. 1 of Piatek et al. (2001) is somewhat distorted due to RR Lyrae stars which are marked with open circles in Fig. 3. Therefore, we do not take seriously the inconsistency between the observed and simulated blue HB morphology (V-R<0.1). Historically, Baade & Swope (1961) obtained the CMD of the Draco dSph and found that the RGB is generally similar to those of metal-poor globular clusters, although it is rather wide. The authors also found that the populous RHB is incompatible with the low metallicity of a Population II system. This is the notorious second-parameter problem of the dSph Draco.
Figures 4a and 4b represent the CMDs simulated by
models B and C, respectively, where the galactic age is assumed
to be 12 Gyr, which is similar ages of Galactic globular clusters
(e.g., Carretta et al. 2000);
values of other parameters are written in Table 1.
The photometric errors
and detection completeness in the simulations are taken from
Piatek et al. (2001). Both models can reproduce
characteristics of the CMD of the dSph Draco, such as
narrow RGB and heavily populated RHB.
Despite the metallicity dispersion
(
), the theoretical
CMDs results in narrow RGBs.
This is due to the so-called age-metallicity degeneracy
as explained below.
Figure 5 shows CMDs simulated by assuming models B and C, where different colours represent different metallicity range as described in the figure. For presentation purpose, Figs. 5a and b contain larger numbers of stars than those of Figs. 4a and b, respectively. The adopted observational conditions are the same as those of Fig. 4. Clearly, there is little correlation between the colour and metallicity of RGB stars because of the age-metallicity degeneracy. Since stars of higher metallicity are younger, the metallicity and age effects on the RGB colours are cancelled out. This keeps the RGB narrow and tight. The age effect appears in the HB morphology too. Since only metal-poor and old (>10 Gyr) stars can evolve to BHB, younger core-He burning stars lie in the red part of the HB. The populous red HBs in Fig. 5 clearly show this age effect on the HB morphology. A weak correlation between the stellar colours and metallicities is found in the bright (mV < 18 or MV <-1) RGB.
![\begin{figure}
\par\includegraphics[width=8.8cm,clip]{CI2018f6.epsi}\end{figure}](/articles/aa/full/2002/31/aa2018/img79.gif) |
Figure 6:
The same as Fig. 1, but for models E-G.
Different lines mean different IMF powers; model E (x=1.75: dashed line);
model F (x=1.95: solid line); model G (x=2.15; dotted-dashed line).
The star formation time scale is the same as
for the solar neighbourhood disc, i.e.,
(Gyr-1). (This figure is available in color in electronic form.) |
| Open with DEXTER | |
In model C, the RHB is more populous and brighter than in model B. This is because the longer duration of the star formation period increases the number of younger and more massive core-He burning stars. However, the difference between models B and C is so small that it is difficult to determine the final epoch of star formation from the CMD that does not reach down to the turnoff level. Nevertheless, it can be said that, in the dSph Draco, chemical evolution was very slow and the duration of star formation was at least longer than 3.9-6.5 Gyr.
This evolutionary picture can explain both the narrow RGB and the populous red HB of the Draco dSph. Thus, the second parameter problem in the dSph Draco is solved for the first time by introducing relatively long duration of star formation (>3.9-6.5 Gyr) which is fully consistent with the observed abundance patterns.
![\begin{figure}
\par\includegraphics[angle=270,width=18cm,clip]{CI2018f7.epsi}\end{figure}](/articles/aa/full/2002/31/aa2018/img80.gif) |
Figure 7: The same as Fig. 4, but for models F and G. |
| Open with DEXTER | |
The abundance patterns and the CMDs of the dSphs Draco, Sextans, and Ursa Minor share the common features. It can be said that they have similar SFHs and CEHs. The CMD of the Sextans dSph (see Fig. 2 in Suntzeff et al. 1993; Fig. 1 in Shetrone et al. 2001) is characterised by a narrow RGB and a red HB similar to the dSph Draco. This suggests that the SFH of the dSph Sextans is similar to that of the dSph Draco. In the CMD of the Ursa Minor dSph (see Fig. 1 in Shetorne et al. 2001), the blue HB is more populous and the RGB is narrower. This might suggest that the time scale of star formation was shorter in the dSph Ursa Minor. Nevertheless, it can be said that, in the Draco dSph, the SFR was very low and the duration of star formation was at least longer than 3.9-6.5 Gyr. For the other dSphs, it is safe to say that the characteristics of the SFHs are the low SFRs and the long durations (>several Gyrs) of the star formation period.
For the dSph Draco, model C may conflict with the CMD obtained
by the Hubble Space Telescope (Grillmair et al. 1998).
Through a comparison with the fiducial lines of metal-poor globular
clusters M 68 and M 92, Grillmair et al. (1998) suggested that the dSph Draco
is older than M 68 and M 92 by
 Gyr.
Their result, however, seems inconclusive. Firstly, the
sparseness of the photometric sample makes it difficult to measure
the contribution of any intermediate-age population.
Although a predominant RHB is the characteristic of the dSph Draco,
the few RHB stars appeared in their CMDs.
Secondly, they used different techniques for photometry
and presented the combined results.
For bright stars aperture photometry was adopted,
while the point spread function fitting method was
used for faint stars. The border is unclear.
This causes systematic discrepancies between
the photometry of faint and bright stars.
Third, a comparison with M 68 and M 92 is questionable.
They used the F606W filter of the WFPC2 system.
However, the WFPC2 Instrument Handbook
recommends that the F555W filter is a better approximation
to the Johnson V-band than the F606W.
Their filter selection could have reduced the accuracy of
the photometric calibration.
Because of the combination of these uncertainties,
it is dangerous to place much faith on their age estimation.
More data are required to clarify these matters and
images of a wide special coverage are particularly important.
Gyr.
Their result, however, seems inconclusive. Firstly, the
sparseness of the photometric sample makes it difficult to measure
the contribution of any intermediate-age population.
Although a predominant RHB is the characteristic of the dSph Draco,
the few RHB stars appeared in their CMDs.
Secondly, they used different techniques for photometry
and presented the combined results.
For bright stars aperture photometry was adopted,
while the point spread function fitting method was
used for faint stars. The border is unclear.
This causes systematic discrepancies between
the photometry of faint and bright stars.
Third, a comparison with M 68 and M 92 is questionable.
They used the F606W filter of the WFPC2 system.
However, the WFPC2 Instrument Handbook
recommends that the F555W filter is a better approximation
to the Johnson V-band than the F606W.
Their filter selection could have reduced the accuracy of
the photometric calibration.
Because of the combination of these uncertainties,
it is dangerous to place much faith on their age estimation.
More data are required to clarify these matters and
images of a wide special coverage are particularly important.
In the above discussion, the decline in [Mg/Fe] observed in
the dSphs is interpreted as the effect of the chemical enrichment by SNeIa.
Since the signal-to-noise ratios of the data
(Shetrone et al. 2001;
 )
for the dSphs
are lower than other observations for metal-poor stars
(e.g., McWilliams et al. 1995;
)
for the dSphs
are lower than other observations for metal-poor stars
(e.g., McWilliams et al. 1995;
 ),
one might argue that the quality of the data
is not high enough to study the CEHs.
However, the goal of Shetrone et al. (2001)
was the measurement of overall abundance differences, not
absolute values as presented in their study,
and it can be said that [/Fe] declines at
on average
(see Figs. 4 and 5 in Shetrone et al. 2001).
Thus, it is a pertinent interpretation that enrichment by SNeIa causes the
decline of [/Fe].
Spectroscopic observations of high signal-to-noise ratios are required
to confirm this.
),
one might argue that the quality of the data
is not high enough to study the CEHs.
However, the goal of Shetrone et al. (2001)
was the measurement of overall abundance differences, not
absolute values as presented in their study,
and it can be said that [/Fe] declines at
on average
(see Figs. 4 and 5 in Shetrone et al. 2001).
Thus, it is a pertinent interpretation that enrichment by SNeIa causes the
decline of [/Fe].
Spectroscopic observations of high signal-to-noise ratios are required
to confirm this.
We have shown that low SFRs
can explain the observed trends in the [Mg/Fe]-[Fe/H] diagram based on
models assuming the Salpeter IMF.
However, models of steeper IMFs and higher
can also reproduce the trends.
The steeper IMFs lead to slow chemical evolution, so that
SNe Ia start to explode at low metallicity.
This results in the decline of [Mg/Fe].
Figure 6 shows chemical evolution models E-G
assuming different IMFs, where the IMF slopes are
x=1.75, 1.95, and 2.15, respectively,
and
(a standard SFR for the solar neighbourhood; Arimoto et al. 1992).
These models, except for model E, are also consistent with the observations.
As with model A, the abundance ratios
predicted by model E are too high and thus inconsistent
with the observations.
For the observed metallicity range (
![$\rm [Fe/H]< -1.4$](/articles/aa/full/2002/31/aa2018/img84.gif) ),
the trends of [Mg/Fe] of models E-G are very similar
to those of models A-D, although they become different
at higher metallicity (see Fig. 1).
),
the trends of [Mg/Fe] of models E-G are very similar
to those of models A-D, although they become different
at higher metallicity (see Fig. 1).
Figures 7a and b represent the CMDs simulated by models F and G, respectively. The photometric errors and detection completeness are taken from Piatek et al. (2001), i.e., the same as the simulations of models B and C shown in Fig. 4. The CMDs in Fig. 7 resemble those in Fig. 4 in terms of the morphologies of RGB and HB. The slow chemical evolution and the long (>1.6 Gyr) durations of star formation of models F and G result in a narrow RGB and the populous RHB by the same reasons as those of models B and C. This indicates that both abundance patterns and morphologies of the RGB and HB become similar when models have similar age-metallicity relations (AMRs).
![\begin{figure}
\par\includegraphics[width=18cm,clip]{CI2018f8.epsi}\end{figure}](/articles/aa/full/2002/31/aa2018/img85.gif) |
Figure 8:
Age-metallicity relations of models A-D (panel a))
and E-G (panel b)).
The adopted values of
(Gyr-1)
or IMF power are shown on the panel. (This figure is available in color in electronic form.) |
| Open with DEXTER | |
). Since both the abundance patterns
and the morphologies of the RGB and HB are affected by CEHs,
an additional information is necessary to solve the degeneracy of IMF and SFR.
In the models E-G the initial star formation lasts
only 1.6-2.2 Gyrs, while in the models B-C it continues
as long as 3.9-6.5 Gyrs. Therefore, the models B-C should
give systematically brighter turnoff magnitudes
than the models E-G, and magnitude difference
between the main sequence turnoff and the HB
 in the models E-G should be smaller than in the models B-C.
The models E-G give
is 3.1 mag,
while the models B and C does
in the models E-G should be smaller than in the models B-C.
The models E-G give
is 3.1 mag,
while the models B and C does
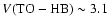 mag
and 2.8 mag,
respectively. Deeper images with wider field of views
will allow us to determine the final epochs of the initial star formation.
mag
and 2.8 mag,
respectively. Deeper images with wider field of views
will allow us to determine the final epochs of the initial star formation.
Figures 1 and 6 show that [Mg/Fe] converges at higher metallicity in the models with the different SFRs and that it does not in those with the different IMFs. This difference allows us to derive the IMF and SFR independently. Abundance patterns in more massive dwarf galaxies and/or dwarf irregular galaxies will test whether the IMF or SFR produces in the abundance patterns and low metallicities in the dSphs. We note that even steeper (x>2.75) IMFs are required to explain the low metallicities of dwarf irregular galaxies if the IMF is the primary cause of the low metallicities. The CMD of the dwarf irregular galaxies in the Local Group reveal that they contain very old (>10 Gyr) populations as well as young ones, i.e., the star formation and chemical enrichment have continued for at least 10 Gyr. Since they are still metal-poor, extremely steep (x>2.75) IMFs are required, which have never been reported. Therefore, we believe that low SFRs are the primary characteristic of the SFHs of the dSphs.
So far, the gas infall and outflow during star formation have been neglected, since no evidence of the gas infall and outflow has presented. Metallicity distribution could provide a clue to judge whether gas infall or outflow should be considered. We stress that spectroscopic observations is indispensable to derive a metallicity distribution. Figure 5 demonstrates little correlation between the colours and metallicities of the RGB stars. Because of the age-metallicity degeneracy and contamination by AGB stars, a stellar colour is not always a good indicator of the metallicity. Thus, a careful procedure should be adopted to convert stellar colours into metallicities (Ikuta 2001), although a relatively simple technique is often used (e.g., Harris & Harris 1999).
Long lasting star formation at a very low rate
explains the observed trend of [Mg/Fe] and the CMDs.
Because of the low SFRs, plenty of gas
(97 percent of the galaxy mass)
still remain even at the final epoch of star formation
(i.e.,
 ).
The remaining gas has to be removed to complete star formation and
to evolve to a gas-poor system. Energy injection from supernovae
could not be a sufficient mechanism to expel the gas
from dwarf galaxies (MacLow & Ferrara 1999; Ikuta 2001).
If this is the case, gas removal from dwarf galaxies should result from
external mechanisms such as ram pressure stripping and/or
tidal shocks. Studying the SFHs of 18 dwarf galaxies in the Local Group
based on the CMDs derived by a uniform method of photometry,
Ikuta (2001) found that the durations of star formation period
correlate with the distances from the Milky Way or M 31.
The correlation may suggest that the environmental effects play a key
role in the evolution of the dwarf galaxies.
Numerical simulations (Moore et al. 1998; Mayer et al. 2001) clearly
showed that late-type dwarf galaxies entering the dark matter
halo of a massive galaxy are transformed into
early-type owing to repeated tidal stripping
and dynamical instabilities.
Thus, we conclude that the star formation
in the dSphs Draco, Sextans, and Ursa Minor
terminated due to gas stripping by the Milky Way.
).
The remaining gas has to be removed to complete star formation and
to evolve to a gas-poor system. Energy injection from supernovae
could not be a sufficient mechanism to expel the gas
from dwarf galaxies (MacLow & Ferrara 1999; Ikuta 2001).
If this is the case, gas removal from dwarf galaxies should result from
external mechanisms such as ram pressure stripping and/or
tidal shocks. Studying the SFHs of 18 dwarf galaxies in the Local Group
based on the CMDs derived by a uniform method of photometry,
Ikuta (2001) found that the durations of star formation period
correlate with the distances from the Milky Way or M 31.
The correlation may suggest that the environmental effects play a key
role in the evolution of the dwarf galaxies.
Numerical simulations (Moore et al. 1998; Mayer et al. 2001) clearly
showed that late-type dwarf galaxies entering the dark matter
halo of a massive galaxy are transformed into
early-type owing to repeated tidal stripping
and dynamical instabilities.
Thus, we conclude that the star formation
in the dSphs Draco, Sextans, and Ursa Minor
terminated due to gas stripping by the Milky Way.
The hierarchical clustering galaxy formation model
suggested that star formation in dwarf galaxies can only occur
before the cosmological re-ionisation epoch and there is no
major star formation activities later because gas cannot cool and
condense to form stars (e.g., Cen 2001).
This appears to be inconsistent with
stellar populations observed in the Local Group dwarf galaxies.
CMDs obtained by the HST (e.g., Ikuta 2001) and
our study presented in this paper clearly show
extended and recent star formation activities in the Local Group
dwarf galaxies.The issue is still being debated.
However, a more recent simulation (Kitayama et al. 2001)
suggested that star formation can occur in
small objects if they have baryonic mass larger than the threshold mass
of
 and
and
 at redshifts
of <3 and 5, respectively.
The masses of today's dSphs in the Local Group
are
at redshifts
of <3 and 5, respectively.
The masses of today's dSphs in the Local Group
are
 (e.g., Mateo 1998) and
our results imply that progenitors of today's dSphs lost
97% of their mass after the long lasting star formation.
Therefore, the masses of the progenitors are estimated at
(e.g., Mateo 1998) and
our results imply that progenitors of today's dSphs lost
97% of their mass after the long lasting star formation.
Therefore, the masses of the progenitors are estimated at
 .
Since these exceed the threshold predicted by Kitayama et al. (2001),
the SFHs derived here do not contradict
recent simulations of the formation of dwarf galaxies.
.
Since these exceed the threshold predicted by Kitayama et al. (2001),
the SFHs derived here do not contradict
recent simulations of the formation of dwarf galaxies.
Based on comparisons between the theoretical chemical evolution models and the observed abundance patterns, we conclude that the initial star formation continued for a long duration (>3.9-6.5 Gyr) in the dSphs Draco, Sextans, and Ursa Minor. Our simulation of the CMDs shows that the long duration of star formation can solve the second parameter problem of the Draco dSph. Because of the age-metallicity degeneracy, the RGBs are kept narrow and tight despite their large metallicity dispersions.
We have discussed the two cases which are consistent with the observed
abundance patterns and the CMDs.
The first case is a combination of low SFRs
(
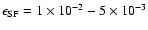 Gyr-1)
and the Salpeter IMF (x=1.35), while
the second is a combination of the solar neighbourhood SFR (
Gyr-1) and the steeper IMFs (
x=1.75-2.15).
The two cases are discriminated neither by the abundance
patterns nor by the CMDs of bright stars.
However, the initial star formation period is as long as 3.9-6.5 Gyrs
if the SFR is low, while it is much shorter (1.6-2.2 Gyrs) if the
SFR is high. Thus, turnoff magnitude should be different between
the two cases. Deeper images with wider field of views
allow us to determine the final epochs of the initial star formation.
Gyr-1)
and the Salpeter IMF (x=1.35), while
the second is a combination of the solar neighbourhood SFR (
Gyr-1) and the steeper IMFs (
x=1.75-2.15).
The two cases are discriminated neither by the abundance
patterns nor by the CMDs of bright stars.
However, the initial star formation period is as long as 3.9-6.5 Gyrs
if the SFR is low, while it is much shorter (1.6-2.2 Gyrs) if the
SFR is high. Thus, turnoff magnitude should be different between
the two cases. Deeper images with wider field of views
allow us to determine the final epochs of the initial star formation.
Acknowledgements
We wish to express our gratitude to the anonymous referee for very helpful suggestions and comments. We are also grateful to T. Kodama, and H. Susa, for fruitful discussion and comments and to B. Jones who carefully read this manuscript and gave us helpful comments and suggestions. C.I. wishes to thank the Japan Society for Promotion of Science for financial support.