A&A 390, 533-553 (2002)
DOI: 10.1051/0004-6361:20020603
S. Hony1 - L. B. F. M. Waters1,2 - A. G. G. M. Tielens3,4
1 -
Astronomical Institute ``Anton Pannekoek'', Kruislaan 403, 1098 SJ
Amsterdam, The Netherlands
2 -
Instituut voor Sterrenkunde, K.U. Leuven, Celestijnenlaan 200B, 3001
Heverlee, Belgium
3 -
SRON Laboratory for Space Research Groningen, PO Box 800, 9700 AV
Groningen, The Netherlands
4 -
Kapteyn Astronomical Institute PO Box 800, 9700 AV
Groningen, The Netherlands
Received 4 March 2002 / Accepted 16 April 2002
Abstract
We present 2-45 ![]() m spectra of a large sample of
carbon-rich evolved stars in order to study the "30''
m spectra of a large sample of
carbon-rich evolved stars in order to study the "30'' ![]() m
feature. We find the "30''
m
feature. We find the "30'' ![]() m feature in a wide
range of sources: low mass loss carbon stars, extreme carbon-stars,
post-AGB objects and planetary nebulae. We extract the profiles from
the sources by using a simple systematic approach to model the
continuum. We find large variations in the wavelength and width of
the extracted profiles of the "30''
m feature in a wide
range of sources: low mass loss carbon stars, extreme carbon-stars,
post-AGB objects and planetary nebulae. We extract the profiles from
the sources by using a simple systematic approach to model the
continuum. We find large variations in the wavelength and width of
the extracted profiles of the "30'' ![]() m feature. We modelled
the whole range of profiles in a simple way by using magnesium
sulfide (MgS) dust grains with a MgS grain temperature different
from the continuum temperature. The systematic change in peak
positions can be explained by cooling of MgS grains as the star
evolves off the AGB. In several sources we find that a residual
emission excess at
m feature. We modelled
the whole range of profiles in a simple way by using magnesium
sulfide (MgS) dust grains with a MgS grain temperature different
from the continuum temperature. The systematic change in peak
positions can be explained by cooling of MgS grains as the star
evolves off the AGB. In several sources we find that a residual
emission excess at ![]() 26
26 ![]() m can also be fitted using MgS
grains but with a different grains shape distribution. The profiles
of the "30''
m can also be fitted using MgS
grains but with a different grains shape distribution. The profiles
of the "30'' ![]() m feature in planetary nebulae are narrower than
our simple MgS model predicts. We discuss the possible reasons for
this difference. We find a sample of warm carbon-stars with very
cold MgS grains. We discuss possible causes for this phenomenon. We
find no evidence for rapid destruction of MgS during the planetary
nebula phase and conclude that the MgS may survive to be
incorporated in the ISM.
m feature in planetary nebulae are narrower than
our simple MgS model predicts. We discuss the possible reasons for
this difference. We find a sample of warm carbon-stars with very
cold MgS grains. We discuss possible causes for this phenomenon. We
find no evidence for rapid destruction of MgS during the planetary
nebula phase and conclude that the MgS may survive to be
incorporated in the ISM.
Key words: stars: AGB and post-AGB - stars: carbon - circumstellar matter - stars: mass-loss - planetary nebulae: general - infrared: stars
Goebel & Moseley (1985) proposed solid magnesium sulfide (MgS) as
the possible carrier of the "30'' ![]() m feature. Their suggestion is
based on the coincidence of the emission feature with the sole
IR-resonance of MgS (Nuth et al. 1985; Begemann et al. 1994)
and the fact that MgS is one of the expected condensates around these
objects (Lattimer et al. 1978; Lodders & Fegley 1999). Several
authors have taken up on this suggestion and compared observations
with laboratory measurements of MgS. These comparisons were further
facilitated by the publication of the optical constants of MgS in the
IR range by Begemann et al. (1994). These authors found that the
far IR excess of CW Leo can be successfully modelled using MgS grains
with a broad shape distribution.
m feature. Their suggestion is
based on the coincidence of the emission feature with the sole
IR-resonance of MgS (Nuth et al. 1985; Begemann et al. 1994)
and the fact that MgS is one of the expected condensates around these
objects (Lattimer et al. 1978; Lodders & Fegley 1999). Several
authors have taken up on this suggestion and compared observations
with laboratory measurements of MgS. These comparisons were further
facilitated by the publication of the optical constants of MgS in the
IR range by Begemann et al. (1994). These authors found that the
far IR excess of CW Leo can be successfully modelled using MgS grains
with a broad shape distribution.
More recently, Jiang et al. (1999) and
Szczerba et al. (1999) have modelled the spectra taken with the
Short Wavelength Spectrometer (SWS) (de Graauw et al. 1996)
on-board the Infrared Space Observatory (ISO)
(Kessler et al. 1996) of the C-star IRAS 03313+6058 and the
post-AGB object IRAS 04296+3429 respectively. They find that for
these sources which show a strong "30'' ![]() m feature, the elemental
abundances of Mg and S are consistent with MgS as the carrier of the
feature.
m feature, the elemental
abundances of Mg and S are consistent with MgS as the carrier of the
feature.
Hrivnak et al. (2000) and Volk et al. (2002) have analysed ISO
spectra of a sample of post-AGBs. They find that the profile of the
"30'' ![]() m feature varies between sources. Although these authors
state that this decomposition is not unique, they find that their
"30''
m feature varies between sources. Although these authors
state that this decomposition is not unique, they find that their
"30'' ![]() m feature is composed of two sub features: one feature
peaking near 26
m feature is composed of two sub features: one feature
peaking near 26 ![]() m and an other near 30
m and an other near 30 ![]() m. Using these two
components in varying relative amounts they are able to explain the
range of features found in their sample. Based on the discovery of
these sub features they consider the carrier(s) of the "30''
m. Using these two
components in varying relative amounts they are able to explain the
range of features found in their sample. Based on the discovery of
these sub features they consider the carrier(s) of the "30'' ![]() m
feature to be unidentified.
m
feature to be unidentified.
Other materials have also been proposed as carriers of the "30''
![]() m feature. Duley (2000) suggests that the "30''
m feature. Duley (2000) suggests that the "30''
![]() m feature may be indicative of carbon-based linear molecules with
specific side groups. Such molecules have strong absorption bands
throughout the 15-30
m feature may be indicative of carbon-based linear molecules with
specific side groups. Such molecules have strong absorption bands
throughout the 15-30 ![]() m range. Papoular (2000)
discusses the possible contribution of carbonaceous dust grains with
oxygen in the structure. Some of these materials may show IR emission
in the 20-30
m range. Papoular (2000)
discusses the possible contribution of carbonaceous dust grains with
oxygen in the structure. Some of these materials may show IR emission
in the 20-30 ![]() m range. Since the optical properties of such
grains are sensitive to the exact composition they might be able to
explain the range of features found in the C-rich evolved stars.
Recently, Grishko et al. (2001) have proposed hydrogenated
amorphous carbon (HAC) as a possible carrier of the "30''
m range. Since the optical properties of such
grains are sensitive to the exact composition they might be able to
explain the range of features found in the C-rich evolved stars.
Recently, Grishko et al. (2001) have proposed hydrogenated
amorphous carbon (HAC) as a possible carrier of the "30'' ![]() m
feature.
m
feature.
The ISO mission has provided an excellent database of observations to
study the properties of the "30'' ![]() m feature in detail and test
the suggested identifications systematically. The wavelength
coverage of the SWS instrument (2-45
m feature in detail and test
the suggested identifications systematically. The wavelength
coverage of the SWS instrument (2-45 ![]() m) is sufficient to
determine a reliable continuum. The sensitivity of the ISO
spectrograph allows detection of relatively weak features. The resolving
power of the instrument (
m) is sufficient to
determine a reliable continuum. The sensitivity of the ISO
spectrograph allows detection of relatively weak features. The resolving
power of the instrument (![]() /
/
![]() -1500) makes
it feasible to study possible substructure in the "30''
-1500) makes
it feasible to study possible substructure in the "30'' ![]() m
feature. Thus these observations allow a study of the "30''
m
feature. Thus these observations allow a study of the "30'' ![]() m
feature in unprecedented detail in a large sample of sources.
m
feature in unprecedented detail in a large sample of sources.
In this paper, we investigate the shape and strength of the "30
![]() m'' in a wide range of objects from visual visible C-stars,
extreme C-stars, post-AGBs to PNe in order to further test the MgS or
other identifications and map systematic differences between the
feature in different classes of sources.
m'' in a wide range of objects from visual visible C-stars,
extreme C-stars, post-AGBs to PNe in order to further test the MgS or
other identifications and map systematic differences between the
feature in different classes of sources.
Our paper is organised as follows. In Sect. 2, we
describe the sample and the data reduction. In
Sect. 3, we present the way in which we modelled the
continuum in order to extract the feature properties. In
Sect. 4, we present the full range of extracted
profile shapes and peak positions of the "30'' ![]() m feature and we
discuss the possible ways of interpreting the observed profiles. In
Sect. 5, we develop a simple model using MgS for the
"30''
m feature and we
discuss the possible ways of interpreting the observed profiles. In
Sect. 5, we develop a simple model using MgS for the
"30'' ![]() m feature. In Sect. 6, we present the
model results and compare them to the astronomical spectra. In
Sect. 7, we present a correlation study between
several feature properties and stellar parameters. Finally, in
Sect. 8, we discuss the implications of our model
results and the consequences for the MgS identification. In
particular, we discuss possible causes for the deviating profiles and
the possibility that MgS produced in carbon-rich evolved stars will be
incorporated in the interstellar medium (ISM).
m feature. In Sect. 6, we present the
model results and compare them to the astronomical spectra. In
Sect. 7, we present a correlation study between
several feature properties and stellar parameters. Finally, in
Sect. 8, we discuss the implications of our model
results and the consequences for the MgS identification. In
particular, we discuss possible causes for the deviating profiles and
the possibility that MgS produced in carbon-rich evolved stars will be
incorporated in the interstellar medium (ISM).
| Object | IRAS name | Obs.a | TDTb | Sp./T | Obj. Type | ||
| Mode | (J2000) | (J2000) | kK | ||||
| NGC 40 | 00102+7214 | 01(3) | 00 13 01.10 | +72 31 19.09 | 30003803 | WC | PN |
| IRAS 00210+6221 | 00210+6213 | 01(1) | 00 23 51.20 | +62 38 07.01 | 40401901 | C-star | |
| IRAS 01005+7910 | 01005+7910 | 01(2) | 01 04 45.70 | +79 26 47.00 | 68600302 | OBe | post-AGB |
| HV Cas | 01080+5327 | 01(1) | 01 11 03.50 | +53 43 40.30 | 62902503 | C-star | |
| RAFGL 190 | 01144+6658 | 01(2) | 01 17 51.60 | +67 13 53.90 | 68800128 | C-star | |
| R Scl
|
01246-3248 | C-star | |||||
| - | 01(2) | 01 26 58.10 | -32 32 34.91 | 37801213 | |||
| - | 01(2) | 01 26 58.05 | -32 32 34.19 | 37801443 | |||
| IRAS Z02229+6208 | Z02229+6208 | 01(1) | 02 26 41.80 | +62 21 22.00 | 44804704 | G0 | post-AGB |
| RAFGL 341 | 02293+5748 | 01(1) | 02 33 00.16 | +58 02 04.99 | 80002450 | C-star | |
| IRC+50 096 | 03229+4721 | 01(2) | 03 26 29.80 | +47 31 47.10 | 81002351 | C-star | |
| IRAS 03313+6058 | 03313+6058 | 01(1) | 03 35 31.50 | +61 08 51.00 | 62301907 | C-star | |
| U Cam | 03374+6229 | 01(2) | 03 41 48.16 | +62 38 55.21 | 64001445 | C-star | |
| RAFGL 618 | 04395+3601 | 01(3) | 04 42 53.30 | +36 06 52.99 | 68800561 | B0 | PN |
| W Ori | 05028+0106 | 01(3) | 05 05 23.70 | +01 10 39.22 | 85801604 | C-star | |
| IC 418 | 05251-1244 | 01(2) | 05 27 28.31 | -12 41 48.19 | 82901301 | 361 | PN |
| V636 Mon | 06226-0905 | 01(1) | 06 25 01.60 | -09 07 16.00 | 86706617 | C-star | |
| RAFGL 940 | 06238+0904 | 01(2) | 06 26 37.30 | +09 02 16.01 | 87102602 | C-star | |
| IRAS 06582+1507 | 06582+1507 | 01(2) | 07 01 08.40 | +15 03 40.00 | 71002102 | C-star | |
| HD 56126
|
07134+1005 | F5 | post-AGB | ||||
| - | 06 | 07 16 10.20 | +09 59 48.01 | 71802201 | |||
| - | 06 | 07 16 10.30 | +09 59 48.01 | 72201702 | |||
| - | 01(3) | 07 16 10.20 | +09 59 48.01 | 72201901 | |||
| CW Leo | 09451+1330 | 06 | 09 47 57.27 | +13 16 42.82 | 19900101 | C-star | |
| NGC 3918 | 11478-5654 | 01(1) | 11 50 18.91 | -57 10 51.10 | 29900201 | PN | |
| RU Vir | 12447+0425 | 01(2) | 12 47 18.43 | +04 08 41.89 | 24601053 | C-star | |
| IRAS 13416-6243 | 13416-6243 | 01(3) | 13 45 07.61 | -62 58 18.98 | 62803904 | post-AGB | |
| II Lup | 15194-5115 | 06 | 15 23 04.91 | -51 25 59.02 | 29700401 | C-star | |
| V Crb | 15477+3943 | 06 | 15 49 31.21 | +39 34 17.80 | 25502252 | C-star | |
| PN K 2-16
|
16416-2758 | WC | PN | ||||
| - | 01(1) | 16 44 49.10 | -28 04 05.02 | 29302010 | |||
| - | 01(2) | 16 44 49.10 | -28 04 05.02 | 67501241 | |||
| IRAS 16594-4656 | 16594-4656 | 01(1) | 17 03 09.67 | -47 00 27.90 | 45800441 | post-AGB | |
| NGC 6369 | 17262-2343 | 01(1) | 17 29 20.80 | -23 45 32.00 | 45601901 | WC82 | PN |
| IRC+20 326 | 17297+1747 | 01(1) | 17 31 54.90 | +17 45 20.02 | 81601210 | C-star | |
| CD-49 11554 | 17311-4924 | 01(2) | 17 35 02.41 | -49 26 22.31 | 10300636 | BIIIe | post-AGB |
| PN HB 5 | 17447-2958 | 01(3) | 17 47 56.11 | -29 59 39.70 | 49400104 | PN | |
| RAFGL 5416 | 17534-3030 | 01(1) | 17 56 36.90 | -30 30 47.02 | 12102004 | C-star | |
| T Dra | 17556+5813 | 01(2) | 17 56 23.30 | +58 13 06.38 | 34601702 | C-star | |
| RAFGL 2155 | 18240+2326 | 01(1) | 18 26 05.69 | +23 28 46.31 | 47100261 | C-star | |
| IRAS 18240-0244 | 18240-0244 | 01(1) | 18 26 40.00 | -02 42 56.99 | 14900804 | WC | PN |
| IRC+00 365 | 18398-0220 | 01(2) | 18 42 24.68 | -02 17 25.19 | 49901342 | C-star | |
| RAFGL 2256 | 18464-0656 | 01(1) | 18 49 10.35 | -06 53 03.41 | 48300563 | C-star | |
| PN K 3-17 | 18538+0703 | 01(2) | 18 56 18.05 | +07 07 25.61 | 49900640 | PN | |
| IRC+10 401 | 19008+0726 | 01(1) | 19 03 18.10 | +07 30 43.99 | 87201221 | C-star | |
| IRAS 19068+0544 | 19068+0544 | 01(1) | 19 09 15.40 | +05 49 05.99 | 47901374 | C-star | |
| NGC 6790 | 19204+0124 | 01(1) | 19 22 57.00 | +01 30 46.51 | 13401107 | 703 | PN |
| RAFGL 2392 | 19248+0658 | 01(1) | 19 27 14.40 | +07 04 09.98 | 85800120 | C-star | |
| NGC 6826 | 19434+5024 | 01(4) | 19 44 48.20 | +50 31 30.00 | 27200786 | 504 | PN |
| IRAS 19454+2920 | 19454+2920 | 01(1) | 19 47 24.25 | +29 28 11.78 | 52601347 | post-AGB | |
| HD 187885 | 19500-1709 | 01(2) | 19 52 52.59 | -17 01 49.58 | 14400346 | F2 | post-AGB |
| RAFGL 2477 | 19548+3035 | 01(1) | 19 56 48.26 | +30 43 59.20 | 56100849 | C-star | |
| IRAS 19584+2652 | 19584+2652 | 01(1) | 20 00 31.00 | +27 00 37.01 | 52600868 | C-star | |
| IRAS 20000+3239 | 20000+3239 | 01(1) | 20 01 59.50 | +32 47 33.00 | 18500531 | G8 | post-AGB |
| V Cyg
|
20396+4757 | C-star | |||||
| - | 01(2) | 20 41 18.20 | +48 08 29.00 | 42100111 | |||
| - | 01(2) | 20 41 18.20 | +48 08 29.00 | 42300307 |
| Object | IRAS name | Obs.a | TDTb | Sp./T | Obj. Type | ||
| Mode | (J2000) | (J2000) | kK | ||||
| NGC 7027
|
2005 | PN | |||||
| - | 01(4) | 21 07 01.71 | +42 14 09.10 | 02401183 | |||
| - | 01(1) | 21 07 01.70 | +42 14 09.10 | 23001356 | |||
| - | 01(2) | 21 07 01.70 | +42 14 09.10 | 23001357 | |||
| - | 01(3) | 21 07 01.70 | +42 14 09.10 | 23001358 | |||
| - | 01(4) | 21 07 01.63 | +42 14 10.28 | 55800537 | |||
| S Cep | 21358+7823 | 01(1) | 21 35 12.80 | +78 37 28.20 | 56200926 | C-star | |
| RAFGL 2688 | 01(3) | 21 02 18.80 | +36 41 37.79 | 35102563 | F5 | post-AGB | |
| RAFGL 2699 | 21027+5309 | 01(1) | 21 04 14.70 | +53 21 02.99 | 77800722 | C-star | |
| IC 5117 | 21306+4422 | 01(1) | 21 32 30.83 | +44 35 47.29 | 36701824 | 773 | PN |
| RAFGL 5625 | 21318+5631 | 01(1) | 21 33 22.30 | +56 44 39.80 | 11101103 | C-star | |
| IRAS 21489+5301 | 21489+5301 | 01(1) | 21 50 45.00 | +53 15 28.01 | 15901205 | C-star | |
| SAO 34504 | 22272+5435 | 01(2) | 22 29 10.31 | +54 51 07.20 | 26302115 | G5 | post-AGB |
| IRAS 22303+5950 | 22303+5950 | 01(1) | 22 32 12.80 | +60 06 04.00 | 77900836 | C-star | |
| IRAS 22574+6609 | 22574+6609 | 01(2) | 22 59 18.30 | +66 25 49.01 | 39601910 | post-AGB | |
| RAFGL 3068 | 23166+1655 | 01(2) | 23 19 12.48 | +17 11 33.40 | 37900867 | C-star | |
| RAFGL 3099 | 23257+1038 | 01(1) | 23 28 16.90 | +10 54 40.00 | 78200523 | C-star | |
| IRAS 23304+6147 | 23304+6147 | 01(3) | 23 32 44.94 | +62 03 49.61 | 39601867 | G2 | post-AGB |
| IRAS 23321+6545 | 23321+6545 | 01(1) | 23 34 22.53 | +66 01 50.41 | 25500248 | post-AGB | |
| IRC+40 540 | 23320+4316 | 01(2) | 23 34 27.86 | +43 33 00.40 | 38201557 | C-star | |
| non detections | |||||||
| R For | 02270-2619 | 01(1) | 02 29 15.30 | -26 05 56.18 | 82001817 | C-star | |
| SS Vir | 12226+0102 | 01(1) | 12 25 14.40 | +00 46 10.20 | 21100138 | C-star | |
| Y CVn | 12427+4542 | 01(2) | 12 45 07.80 | +45 26 24.90 | 16000926 | C-star | |
| RY Dra | 12544+6615 | 01(3) | 12 56 25.70 | +65 59 39.01 | 54300203 | C-star | |
| C* 2178 | 14371-6233 | 01(1) | 14 41 02.50 | -62 45 54.00 | 43600471 | C-star | |
| V1079 Sco | 17172-4020 | 01(1) | 17 20 46.20 | -40 23 18.10 | 46200776 | C-star | |
| T Lyr | 18306+3657 | 06 | 18 32 19.99 | +36 59 55.50 | 36100832 | C-star | |
| S Sct | 18476-0758 | 01(2) | 18 50 19.93 | -07 54 26.39 | 16401849 | C-star | |
| V Aql | 19017-0545 | 01(2) | 19 04 24.07 | -05 41 05.71 | 16402151 | C-star | |
| V460 Cyg | 21399+3516 | 01(1) | 21 42 01.10 | +35 30 36.00 | 74500512 | C-star | |
| PQ Cep | 21440+7324 | 01(1) | 21 44 28.80 | +73 38 03.01 | 42602373 | C-star | |
| TX Psc | 23438+0312 | 06 | 23 46 23.57 | +03 29 13.70 | 37501937 | C-star | |
a SWS observing mode used
(see de Graauw et al. 1996). Numbers in brackets correspond to
the scanning speed.
b TDT number which uniquely identifies each ISO observation.
![]() These spectra have been obtained by co-adding the separate
SWS spectra also listed in the table, see text.
These spectra have been obtained by co-adding the separate
SWS spectra also listed in the table, see text.
Effective temperatures from 1Mendez et al. (1992),
2Perinotto (1991), 3Kaler & Jacoby (1991),
4Quigley & Bruhweiler (1995) and 5Latter et al. (2000).
We present in Fig. 1 the IRAS two-colour diagram
for the sources in our sample following van der Veen & Habing (1988).
There are four sources in our sample without an entry in the IRAS
point source catalogue. For these sources we have used ISO/SWS and LWS
observations at 12, 25, 60 and 100 ![]() m to calculate the IRAS
colours. For IRAS Z02229, no measurements at 60 and 100
m to calculate the IRAS
colours. For IRAS Z02229, no measurements at 60 and 100 ![]() m are
available. In Fig. 1, the warmest sources are
located in the lower left corner. These are the optically visible
carbon stars with a low present-day mass-loss rate
(
m are
available. In Fig. 1, the warmest sources are
located in the lower left corner. These are the optically visible
carbon stars with a low present-day mass-loss rate
(
![]() ). With increasing mass loss
the stars become redder and move up and to the right. After the AGB,
when the mass loss has terminated, the dust moves away from the star
and cools; i.e., these sources move further to the top-right corner of
the diagram. The C-stars located above the main group of C-stars have
a clear 60
). With increasing mass loss
the stars become redder and move up and to the right. After the AGB,
when the mass loss has terminated, the dust moves away from the star
and cools; i.e., these sources move further to the top-right corner of
the diagram. The C-stars located above the main group of C-stars have
a clear 60 ![]() m excess. This is evidence for an additional cool dust
component. Some of these sources are known to have an extended or
detached dust shell around them (Young et al. 1993). The empty
region between the C-stars and the post-AGBs is physical. When the
mass loss stops the star quickly loses its warmest dust and within a
short time span (<1000 yr) the star moves to the right in the
two-colour diagram. Notice how the sources without a detected "30''
m excess. This is evidence for an additional cool dust
component. Some of these sources are known to have an extended or
detached dust shell around them (Young et al. 1993). The empty
region between the C-stars and the post-AGBs is physical. When the
mass loss stops the star quickly loses its warmest dust and within a
short time span (<1000 yr) the star moves to the right in the
two-colour diagram. Notice how the sources without a detected "30'' ![]() m feature cluster on the left of the diagram, i.e., among the
warmest C-stars.
m feature cluster on the left of the diagram, i.e., among the
warmest C-stars.
The instrumental effects between 27 and 29 ![]() m and the fact that
each of the subbands is independently flux calibrated make it
necessary to devise a strategy for splicing the band 3D, 3E and 4
data. There is unfortunately no objective way to choose this strategy.
We choose to assume minimal spectral structure between the end of
subband 3D and the beginning of band 4, i.e. to splice the subband
3D-4 data in such a way that the matching slopes of 3D and 4 also
match in flux level. Some examples are shown in
Fig. 2. The observed discontinuities between
subbands are relatively small (<20 per cent) and can be understood
as the result of absolute flux calibration uncertainties alone.
m and the fact that
each of the subbands is independently flux calibrated make it
necessary to devise a strategy for splicing the band 3D, 3E and 4
data. There is unfortunately no objective way to choose this strategy.
We choose to assume minimal spectral structure between the end of
subband 3D and the beginning of band 4, i.e. to splice the subband
3D-4 data in such a way that the matching slopes of 3D and 4 also
match in flux level. Some examples are shown in
Fig. 2. The observed discontinuities between
subbands are relatively small (<20 per cent) and can be understood
as the result of absolute flux calibration uncertainties alone.
The resultant spectra for the sources that exhibit a "30'' ![]() m
feature are shown in Figs. 3, 4. The SWS spectra of this
large group of objects show a spectacular range in colour temperature,
molecular absorption bands and solid state features. The C-stars have
molecular absorption bands of C2H2 at 3.05, 7-8 and 14
m
feature are shown in Figs. 3, 4. The SWS spectra of this
large group of objects show a spectacular range in colour temperature,
molecular absorption bands and solid state features. The C-stars have
molecular absorption bands of C2H2 at 3.05, 7-8 and 14 ![]() m,
of HCN at 7 and 14
m,
of HCN at 7 and 14 ![]() m, CO at 4.7
m, CO at 4.7 ![]() m and C3 at 4.8-6
m and C3 at 4.8-6
![]() m. The sharp absorption band at 14
m. The sharp absorption band at 14 ![]() m is due to C2H2and HCN. There is an emission feature due to solid SiC at 11.4
m is due to C2H2and HCN. There is an emission feature due to solid SiC at 11.4 ![]() m.
In the reddest C-stars, we find the SiC in absorption. We also find
evidence for a weak depression in the 14-22
m.
In the reddest C-stars, we find the SiC in absorption. We also find
evidence for a weak depression in the 14-22 ![]() m range in the
reddest objects. This depression could be due to aliphatic chain
molecules like those found in RAFGL 618 (Cernicharo et al. 2001).
m range in the
reddest objects. This depression could be due to aliphatic chain
molecules like those found in RAFGL 618 (Cernicharo et al. 2001).
The post-AGBs and PNe exhibit many, sometimes broad solid state
emission features. In many sources we find emission due to polycyclic
aromatic hydrocarbons in the 3-15 ![]() m range. There is a broad
plateau feature from 10-15
m range. There is a broad
plateau feature from 10-15 ![]() m which may be due to hydrogenated
amorphous carbon (Guillois et al. 1996; Kwok et al. 2001).
Many post-AGBs and two PNe in the sample have a feature peaking at
20.1
m which may be due to hydrogenated
amorphous carbon (Guillois et al. 1996; Kwok et al. 2001).
Many post-AGBs and two PNe in the sample have a feature peaking at
20.1 ![]() m, called the "21''
m, called the "21'' ![]() m feature in the literature.
Recently the carrier of this feature has been identified with TiC
(von Helden et al. 2000). The feature at 23
m feature in the literature.
Recently the carrier of this feature has been identified with TiC
(von Helden et al. 2000). The feature at 23 ![]() m found in IRAS 18240 and
PN K3-17 is likely due to FeS (Hony et al. 2002). These absorption
and emission features have to be taken into account when determining
the profile of the "30''
m found in IRAS 18240 and
PN K3-17 is likely due to FeS (Hony et al. 2002). These absorption
and emission features have to be taken into account when determining
the profile of the "30'' ![]() m feature or the shape of the
underlying continuum.
m feature or the shape of the
underlying continuum.
Focusing on the "30'' ![]() m feature we can see variations in the
strength and shape of the band. The most marked difference is however
a shift in the peak position going from 26
m feature we can see variations in the
strength and shape of the band. The most marked difference is however
a shift in the peak position going from 26 ![]() m in some of the AGB
stars to 38
m in some of the AGB
stars to 38 ![]() m in the PNe. The dashed line in
Figs. 3 and 4 indicates
m in the PNe. The dashed line in
Figs. 3 and 4 indicates
![]()
![]() m. There are systematic changes in the appearance of the "30''
m. There are systematic changes in the appearance of the "30''
![]() m feature from the C-stars to the PNe. The feature in the
C-stars almost exclusively peaks at 26
m feature from the C-stars to the PNe. The feature in the
C-stars almost exclusively peaks at 26 ![]() m. There are some
exceptions like R Scl. In the post-AGB sample, the feature is broader
and in some sources the feature peaks long ward of 26
m. There are some
exceptions like R Scl. In the post-AGB sample, the feature is broader
and in some sources the feature peaks long ward of 26 ![]() m. In the
PNe sample, there are no sources that peak at 26
m. In the
PNe sample, there are no sources that peak at 26 ![]() m.
However, the appearance of a broad feature like the "30''
m.
However, the appearance of a broad feature like the "30'' ![]() m
feature is sensitive to the shape of the underlying dust continuum,
especially since we have a sample with such a wide range of continuum
colour temperatures.
m
feature is sensitive to the shape of the underlying dust continuum,
especially since we have a sample with such a wide range of continuum
colour temperatures.
| cont. | "30'' |
cont. | "30'' | |||||||||||||
| Object |
| p |
| fwhm | flux | P/C |
|
Object |
| p |
| fwhm | flux | P/C |
|
|
| [K] | [ | [ | [W/m2] | [K] | [K] | [ | [ | [W/m2] | [K] | |||||||
| NGC 40 | 150 | 0 | 33.6 | 10.1 | 5.9e-13 | 0.7 | 110 | T Dra | 1210 | 0 | 30.2 | 10.1 | 4.8e-13 | 0.4 | 200 | |
| IRAS 00210 | 285 | 0.5 | 28.4 | 10.7 | 6.4e-13 | 0.8 | 300 | RAFGL 2155 | 460 | 0 | 28.8 | 8.2 | 5.7e-12 | 0.6 | 400 | |
| IRAS 01005 | 130 | 1 | 30.0 | 11.1 | 6.6e-13 | 1.5 | 220 | IRAS 18240 | 160 | 1 | 32.8 | 13.1 | 1.0e-12 | 1.0 | 130 | |
| HV Cas | 1040 | 0.2 | 33.5 | 10.6 | 1.5e-13 | 0.3 | 100: | IRC+00 365 | 910 | -0.3 | 28.6 | 11.7 | 1.9e-12 | 0.4 | 500 | |
| RAFGL 190 | 275 | 0 | 30.9 | 13.0 | 1.6e-12 | 0.3 | 180 | RAFGL 2256 | 390 | 0 | 29.5 | 12.0 | 1.9e-12 | 1.0 | 350 | |
| R Scl | 2605 | -0.2 | 33.2 | 13.9 | 1.1e-12 | 1.1 | 90 | K3-17 | 100 | 1 | 34.1 | 11.5 | 1.0e-12 | 0.9 | 90 | |
| IRAS Z02229 | 235 | 0 | 29.1 | 10.1 | 8.3e-12 | 1.7 | 300 | IRC+10 401 | 765 | 0 | 30.0 | 10.0 | 2.0e-12 | 0.3 | 300 | |
| RAFGL 341 | 380 | 0 | 29.8 | 9.4 | 9.4e-13 | 0.4 | 250 | IRAS 19068 | 1165 | -0.7 | 28.5 | 10.1 | 2.0e-13 | 0.4 | 500: | |
| IRC+50 096 | 855 | -0.2 | 28.8 | 9.2 | 1.9e-12 | 0.3 | 500 | NGC 6790 | 290 | 0 | 29.8 | 15.6 | 9.8e-13 | 1.4 | 300 | |
| IRAS 03313 | 325 | 0 | 28.6 | 7.8 | 5.4e-13 | 0.4 | 300 | RAFGL 2392 | 890 | 0 | 27.7 | 8.6 | 3.4e-13 | 0.5 | 500 | |
| U Cam | 1775 | 0 | 31.9 | 11.8 | 3.9e-13 | 0.6 | 150 | NGC 6826 | 150 | 0 | 32.7 | 10.5 | 1.1e-12 | 2.0 | 120 | |
| RAFGL 618 | 235 | -1 | 38.0 | 10.9 | 5.4e-12 | 0.2 | 40a | IRAS 19454 | 140 | 1 | 36.3 | 13.1 | 6.4e-13 | 0.3 | 50 | |
| W Ori | 2450 | 0 | 31.3 | 8.4 | 3.1e-13 | 0.4 | 150 | HD 187885 | 175 | 0 | 29.6 | 10.8 | 5.2e-12 | 1.0 | 200 | |
| IC 418 | 120 | 1 | 30.8 | 11.3 | 5.5e-12 | 0.9 | 180 | RAFGL 2477 | 290 | 0 | 30.7 | 12.5 | 2.3e-12 | 0.6 | 170 | |
| V636 Mon | 1215 | 0 | 29.8 | 10.1 | 1.7e-13 | 0.2 | 250: | IRAS 19584 | 580 | 0 | 28.1 | 7.5 | 8.5e-13 | 1.5 | 400 | |
| RAFGL 940 | 810 | 0 | 28.2 | 10.2 | 3.5e-13 | 0.5 | 500 | IRAS 20000 | 210 | 0 | 29.4 | 12.1 | 2.5e-12 | 1.5 | 300 | |
| IRAS 06582 | 315 | 0 | 29.5 | 10.3 | 1.1e-12 | 0.4 | 300 | V Cyg | 1110 | 0 | 30.5 | 11.5 | 1.3e-12 | 0.3 | 200 | |
| HD 56126 | 170 | 0 | 30.0 | 12.0 | 2.9e-12 | 0.8 | 150 | NGC 7027 | 125 | 1 | 32.8 | 11.0 | 1.7e-11 | 0.4 | 110 | |
| CW Leo | 535 | 0 | 28.6 | 8.8 | 2.7e-10 | 0.6 | 400 | S Cep | 1340 | 0.1 | 31.2 | 9.4 | 4.4e-13 | 0.2 | 130 | |
| NGC 3918 | 90 | 1 | 33.3 | 8.5 | 7.1e-13 | 1.0 | 120 | RAFGL 2688 | 200 | -1 | 31.1 | 10.4 | 5.9e-11 | 0.3 | 70a | |
| RU Vir | 1045 | 0 | 30.4 | 10.1 | 5.3e-13 | 0.6 | 180 | RAFGL 2699 | 540 | 0 | 29.0 | 11.4 | 5.9e-13 | 0.7 | 300 | |
| IRAS 13416 | 115 | 1 | 31.6 | 15.8 | 2.8e-12 | 0.4 | 200a | IC 5117 | 130 | 1 | 31.2 | 9.7 | 7.3e-13 | 0.6 | 150 | |
| II Lup | 625 | 0 | 29.5 | 10.1 | 3.9e-12 | 0.3 | 400 | RAFGL 5625 | 300 | 0 | 30.3 | 11.8 | 4.4e-12 | 0.4 | 200 | |
| V Crb | 1430 | 0 | 30.4 | 10.1 | 1.8e-13 | 0.3 | 150: | IRAS 21489 | 415 | 0 | 29.3 | 9.7 | 1.1e-12 | 0.6 | 350 | |
| K2-16 | 155 | 0.5 | 34.4 | 12.0 | 3.4e-13 | 0.3 | 80 | SAO 34504 | 210 | 0 | 29.1 | 10.3 | 1.3e-11 | 2.0 | 250 | |
| IRAS 16594 | 140 | 1 | 29.8 | 12.1 | 9.9e-12 | 0.9 | 250 | IRAS 22303 | 345 | 0 | 30.3 | 10.5 | 1.0e-12 | 0.7 | 300 | |
| NGC 6369 | 100 | 1 | 34.6 | 10.1 | 9.5e-13 | 1.1 | 90 | IRAS 22574 | 160 | 0 | 31.2 | 13.6 | 5.9e-13 | 0.4 | 150 | |
| IRC+20 326 | 770 | -0.7 | 29.1 | 10.2 | 7.4e-12 | 0.5 | 300 | RAFGL 3068 | 290 | 0 | 32.4 | 14.7 | 8.4e-12 | 0.4 | 120 | |
| CD-49 11554 | 140 | 1 | 30.2 | 14.0 | 4.7e-12 | 0.7 | 200a | RAFGL 3099 | 470 | 0 | 29.5 | 10.9 | 2.6e-12 | 0.7 | 400 | |
| HB 5 | 120 | 0 | 35.5 | 11.5 | 1.0e-12 | 0.4 | 70 | IRAS 23304 | 115 | 1 | 30.1 | 13.4 | 2.3e-12 | 1.1 | 250 | |
| RAFGL 5416 | 290 | 0 | 30.4 | 12.5 | 2.2e-12 | 0.5 | 220 | IRAS 23321 | 175 | 0 | 34.5 | 13.3 | 6.6e-13 | 0.3 | 70 | |
| IRC+40 540 | 485 | 0 | 28.6 | 9.1 | 8.9e-12 | 0.6 | 400 | |||||||||
| non detections | ||||||||||||||||
| R For | 1215 | 0 | - | - | <1e-14 | <0.1 | - | T Lyr | 3305 | 0 | - | - | <1e-14 | <0.1 | - | |
| SS Vir | 2040 | 0 | - | - | <1e-14 | <0.1 | - | S Sct | 2105 | 0 | - | - | <4e-14 | <0.3 | - | |
| Y CVn | 2200 | 0 | - | - | <2e-13 | <0.2 | - | V Aql | 3665 | -0.3 | - | - | <1e-14 | <0.1 | - | |
| RY Dra | 2525 | 0 | - | - | <1e-13 | <0.2 | - | V460 Cyg | 2875 | 0 | - | - | <5e-14 | <0.5 | - | |
| C* 2178 | 1110 | 0 | - | - | <1e-13 | <0.5 | - | PQ Cep | 1625 | 0 | - | - | <1e-14 | <0.1 | - | |
| V1079 Sco | 3085 | -0.5 | - | - | <5e-14 | <0.2 | - | TX Psc | 3105 | 0 | - | - | <3e-14 | <0.1 | - | |
a Temperature determination uncertain due to optically thick MgS emission.
To model the underlying continuum we use a simplified approach. We
represent the continuum with a single temperature modified blackbody,
![\begin{figure}
\par\includegraphics[width=8.8cm,clip]{h3527f05.eps} \end{figure}](/articles/aa/full/2002/29/aah3527/img27.gif) |
Figure 5: Examples of the fitted continuum. We show the spectra (black line), the selected continuum points (diamonds) and the fitted modified blackbody (grey line). |
We have chosen this approach to estimate the continuum over doing a radiative transfer calculation for reasons of simplicity. The bulk of the CS dust around these sources consists of some form of amorphous carbon grains that do not exhibit sharp emission features in the wavelength range of interest. Therefore, a radiative transfer calculation will not yield extra insight into the shape or strength of the continuum while introducing many more modelling parameters. This method has the advantage that we can compare the feature in such a diverse group of sources in a consistent way. Of course Eq. (1) does not directly allow us to incorporate important effects such as optical depth or temperature gradients. However varying the p-parameter can mimic these effects to some extent.
The p-parameter reflects the efficiency with which the dust grains can emit at wavelengths larger than the grain size. Reasonable values of p in the region of interest are between 1 and 2. Crystalline materials have this value close to 2 and amorphous materials have a p-value between 1 and 2, while layered materials have an emissivity index close to 1. A temperature gradient in the dust shell will result in a broader spectral energy distribution (SED). This is mimicked by a lower value of p. Likewise an optically thick dust shell will result in a broader SED, which again can be reproduced by reducing the value of p.
We use a
![]() fitting procedure to determine the values of Tand p fitted to selected continuum points in the ranges 2-22
fitting procedure to determine the values of Tand p fitted to selected continuum points in the ranges 2-22 ![]() m. If available we also use the LWS spectra to verify the
continuum at the long wavelength end of the "30''
m. If available we also use the LWS spectra to verify the
continuum at the long wavelength end of the "30'' ![]() m feature.
The 50-100
m feature.
The 50-100 ![]() m continuum gives an even stronger
constraint on the value of p. For most cases the resultant
continuum runs through the 45
m continuum gives an even stronger
constraint on the value of p. For most cases the resultant
continuum runs through the 45 ![]() m region of the SWS spectrum. A
remarkable exception to this is the spectrum of RAFGL 3068. The
2-24
m region of the SWS spectrum. A
remarkable exception to this is the spectrum of RAFGL 3068. The
2-24 ![]() m spectrum is well fitted with a single 290 K Planck function.
However we find a large excess of this continuum at 45
m spectrum is well fitted with a single 290 K Planck function.
However we find a large excess of this continuum at 45 ![]() m and the
available LWS spectrum is not well represented in level or slope.
Possibly this is due to the optically thick dust shell or a biaxial
dust/temperature distribution.
m and the
available LWS spectrum is not well represented in level or slope.
Possibly this is due to the optically thick dust shell or a biaxial
dust/temperature distribution.
![\begin{figure}
\par\includegraphics[width=8.8cm,clip]{h3527f06.eps} \end{figure}](/articles/aa/full/2002/29/aah3527/img29.gif) |
Figure 6:
Centroid of the "30'' |
The values for T and p are listed in Table 2. One remarkable fact is that the C-stars are well fitted by a single temperature Planck function over the complete wavelength range of SWS. The IR SEDs of the post-AGBs and PNe are in general less broad and many sources are better fitted with a p-value of 1. We stress however that the derived p values cannot be used to constrain the crystal structure or the average size of the dust grains in view of the aforementioned effects of temperature gradients and optical depth.
We first try to remove the effect of temperature by dividing by the continuum; a method that is commonly applied. Using the modelled continua as described in Sect. 3, we convert the observed features to relative excess emission by dividing by the continuum and subtracting 1.
If the feature emission is optically thin and the temperature of the
carriers of the feature is equal to the continuum temperature the
derived excess emissions are proportional to the absorptivity
(
![]() )
of the carrier and if the carrier is the same
in these sources then the derived band shape should be the same for
all sources. However, we find large variations in the derived
profiles. In Fig. 7, we show some examples of the
derived profiles. Most notable are variations in peak position and the
appearance around 26
)
of the carrier and if the carrier is the same
in these sources then the derived band shape should be the same for
all sources. However, we find large variations in the derived
profiles. In Fig. 7, we show some examples of the
derived profiles. Most notable are variations in peak position and the
appearance around 26 ![]() m. Such changes, albeit within a smaller
range of feature peak positions have led other authors
(Volk et al. 2000,2002) to conclude that the "30''
m. Such changes, albeit within a smaller
range of feature peak positions have led other authors
(Volk et al. 2000,2002) to conclude that the "30'' ![]() m feature is composed of two features and the observed variations
are due to varying relative contributions of these two components. One
key question is: "What possible causes could there be for the
observed large variations in band shape?''. We discuss three
possibilities below. First, optical depth effects. Second, temperature
effects. Finally, we discuss multiple band carriers.
m feature is composed of two features and the observed variations
are due to varying relative contributions of these two components. One
key question is: "What possible causes could there be for the
observed large variations in band shape?''. We discuss three
possibilities below. First, optical depth effects. Second, temperature
effects. Finally, we discuss multiple band carriers.
The optically thin assumption most likely holds because the optical
depth in the circumstellar shell strongly decreases towards longer
wavelengths. Note, in this respect that the "30'' ![]() m feature is
never found in absorption (however, see also
Sect. 6.2). Hence, optical depth effects are not
responsible for the observed profile variations.
m feature is
never found in absorption (however, see also
Sect. 6.2). Hence, optical depth effects are not
responsible for the observed profile variations.
Whether the temperature of the amorphous carbon grains (defining the
shape of the continuum) and the temperature of the "30'' ![]() m
carrier are equal is very uncertain. The temperature of a dust grain
in a circumstellar envelope is determined by the distance to the star,
the absorption properties in the wavelength range where the star or
the dust shell emits light and the grain size. In case the temperature
of the grains species responsible for the continuum and the "30''
m
carrier are equal is very uncertain. The temperature of a dust grain
in a circumstellar envelope is determined by the distance to the star,
the absorption properties in the wavelength range where the star or
the dust shell emits light and the grain size. In case the temperature
of the grains species responsible for the continuum and the "30''
![]() m emission feature are not the same, the resulting excess
profiles will also not be the same from source to source even if
the carrier of the band is the same. The differences will be very
pronounced when the emission feature is broad. In this case systematic
difference between sources are bound to occur in league with the
strongly changing continuum temperature. Thus, the temperature of the
carrier of the "30''
m emission feature are not the same, the resulting excess
profiles will also not be the same from source to source even if
the carrier of the band is the same. The differences will be very
pronounced when the emission feature is broad. In this case systematic
difference between sources are bound to occur in league with the
strongly changing continuum temperature. Thus, the temperature of the
carrier of the "30'' ![]() m feature is an important parameter that
determines the profile of the emission.
m feature is an important parameter that
determines the profile of the emission.
There may be multiple carriers involved as discussed before. In this
case the feature near 26 ![]() m dominates in the warmest objects while
the cooler objects are more and more dominated by emission towards 35
m dominates in the warmest objects while
the cooler objects are more and more dominated by emission towards 35
![]() m. However, this scenario has its difficulties since it would
require changes in the composition of the dust in the relatively
dispersed and cold nebular surroundings of a post-AGB object or even
during the PN phase. Such chemical changes can only occur extremely
slowly, if at all.
m. However, this scenario has its difficulties since it would
require changes in the composition of the dust in the relatively
dispersed and cold nebular surroundings of a post-AGB object or even
during the PN phase. Such chemical changes can only occur extremely
slowly, if at all.
Lastly, variations in grain shape or variations in shape distribution can influence the emission profiles. The optical properties of materials with a high value of the refractive index are sensitive to the grain shape. Variations in the shape distribution will lead to variations in the profiles.
In our analysis, we will focus on explaining the profile variations with temperature variations and the effects of variations in the shape distribution of the emitting dust grains.
As explained above we cannot derive a priori information on the
temperature of the "30'' ![]() m carrier from the observations. Our
knowledge is further limited by the fact that even for some of the
candidate materials like MgS or FeS the optical properties are
measured only in a limited wavelength range. We lack measurements in
the UV, optical and near-IR range, which may well dominate the dust
heating. We have decided to test the MgS identification, leaving the
grain temperature as a free parameter. We adopt the method we describe
below.
m carrier from the observations. Our
knowledge is further limited by the fact that even for some of the
candidate materials like MgS or FeS the optical properties are
measured only in a limited wavelength range. We lack measurements in
the UV, optical and near-IR range, which may well dominate the dust
heating. We have decided to test the MgS identification, leaving the
grain temperature as a free parameter. We adopt the method we describe
below.
We use this temperature estimate and the observed band strength in the continuum subtracted spectra to synthesise a MgS feature in order to compare with the astronomical spectra. In conclusion, we adopt MgS with a CDE shape distribution and allow both the strength and the temperature of the MgS grains to vary with respect to the underlying continuum.
In Fig. 10 we show a few typical examples of how
our model results compare to the observed spectra. In
Fig. .1 we show the observed spectra, the composite of the
continuum and the synthetic MgS feature and the residuals after
subtracting the MgS feature for the complete sample. The fits are very
satisfactory in 50 out of 63 cases. In ![]() 25 sources the synthetic
spectra obtained with this very simple model are able to explain the
detailed profile of the "30''
25 sources the synthetic
spectra obtained with this very simple model are able to explain the
detailed profile of the "30'' ![]() m feature very well. The onset and
range of the feature and even the slight depression between 26-30
m feature very well. The onset and
range of the feature and even the slight depression between 26-30 ![]() m are reproduced by the model. We show a zoomed view of the 30
m are reproduced by the model. We show a zoomed view of the 30 ![]() m region of a few sources that are very well fitted by this
simple model in Fig. 11. Notice the different
apparent shapes of the feature that the model is able to explain.
Volk et al. (2002) discuss the "30''
m region of a few sources that are very well fitted by this
simple model in Fig. 11. Notice the different
apparent shapes of the feature that the model is able to explain.
Volk et al. (2002) discuss the "30'' ![]() m feature in IRAS 23304 and
find that they need 2 separate unidentified components in order to
understand the shape of the feature. Figure 11
illustrates that this is not necessarily required.
m feature in IRAS 23304 and
find that they need 2 separate unidentified components in order to
understand the shape of the feature. Figure 11
illustrates that this is not necessarily required.
Examining the complete sample of observed "30'' ![]() m features and
the synthetic spectra, we find there are some systematic deviations.
In the sample of C-stars and post-AGB objects there are numerous
examples where the major part of the "30''
m features and
the synthetic spectra, we find there are some systematic deviations.
In the sample of C-stars and post-AGB objects there are numerous
examples where the major part of the "30'' ![]() m feature is
explained well by our model, but the observed spectra show excess
emission in the 26
m feature is
explained well by our model, but the observed spectra show excess
emission in the 26 ![]() m region. The excess is not accounted for using
our CDE fits. The most extreme case is IRAS 19584 but several sources
exhibit the same behaviour. In Sect. 6.1, we
discuss the origin of this discrepancy.
m region. The excess is not accounted for using
our CDE fits. The most extreme case is IRAS 19584 but several sources
exhibit the same behaviour. In Sect. 6.1, we
discuss the origin of this discrepancy.
In some cases the synthetic spectra over-predict the flux at the
longest wavelengths. This can be due to the very simplistic method we
have used to estimate the continuum level. As the dust optical depth
decreases with increasing wavelengths, the continuum level estimated
from shorter wavelengths might over-predict the true continuum level.
Note, however, that the discrepancies between the modelled and the
observed spectra in the 26 ![]() m region and the 40
m region and the 40 ![]() m region
cannot be considered completely independently. If we were to weaken
the strength of the MgS feature this would yield a better fit around
45
m region
cannot be considered completely independently. If we were to weaken
the strength of the MgS feature this would yield a better fit around
45 ![]() m but would increase the discrepancy around 26
m but would increase the discrepancy around 26 ![]() m. We
also note that MgS produces a weak continuum contribution at 45
m. We
also note that MgS produces a weak continuum contribution at 45 ![]() m
(see for example Fig. 9). This continuum contribution
is already taken into account when fitting the overall continuum, but
it is still present in the calculated MgS contribution. Therefore, our
model may slightly over-predict the fluxes near 45
m
(see for example Fig. 9). This continuum contribution
is already taken into account when fitting the overall continuum, but
it is still present in the calculated MgS contribution. Therefore, our
model may slightly over-predict the fluxes near 45 ![]() m.
m.
As a class, the spectra of most PNe show another systematic
difference. The peak position of the "30'' ![]() m feature lies in
general at longer wavelengths than in the post-AGB sources. This is in
accordance with the picture of a slowly expanding and cooling dusty
envelope. We can simulate the same shift in peak position using MgS
grains. However the fits we obtain fail to reproduce the relatively
narrow width of the observed profile. We discuss this deviation of the
profiles in Sect. 6.3.
m feature lies in
general at longer wavelengths than in the post-AGB sources. This is in
accordance with the picture of a slowly expanding and cooling dusty
envelope. We can simulate the same shift in peak position using MgS
grains. However the fits we obtain fail to reproduce the relatively
narrow width of the observed profile. We discuss this deviation of the
profiles in Sect. 6.3.
There are 4 sources in the sample that have a broader "30'' ![]() m
feature than can be fit by our simple model. Of these sources,
IRAS 13416 and CD-49 11554 show a slightly flattened and broadened
feature while in the cases of RAFGL 618 and RAFGL 2688 the feature is
very broad with a depression around 30
m
feature than can be fit by our simple model. Of these sources,
IRAS 13416 and CD-49 11554 show a slightly flattened and broadened
feature while in the cases of RAFGL 618 and RAFGL 2688 the feature is
very broad with a depression around 30 ![]() m. The latter sources are
known to have a very large dust column along the line of sight. Most
likely the feature shape is due to optical depth effects. We discuss
these sources further in Sect. 6.2.
m. The latter sources are
known to have a very large dust column along the line of sight. Most
likely the feature shape is due to optical depth effects. We discuss
these sources further in Sect. 6.2.
Despite these systematic deviations it is clear that our simple model
is able to explain the profile of the "30'' ![]() m feature in good
detail in a very wide range of objects. We conclude that the carrier
of the "30''
m feature in good
detail in a very wide range of objects. We conclude that the carrier
of the "30'' ![]() m feature in the C-stars and post-AGB objects is
solidly identified with MgS and that the variations in peak
position reflect differences in grain temperature.
m feature in the C-stars and post-AGB objects is
solidly identified with MgS and that the variations in peak
position reflect differences in grain temperature.
![\begin{figure}
\par\includegraphics[width=8.8cm,clip]{h3527f11.eps} \end{figure}](/articles/aa/full/2002/29/aah3527/img34.gif) |
Figure 11:
Examples of spectra that are very well fitted with MgS in a
single temperature, CDE shape distribution. The black lines
represent the data and the grey line the model. The different
sources have been offset for clarity. The excess around 23 |
![\begin{figure}
\par\includegraphics[width=8.8cm,clip]{h3527f12.eps} \end{figure}](/articles/aa/full/2002/29/aah3527/img35.gif) |
Figure 12:
Some examples of sources with a 26 |
![\begin{figure}
\par\includegraphics[width=8.8cm,clip]{h3527f13.eps} \par\end{figure}](/articles/aa/full/2002/29/aah3527/img46.gif) |
Figure 13:
The effects of optical depth of the profile of the MgS
emission. We show the absorbed MgS emission following
Eqs. (2) and (3)
(grey dashed and solid lines), the profile of the "30'' |
In Fig. 8, we compare the shape of the "30''
![]() m profile of NGC 7027 with the profiles due to differently shaped
MgS grains. As can be seen an oblate MgS grain with an axes ratio of
10:10:1 exhibits a "30''
m profile of NGC 7027 with the profiles due to differently shaped
MgS grains. As can be seen an oblate MgS grain with an axes ratio of
10:10:1 exhibits a "30'' ![]() m feature which peaks at the right
position. At present we don't know of a physical reason for a
preferred oblate grain shape in PNe, and a broader CDE shape
distribution in the C-stars and post-AGB objects (see also
Sect. 8.4).
m feature which peaks at the right
position. At present we don't know of a physical reason for a
preferred oblate grain shape in PNe, and a broader CDE shape
distribution in the C-stars and post-AGB objects (see also
Sect. 8.4).
The shape of a resonance is also influenced by the presence of a
coating. MgS is very hygroscopic. Under conditions where oxygen is
available in the gas phase MgS can be oxidised and transformed into
MgO (Nuth et al. 1985; Begemann et al. 1994). It is possible
that the MgS is transformed as the central star of the PN heats up and
the UV radiation progressively dissociates the CO molecules yielding
gas phase oxygen. This could lead to MgS grains which are coated by a
thin layer of MgO. We have modelled such grains using the
electrostatic approximation following
Bohren & Huffman (1983, Chap. 5). The result is shown in
Fig. 14, curve 6. As can be seen the "30'' ![]() m
resonance is split into two features due to the MgO coating. The
feature at the red wavelength is shifted to longer wavelengths
compared to the pure MgS resonance. However the main feature is on the
blue side of 25
m
resonance is split into two features due to the MgO coating. The
feature at the red wavelength is shifted to longer wavelengths
compared to the pure MgS resonance. However the main feature is on the
blue side of 25 ![]() m towards the strong resonance at 18
m towards the strong resonance at 18 ![]() m in
the pure MgO material, in clear contrast with the observations.
m in
the pure MgO material, in clear contrast with the observations.
We explore other possible coatings on MgS grains to test their ability
to explain the narrow feature observed in the PNe and the lack of
emission at 26 ![]() m. We find that of the composite grains we tested
none give a satisfactory explanation. Mixtures of MgS and FeS have
been discussed in the literature to investigate the nature of the
"30''
m. We find that of the composite grains we tested
none give a satisfactory explanation. Mixtures of MgS and FeS have
been discussed in the literature to investigate the nature of the
"30'' ![]() m feature (Begemann et al. 1994; Men'shchikov et al. 2001; Henning 2000). Curves 1 and 2 in Fig. 14 show
the result of embedding an FeS core in a mantle of MgS and embedding a
MgS core in a mantle of FeS, respectively. The latter compares most
favourably with the position of the feature in the PNe. However, the
substructure found in the spectrum of the composite grain around
33-37
m feature (Begemann et al. 1994; Men'shchikov et al. 2001; Henning 2000). Curves 1 and 2 in Fig. 14 show
the result of embedding an FeS core in a mantle of MgS and embedding a
MgS core in a mantle of FeS, respectively. The latter compares most
favourably with the position of the feature in the PNe. However, the
substructure found in the spectrum of the composite grain around
33-37 ![]() m is not found in the PNe spectra.
m is not found in the PNe spectra.
Szczerba et al. (1999) examine grains of amorphous carbon with a
mantle of MgS to compare with the 30 ![]() m feature in two post-AGB
objects. We show simulated spectra of such grains and MgS grains
coated with amorphous carbon in Fig. 14, curves 3 and
4 respectively. Curve 3 clearly does not match the observed feature in
the PNe. As can been seen in curve 4 the MgS grains coated with
amorphous carbon absorb less at 26
m feature in two post-AGB
objects. We show simulated spectra of such grains and MgS grains
coated with amorphous carbon in Fig. 14, curves 3 and
4 respectively. Curve 3 clearly does not match the observed feature in
the PNe. As can been seen in curve 4 the MgS grains coated with
amorphous carbon absorb less at 26 ![]() m than pure MgS and are
therefore a better spectral match to the "30''
m than pure MgS and are
therefore a better spectral match to the "30'' ![]() m feature of the
PNe. However, the feature to continuum ratio in these grains is about
a factor 2.5 lower than in the pure MgS grains requiring a factor 2.5
more mass in the MgS component in order to explain the observed band
strength. Note also that such grains will still produce a weak feature
at 26 while in some PNe spectra we find no excess at that wavelength
at all.
m feature of the
PNe. However, the feature to continuum ratio in these grains is about
a factor 2.5 lower than in the pure MgS grains requiring a factor 2.5
more mass in the MgS component in order to explain the observed band
strength. Note also that such grains will still produce a weak feature
at 26 while in some PNe spectra we find no excess at that wavelength
at all.
Lastly, in curve 5 (Fig. 14) we show the effect of water ice on the MgS grains. The effects on the optical properties of a water ice coating are marginal and the profile cannot explain the PNe observations. We conclude that of the composite materials we have experimented with MgS grains coated with amorphous carbon give the best spectral match. However we find no composite grains that match satisfactorily.
We stress that although our model does not reproduce the "30'' ![]() m
profile in the PNe in its width it is safe to assume that its
carrier is MgS based. These PNe are believed to be the evolutionary
descendants of the sources which exhibit the MgS feature. The shift
in peak position compared to the post-AGB objects follows naturally
from an expanding and cooling shell. Also, the feature strength for
the PNe is similar to these found in the post-AGBs further
strengthening the physical link between the MgS in the C-stars and the
post-AGBs on one hand and the "30''
m
profile in the PNe in its width it is safe to assume that its
carrier is MgS based. These PNe are believed to be the evolutionary
descendants of the sources which exhibit the MgS feature. The shift
in peak position compared to the post-AGB objects follows naturally
from an expanding and cooling shell. Also, the feature strength for
the PNe is similar to these found in the post-AGBs further
strengthening the physical link between the MgS in the C-stars and the
post-AGBs on one hand and the "30'' ![]() m feature in the PNe on the
other (see also Sect. 7).
m feature in the PNe on the
other (see also Sect. 7).
![\begin{figure}
\par\includegraphics[width=8.5cm,clip]{h3527f15.eps} \end{figure}](/articles/aa/full/2002/29/aah3527/img48.gif) |
Figure 15:
"30'' |
![\begin{figure}
\par\includegraphics[width=8.8cm,clip]{h3527f16.eps} \end{figure}](/articles/aa/full/2002/29/aah3527/img49.gif) |
Figure 16:
The centroid position of the "30'' |
First, we show in Fig. 15a the relation between
the
![]() and the ratio of the integrated flux
in the "30''
and the ratio of the integrated flux
in the "30'' ![]() m feature to the total flux in the SWS spectrum
(I30/
m feature to the total flux in the SWS spectrum
(I30/
![]() ). The C-stars demonstrate a clear increase
of I30/
). The C-stars demonstrate a clear increase
of I30/
![]() with decreasing continuum temperature.
The post-AGB objects emit systematically a larger fraction, of up to
25 per cent, in their "30''
with decreasing continuum temperature.
The post-AGB objects emit systematically a larger fraction, of up to
25 per cent, in their "30'' ![]() m feature. The PNe emit a similar
fraction in the "30''
m feature. The PNe emit a similar
fraction in the "30'' ![]() m feature as the post-AGB objects although
with a larger scatter. Notice that the sample contains a number of PNe
with warm dust indicative of young PNe. There are a few sources which
do not follow the general trend. The C-stars, R Scl, IRAS 19584 and
RAFGL 2256, exhibit an atypically strong "30''
m feature as the post-AGB objects although
with a larger scatter. Notice that the sample contains a number of PNe
with warm dust indicative of young PNe. There are a few sources which
do not follow the general trend. The C-stars, R Scl, IRAS 19584 and
RAFGL 2256, exhibit an atypically strong "30'' ![]() m feature. These
latter two sources are further typified by very weak molecular
absorptions near 14
m feature. These
latter two sources are further typified by very weak molecular
absorptions near 14 ![]() m (see also Fig. 3). These
observed anomalies are indicative of deviating conditions in the
outflows of these sources, possibly a recently halted period of
efficient dust formation. The post-AGB object IRAS 19454 has a very
weak and cold "30''
m (see also Fig. 3). These
observed anomalies are indicative of deviating conditions in the
outflows of these sources, possibly a recently halted period of
efficient dust formation. The post-AGB object IRAS 19454 has a very
weak and cold "30'' ![]() m feature. RAFGL 618 has a weak feature due
to self-absorption (see Sect. 6.2).
m feature. RAFGL 618 has a weak feature due
to self-absorption (see Sect. 6.2).
The increasing strength of the "30'' ![]() m feature in the AGB stars
in not surprising. Since the emission is optically thin I30 is
proportional to the amount of MgS. The low values of
m feature in the AGB stars
in not surprising. Since the emission is optically thin I30 is
proportional to the amount of MgS. The low values of
![]() for the warmest C-stars reflects the fact
that there is little dust around these sources and most of the IR
radiation comes from the stellar photosphere. Cooler C-stars have more
dust and thus more MgS. The difference between the coolest C-stars and
the post-AGBs is more surprising. The fact that post-AGBs emit a
larger fraction in the "30''
for the warmest C-stars reflects the fact
that there is little dust around these sources and most of the IR
radiation comes from the stellar photosphere. Cooler C-stars have more
dust and thus more MgS. The difference between the coolest C-stars and
the post-AGBs is more surprising. The fact that post-AGBs emit a
larger fraction in the "30'' ![]() m feature is due to two effects.
First since the dust shell becomes optically thin in the visible some
fraction of the light is emitted at shorter wavelengths. Second, the
temperature of the MgS decreases less rapidly than the temperature of
the other dust components (see below).
m feature is due to two effects.
First since the dust shell becomes optically thin in the visible some
fraction of the light is emitted at shorter wavelengths. Second, the
temperature of the MgS decreases less rapidly than the temperature of
the other dust components (see below).
It is clear that any dust component which produces 30 per cent of the
IR light has to be abundant. In order to quantify the (relative)
amounts of MgS present in the CS shells of these objects will require
radiative transfer modelling which is beyond the scope of this paper.
We can however in first approximation study the relative amounts of
MgS compared to the other cold dust components by studying the peak to
continuum ratio (P/C). In Fig. 15b, we show the
P/C versus the
![]() .
The majority of the
sources lies within the 0.3-1.0 range in P/C. We indicate a few
clear outliers. R Scl, IRAS 19584 and RAFGL 2256 have a very strong
"30''
.
The majority of the
sources lies within the 0.3-1.0 range in P/C. We indicate a few
clear outliers. R Scl, IRAS 19584 and RAFGL 2256 have a very strong
"30'' ![]() m feature indicating again that these sources have "too
much'' MgS for a normal C-star. The PNe NGC 6790 and NGC 6826 have an
exceptionally strong MgS feature. Note that NGC 6790 also has a very
warm continuum, much like a post-AGB source or a very young PN. The
strong SiC band at 11
m feature indicating again that these sources have "too
much'' MgS for a normal C-star. The PNe NGC 6790 and NGC 6826 have an
exceptionally strong MgS feature. Note that NGC 6790 also has a very
warm continuum, much like a post-AGB source or a very young PN. The
strong SiC band at 11 ![]() m is consistent with this. We also show
the averages for each of the classes of sources. The average P/C for
C-stars is 0.5, for post-AGB objects 1.0 and for the PNe it is 0.9.
The similar ratios for the post-AGB objects and the PNe suggests that
the carrier of the "30''
m is consistent with this. We also show
the averages for each of the classes of sources. The average P/C for
C-stars is 0.5, for post-AGB objects 1.0 and for the PNe it is 0.9.
The similar ratios for the post-AGB objects and the PNe suggests that
the carrier of the "30'' ![]() m feature in the PNe is indeed directly
related to the MgS feature in the post-AGBs. Furthermore, the similar
ranges found for the post-AGB objects and the PNe argues against any
process which results in a destruction of the MgS grains during the PN
phase.
m feature in the PNe is indeed directly
related to the MgS feature in the post-AGBs. Furthermore, the similar
ranges found for the post-AGB objects and the PNe argues against any
process which results in a destruction of the MgS grains during the PN
phase.
In Fig. 16, we show the derived MgS temperature
versus the centroid position of the "30'' ![]() m feature. The two are
well correlated. For convenience, we have fitted a power-law function
(without physical meaning) to the relation.
m feature. The two are
well correlated. For convenience, we have fitted a power-law function
(without physical meaning) to the relation.
![\begin{figure}
\par\includegraphics[width=8.8cm,clip]{h3527f17.eps} \end{figure}](/articles/aa/full/2002/29/aah3527/img54.gif) |
Figure 17:
The derived MgS temperature versus the continuum
temperature. The symbols are the same as in
Fig. 1. We show in the box in the lower right
the continuum temperature of the sources without a "30'' |
Recently Grishko et al. (2001) proposed HAC as the carrier of
the mid-IR emission features in C-stars, post-AGBs and PNe. HAC is a
very plausible dust component in those environments
(e.g. Duley & Williams 1981; Goebel 1987; Borghesi et al. 1987; Henning & Schnaiter 1999). However, the mid and
far-IR optical properties of HAC are dominated by a
![]() continuum (Bussoletti et al. 1987). Grishko et al. (2001)
identified some 13 weak spectral features in the range from 19-120
continuum (Bussoletti et al. 1987). Grishko et al. (2001)
identified some 13 weak spectral features in the range from 19-120
![]() m. The strongest of which occur at 21, 27 and 57
m. The strongest of which occur at 21, 27 and 57 ![]() m. We
consider HAC a unlikely candidate for the circumstellar "30''
m. We
consider HAC a unlikely candidate for the circumstellar "30'' ![]() m
emission feature because the laboratory features are weak in contrast
to the astronomical data and because the far-IR features of HAC are
not observed in the astronomical spectra.
m
emission feature because the laboratory features are weak in contrast
to the astronomical data and because the far-IR features of HAC are
not observed in the astronomical spectra.
We use a single temperature for the MgS to model its contribution. In
the very extended envelope of a C-star or in the nebulous environments
in the post-AGBs and PNe, the temperature of any dust component will
not be constant but decreases as a function of the distance to the
star. The fact that we still get good results using a single
temperature is a clear indication that the emission is optically thin
and that the density of the MgS falls off sharply with distance. In
an optically thin environment we know that
![]() ,
where R is the distance to the star.
If the density distribution drops with distance as R-2 or
steeper, the contributions are weighted to the highest temperature
part of the envelope where
,
where R is the distance to the star.
If the density distribution drops with distance as R-2 or
steeper, the contributions are weighted to the highest temperature
part of the envelope where
![]() and thus the source
function is highest. If the density distribution is flatter there is
relatively more dust far away than close by. In this case we will
observe MgS with a range of temperatures. Also sources that are not
optically thin will emit a feature broader than our single temperature
MgS model (see also Sect. 6.2). We conclude that
in the majority of the sources the "30''
and thus the source
function is highest. If the density distribution is flatter there is
relatively more dust far away than close by. In this case we will
observe MgS with a range of temperatures. Also sources that are not
optically thin will emit a feature broader than our single temperature
MgS model (see also Sect. 6.2). We conclude that
in the majority of the sources the "30'' ![]() m emission is due to
optically thin emission which is dominated by the highest temperature
MgS closest to the star.
m emission is due to
optically thin emission which is dominated by the highest temperature
MgS closest to the star.
We find evidence for differences in the shape distributions between
sources. We have tested for correlations between the strength of the
26 ![]() m excess (due to spherical MgS grain) and the CDE component
and other parameters like the mass-loss rate, the P/C, the continuum
temperature or the feature temperature. We find no clear correlations.
We do however note that we find little evidence for the 26
m excess (due to spherical MgS grain) and the CDE component
and other parameters like the mass-loss rate, the P/C, the continuum
temperature or the feature temperature. We find no clear correlations.
We do however note that we find little evidence for the 26 ![]() m
excess in the hottest C-stars. Stars in our sample with a continuum
temperature above 1000 K do not exhibit the excess. Below 1000 K we
find both sources with and without the 26
m
excess in the hottest C-stars. Stars in our sample with a continuum
temperature above 1000 K do not exhibit the excess. Below 1000 K we
find both sources with and without the 26 ![]() m excess. Note also
that the occurrence rate of the 26
m excess. Note also
that the occurrence rate of the 26 ![]() m excess in the sample of
post-AGB objects is high. Because the emission in the post-AGB phase
may be dominated by the dust closest to the star and hence lost at the
tip of the AGB during a phase of heavy mass loss (at a rate much
higher than during the general AGB phase), this might suggest that the
shape distribution of the grains changes to become more spherical
towards the end of the AGB, possibly as a function of mass-loss rate.
m excess in the sample of
post-AGB objects is high. Because the emission in the post-AGB phase
may be dominated by the dust closest to the star and hence lost at the
tip of the AGB during a phase of heavy mass loss (at a rate much
higher than during the general AGB phase), this might suggest that the
shape distribution of the grains changes to become more spherical
towards the end of the AGB, possibly as a function of mass-loss rate.
There are several observational properties that are important when
considering explanations for the observed discrepancies. First, there
is the similar values of P/C in the sample of post-AGBs and PNe
(Fig. 15b). This indicates that the carriers are
related and similar in abundance. Second, the smooth trend we find in
the centroid position of the "30'' ![]() m feature with the [25]-[60]
colour (Fig. 6). The PNe profiles follow the general
trend. This indicates that the main effect for the peak shift
also in the PNe is due to temperature. We also note that there
are three non-PNe sources in our sample with cold MgS (R Scl,
IRAS 19454 and IRAS 23321). These sources are well fitted by our
model. This indicates that the narrow profiles are particular to
the PN environment.
m feature with the [25]-[60]
colour (Fig. 6). The PNe profiles follow the general
trend. This indicates that the main effect for the peak shift
also in the PNe is due to temperature. We also note that there
are three non-PNe sources in our sample with cold MgS (R Scl,
IRAS 19454 and IRAS 23321). These sources are well fitted by our
model. This indicates that the narrow profiles are particular to
the PN environment.
We have explored possible MgS based heterogeneous grains and variations in MgS grain shape. The heterogeneous grains we have explored do not compare satisfactorily with the observed profile in the PNe. MgS grains coated with a layer of amorphous carbon provide a somewhat better match in terms of the band shape however the contrast of the feature with respect to the continuum is strongly reduced. The reduced band strength is in contradiction with the observed peak over continuum ratios.
We find that the emission from plate-like MgS grains appears similar
to the feature found in the PNe. In Sect. 6.1 we
consider an extra contribution of spherical MgS grain to the "30''
![]() m feature at 26
m feature at 26 ![]() m. The varying strength of this contribution
demonstrates that there are variations in the grains shape
distribution between sources. The question is: "Is it possible that
the narrow "30''
m. The varying strength of this contribution
demonstrates that there are variations in the grains shape
distribution between sources. The question is: "Is it possible that
the narrow "30'' ![]() m feature in the PNe is carried by flattened
MgS grains?'' This would either imply that the MgS grain shape
distribution in the PNe is heavily skewed to the plate-like grains or
that the oblate grains emit more efficiently.
m feature in the PNe is carried by flattened
MgS grains?'' This would either imply that the MgS grain shape
distribution in the PNe is heavily skewed to the plate-like grains or
that the oblate grains emit more efficiently.
The origin of these variations in the shape distribution are unclear.
They may reflect variations in the formation and destruction of
grains. We do not know of a mechanism that drives towards oblate
grains shapes during the PN-phase or a mechanism that selectively
destroys spherical and prolate grains. Note, that the peak over
continuum value in the PNe is similar to those found in the post-AGB
objects arguing against a destruction of a part of the MgS grains. It
is important to remark that in the CDE distribution only ![]() 20 per
cent of the grains is oblate with an axis ratio of 1:
20 per
cent of the grains is oblate with an axis ratio of 1:
![]() or
more extreme, i.e. with axes ratios of 1:X:Y, where Y is smaller than
or
more extreme, i.e. with axes ratios of 1:X:Y, where Y is smaller than
![]() and X can vary between
and X can vary between ![]() and 1. Such axes
ratios are required in order to shift the peak position to the
wavelength where the "30''
and 1. Such axes
ratios are required in order to shift the peak position to the
wavelength where the "30'' ![]() m feature in the PNe peaks and to
suppress the emission at 26
m feature in the PNe peaks and to
suppress the emission at 26 ![]() m.
m.
Alternatively, these inferred shape variations may result from a shape dependent heating of grains. In the C-stars, likely, heating and cooling occurs at IR wavelengths. Because the grains are small compared to these wavelengths the temperature will be shape independent. However, in the PNe heating occurs through absorption of visible and UV radiation, which scales with the cross-section. Hence in that case dust temperatures will be shape dependent. Indeed flattened grains have on average a larger geometric cross-section compared to their volume that spherical or prolate grains.
As noted before, the PNe in the sample with the warmest dust continuum
are well fitted by our model. The model fails in the PNe sample at MgS
temperatures below ![]() 90 K. Perhaps, the observed discrepancies are
due to changes in the optical properties of pure MgS at low
temperatures. No laboratory measurements of MgS at these temperatures
are published. FeO has the same lattice structure as MgS and
measurements of FeO at different temperatures (10 K, 100 K, 200 K and
300 K) are available (Henning & Mutschke 1997). We have used FeO as
an analogue to examine the effect of temperature. The trend with lower
temperature is for the FeO resonance at 20
90 K. Perhaps, the observed discrepancies are
due to changes in the optical properties of pure MgS at low
temperatures. No laboratory measurements of MgS at these temperatures
are published. FeO has the same lattice structure as MgS and
measurements of FeO at different temperatures (10 K, 100 K, 200 K and
300 K) are available (Henning & Mutschke 1997). We have used FeO as
an analogue to examine the effect of temperature. The trend with lower
temperature is for the FeO resonance at 20 ![]() m to become narrower
and stronger with respect to the continuum. There is a small shift in
the peak position. Comparing the 300 K measurement to 10 K the latter
resonance peaks
m to become narrower
and stronger with respect to the continuum. There is a small shift in
the peak position. Comparing the 300 K measurement to 10 K the latter
resonance peaks ![]() 0.1
0.1 ![]() m more to the blue for spherical
grains. Like MgS, FeO is also very sensitive to the shape of the
grains. Using a CDE shape distribution the resonance of the 10 K
sample lies
m more to the blue for spherical
grains. Like MgS, FeO is also very sensitive to the shape of the
grains. Using a CDE shape distribution the resonance of the 10 K
sample lies ![]() 1
1 ![]() m on the blue side of the 300 K resonance. If
we translate this behaviour to the MgS data and the "30''
m on the blue side of the 300 K resonance. If
we translate this behaviour to the MgS data and the "30'' ![]() m
feature in the PNe it worsens the situation since we would expect a
stronger contribution at shorter wavelengths exactly where our model
already over-predicts. As an alternative, one might speculate that a
change in lattice structure at low temperatures may occur resulting in
different optical properties. It is interesting to note that
Berthold (1964) reports that MgS can condense in two lattice
structures: cubic and hexagonal. This author finds that hexagonal MgS
exhibits a narrower mid-IR resonance than cubic and amorphous MgS.
m
feature in the PNe it worsens the situation since we would expect a
stronger contribution at shorter wavelengths exactly where our model
already over-predicts. As an alternative, one might speculate that a
change in lattice structure at low temperatures may occur resulting in
different optical properties. It is interesting to note that
Berthold (1964) reports that MgS can condense in two lattice
structures: cubic and hexagonal. This author finds that hexagonal MgS
exhibits a narrower mid-IR resonance than cubic and amorphous MgS.
We conclude that, although it is possible to find MgS based candidate
materials that provide a better spectral match to the observed "30''
![]() m feature in the PNe no explanation for the "30''
m feature in the PNe no explanation for the "30'' ![]() m
profiles in the PNe is completely satisfactory at this time.
m
profiles in the PNe is completely satisfactory at this time.
The relatively warm hot MgS that we observe in the post-AGB sample is certainly a phenomenon that deserves further study. As pointed out above, this must be due to a difference in the heating properties of MgS relative to the other dust constituents. We suggest that due to the strong resonance in the mid-IR MgS is (partially) heated by IR radiation. This may cause a temperature difference as observed. It requires measured optical constants for MgS over a much wider wavelength range than now available and radiative transfer modelling to understand the detailed temperature behaviour of the MgS grains.
We have shown in Fig. 17 that the warmest C-stars
that exhibit the "30'' ![]() m feature have cold MgS. We consider two
possible explanations for this behaviour. First, MgS can be cold
because it is unable to absorb the radiation from the central source
efficiently. This would require that the MgS grains are very
transparent in the visible and near-IR where these warm C-stars emit
most of their radiation. In this case a cooler star will emit
more radiation at wavelengths where MgS can absorb and as a result the
MgS grains will be warmer. This explanation is consistent with
our notion that MgS is (partially) heated by IR radiation.
m feature have cold MgS. We consider two
possible explanations for this behaviour. First, MgS can be cold
because it is unable to absorb the radiation from the central source
efficiently. This would require that the MgS grains are very
transparent in the visible and near-IR where these warm C-stars emit
most of their radiation. In this case a cooler star will emit
more radiation at wavelengths where MgS can absorb and as a result the
MgS grains will be warmer. This explanation is consistent with
our notion that MgS is (partially) heated by IR radiation.
A second intriguing possibility is that the MgS around these sources
is located far away from the star. R Scl, U Cam and W Ori are known to
have a detached dust shell (Zuckerman 1993). These shells
are formed during an earlier phase when the mass-loss rate was higher
than the current mass-loss rate (Willems & de Jong 1988). If during
this phase the AGB star was already a C-star, MgS could have condensed
in the outflow and be present in the detached shell. We have sketched
in Fig. 1 the evolution of a star which suffers a
brief period of enhanced mass loss. First, the star becomes redder
during the phase of high mass loss. When the shell becomes detached
the 12 ![]() m flux quickly drops while the inner edge of the dust
shell moves away from the star and the warmest dust is rapidly lost.
The star moves back to the locus of the warmest C-stars but with an
excess of cold dust. The excess of cold dust is observable as a 60
m flux quickly drops while the inner edge of the dust
shell moves away from the star and the warmest dust is rapidly lost.
The star moves back to the locus of the warmest C-stars but with an
excess of cold dust. The excess of cold dust is observable as a 60 ![]() m excess. The sources mentioned above indeed show the 60
m excess. The sources mentioned above indeed show the 60 ![]() m
excess. We note that some stars with 60
m
excess. We note that some stars with 60 ![]() m excess do not show the
"30''
m excess do not show the
"30'' ![]() m feature.
m feature.
To distinguish between these two possibilities requires radiative transfer modelling and a more detailed investigation of these particular sources which is beyond the scope of this paper. The location and temperature of the MgS in the warmest C-stars will be further discussed in a forthcoming paper (Hony et al., in prep.).
The behaviour of the MgS we find in this study has implications for
our understanding of the fate of MgS that is produced during the
C-star phase. Previously, the existence of MgS in the ISM has been
excluded because of the lack of spectral signature at 26 ![]() m. We
have shown that at low dust temperatures no emission signature is
expected at 26
m. We
have shown that at low dust temperatures no emission signature is
expected at 26 ![]() m. For the dust temperatures in the ISM we would
expect a smooth feature at wavelengths longer than 35
m. For the dust temperatures in the ISM we would
expect a smooth feature at wavelengths longer than 35 ![]() m. In this
respect it is interesting to note that the peak to continuum (P/C)
values in the post-AGB and PNe sample are similar. We find no evidence
for a rapid destruction by the UV radiation field in the PN. This
shows that the MgS will indeed be injected into the ISM. Of course, in
the ISM the contrast will be much less because the injected material
will be diluted with other star-dust and general ISM material.
Nevertheless a search for the "30''
m. In this
respect it is interesting to note that the peak to continuum (P/C)
values in the post-AGB and PNe sample are similar. We find no evidence
for a rapid destruction by the UV radiation field in the PN. This
shows that the MgS will indeed be injected into the ISM. Of course, in
the ISM the contrast will be much less because the injected material
will be diluted with other star-dust and general ISM material.
Nevertheless a search for the "30'' ![]() m feature in the ISM may be
very worthwhile. In this respect it is important to note that
Chan et al. (1997) have discussed a broad emission feature
they observed along several lines of sight towards the galactic
centre. The feature they observed is similar to the "30''
m feature in the ISM may be
very worthwhile. In this respect it is important to note that
Chan et al. (1997) have discussed a broad emission feature
they observed along several lines of sight towards the galactic
centre. The feature they observed is similar to the "30'' ![]() m
feature observed in the C-rich post-AGB objects.
m
feature observed in the C-rich post-AGB objects.
We present a simple approach to determine the continuum. We study the
profile of the "30'' ![]() m feature after continuum subtraction. We
find large systematic variations in the appearance of the "30''
m feature after continuum subtraction. We
find large systematic variations in the appearance of the "30''
![]() m feature. We firmly identify the carrier of the feature with MgS
in a CDE shape distribution. The profile of the observed feature is
consistent with MgS provided that the temperature of the MgS can be
different from the bulk of the dust. This approach allows us to model,
in a unified way, the profiles of the "30''
m feature. We firmly identify the carrier of the feature with MgS
in a CDE shape distribution. The profile of the observed feature is
consistent with MgS provided that the temperature of the MgS can be
different from the bulk of the dust. This approach allows us to model,
in a unified way, the profiles of the "30'' ![]() m feature in a wide
range of objects even when the feature can appear extremely different.
m feature in a wide
range of objects even when the feature can appear extremely different.
We find an additional component at 26 ![]() m in
m in ![]() 25 sources. We
argue that this component is due to differences in the distribution
over shapes of the MgS grains; specifically, it requires a
distribution more weighted to spherical MgS grains. We find no clear
correlations of this excess with other properties of the sources. The
self-absorbed "30''
25 sources. We
argue that this component is due to differences in the distribution
over shapes of the MgS grains; specifically, it requires a
distribution more weighted to spherical MgS grains. We find no clear
correlations of this excess with other properties of the sources. The
self-absorbed "30'' ![]() m features of RAFGL 618 and RAFGL 2688
reflect the high optical depth in the "30''
m features of RAFGL 618 and RAFGL 2688
reflect the high optical depth in the "30'' ![]() m feature in these
sources.
m feature in these
sources.
We find that the typical profile of the "30'' ![]() m feature in the
PNe is narrower than predicted by our model. We consider several
possible explanations. We find that flattened MgS grains provide a
better spectral match to the "30''
m feature in the
PNe is narrower than predicted by our model. We consider several
possible explanations. We find that flattened MgS grains provide a
better spectral match to the "30'' ![]() m feature in the PNe. However
it is presently unclear why in the PNe environment the "30''
m feature in the PNe. However
it is presently unclear why in the PNe environment the "30'' ![]() m
feature is dominated by flattened grains.
m
feature is dominated by flattened grains.
We find that the temperature of the MgS grains is different from the bulk of the dust. Therefore, they cannot be in thermal contact with the other dust species but must exist as separate grains. In the C-stars MgS is colder than the other dust while in the post-AGB objects MgS is warmer. Likely, this is because the MgS is efficiently heated by mid-IR radiation which is less important in the C-stars.
The behaviour of the temperature of the MgS for the hottest C-stars is
enigmatic. The hottest sources have very cold MgS grains. We propose
two explanations for this phenomenon. First, the "30'' ![]() m
feature in these sources may be due to a previous mass-loss phase and
the MgS is thus located far from the source and cold. Second, the MgS
grains absorb very inefficiently in the optical and near-IR and
therefore the hottest C-stars do not heat the MgS grains well.
m
feature in these sources may be due to a previous mass-loss phase and
the MgS is thus located far from the source and cold. Second, the MgS
grains absorb very inefficiently in the optical and near-IR and
therefore the hottest C-stars do not heat the MgS grains well.
We examine the feature over continuum ratio to study the relative proportion of MgS to the other dust components. We find no evidence for rapid destruction of MgS grains during the PNe phase and possibly MgS grains may survive to be incorporated into the ISM.
We would like to emphasise the need for further measurements of the optical properties of astrophysically relevant materials at all relevant wavelengths. This study has put forwards some very interesting questions in relation to the absorption properties of MgS in the optical and near-IR and also concerning low temperature effects. Unfortunately, no published laboratory measurements are available to test some of our scenarios and conclusions.
Acknowledgements
SH and LBFMW acknowledge financial support from NWO Pionier grant 616-78-333. This research has made use of the SIMBAD database, operated at CDS, Strasbourg, France. This research has made use of NASA's Astrophysics Data System Bibliographic Services. IA3 is a joint development of the SWS consortium. Contributing institutes are SRON, MPE, KUL and the ESA Astrophysics Division.
![\begin{figure}
\par\includegraphics[width=18cm,clip]{h3527f26.eps} \end{figure}](/articles/aa/full/2002/29/aah3527/img68.gif) |
Figure A.2:
C-stars with a weak or without a ``30'' |
![\begin{figure}
\par\includegraphics[width=8.8cm,clip]{h3527f01.eps} \end{figure}](/articles/aa/full/2002/29/aah3527/img13.gif)
![\begin{figure}
\par\includegraphics[width=8.8cm,clip]{h3527f02.eps} \end{figure}](/articles/aa/full/2002/29/aah3527/img16.gif)
![\begin{figure}
\par\includegraphics[width=17.1cm,clip]{h3527f03.eps} \end{figure}](/articles/aa/full/2002/29/aah3527/img21.gif)
![\begin{figure}
\par\includegraphics[width=17cm,clip]{h3527f04.eps} \end{figure}](/articles/aa/full/2002/29/aah3527/img22.gif)
![\begin{figure}
\par\includegraphics[width=8.8cm]{h3527f07.eps} \end{figure}](/articles/aa/full/2002/29/aah3527/img30.gif)
![\begin{figure}
\par\includegraphics[width=8.8cm]{h3527f08.eps} \end{figure}](/articles/aa/full/2002/29/aah3527/img31.gif)
![\begin{figure}
\par\includegraphics[width=8.8cm]{h3527f09.eps} \end{figure}](/articles/aa/full/2002/29/aah3527/img32.gif)
![\begin{figure}
\par\includegraphics[width=18cm,clip]{h3527f10.eps} \end{figure}](/articles/aa/full/2002/29/aah3527/img33.gif)
![\begin{figure}
\par\includegraphics[width=8.8cm,clip]{h3527f14.eps} \end{figure}](/articles/aa/full/2002/29/aah3527/img47.gif)
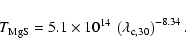
![\begin{figure}
\par\includegraphics[width=17.5cm,clip]{h3527f18.eps} \end{figure}](/articles/aa/full/2002/29/aah3527/img60.gif)
![\begin{figure}
\par\includegraphics[width=18cm,clip]{h3527f19.eps}
\end{figure}](/articles/aa/full/2002/29/aah3527/img61.gif)
![\begin{figure}
\par\includegraphics[width=18cm,clip]{h3527f20.eps}
\end{figure}](/articles/aa/full/2002/29/aah3527/img62.gif)
![\begin{figure}
\par\includegraphics[width=18cm,clip]{h3527f21.eps}
\end{figure}](/articles/aa/full/2002/29/aah3527/img63.gif)
![\begin{figure}
\par\includegraphics[width=18cm,clip]{h3527f22.eps}
\end{figure}](/articles/aa/full/2002/29/aah3527/img64.gif)
![\begin{figure}
\par\includegraphics[width=18cm,clip]{h3527f23.eps}
\end{figure}](/articles/aa/full/2002/29/aah3527/img65.gif)
![\begin{figure}
\par\includegraphics[width=18cm,clip]{h3527f24.eps}
\end{figure}](/articles/aa/full/2002/29/aah3527/img66.gif)
![\begin{figure}
\par\includegraphics[width=18cm,clip]{h3527f25.eps}
\end{figure}](/articles/aa/full/2002/29/aah3527/img67.gif)
![\begin{figure}
\par\includegraphics[width=18cm,clip]{h3527f27.eps}
\end{figure}](/articles/aa/full/2002/29/aah3527/img69.gif)