A&A 389, 931-944 (2002)
DOI: 10.1051/0004-6361:20020682
S. Tubbesing1 - A. Kaufer2 - O. Stahl1 - B. Wolf1 - H. M. Schmid1,3 - A. J. Korn4 - M. Maintz1 - T. Rivinius2 - T. Szeifert2 - T. Arentoft5,![]() - C. Sterken5,
- C. Sterken5,![]()
1 - Landessternwarte Königstuhl, 69117 Heidelberg, Germany
2 - European Southern Observatory, 85748 Garching,
Karl-Schwarzschild-Str. 2, Germany
3 - Institut für Astronomie, ETH Zentrum, 8092 Zürich, Switzerland
4 - Universitäts-Sternwarte München, Scheinerstr. 1, 81679 München,
Germany
5 - Astronomy Group, Vrije Universiteit Brussel, Pleinlaan 2,
1050 Brussels, Belgium
Received 25 March 2002 / Accepted 30 April 2002
Abstract
The eclipsing P Cygni-type star R 81 (HDE 269128, HIP
24080) of spectral type B2.5 Ia-0 in the Large Magellanic Cloud was
studied on the basis of a long continuous time series with
simultaneous high-resolution FEROS spectra and photometric
measurements in the Strömgren system. The stellar parameters
derived for the primary are
![]() K and
K and
![]() .
The orbital period of the binary is 74.566 days. The mean light
curve shows two eclipses, a brightness maximum just after the
eclipse of the hypergiant and a slow decline of brightness between
the two minima. For the first time, the orbital motion of the
primary has been detected. The system is close and eccentric
(e=0.569) and both components nearly fill their Roche volumes. A
spectral signature of the companion of the hypergiant has not been
found. We suspect that the secondary is embedded in a shell or disk
of material accreted from the primary. In addition, line profile
variations with a period of about 11 days, probably caused by
non-radial pulsation, were observed. The line profiles indicate a
strong wind from the primary with an outflow velocity of about 150 km s-1. Near primary eclipse, strong absorptions in low
excitation lines emerge abruptly that point to an outflow of
enhanced density and higher velocity in the direction towards and
beyond the secondary.
.
The orbital period of the binary is 74.566 days. The mean light
curve shows two eclipses, a brightness maximum just after the
eclipse of the hypergiant and a slow decline of brightness between
the two minima. For the first time, the orbital motion of the
primary has been detected. The system is close and eccentric
(e=0.569) and both components nearly fill their Roche volumes. A
spectral signature of the companion of the hypergiant has not been
found. We suspect that the secondary is embedded in a shell or disk
of material accreted from the primary. In addition, line profile
variations with a period of about 11 days, probably caused by
non-radial pulsation, were observed. The line profiles indicate a
strong wind from the primary with an outflow velocity of about 150 km s-1. Near primary eclipse, strong absorptions in low
excitation lines emerge abruptly that point to an outflow of
enhanced density and higher velocity in the direction towards and
beyond the secondary.
Key words: stars: individual: R 81 - stars: binaries: eclipsing - stars: early-type - stars: winds, outflows - stars: supergiants - stars: emission-line, Be
The star R 81 (Feast et al. 1960) is one of the brightest B supergiants in the Large Magellanic Cloud. It is also known as HD 269128 or Hen S86 (Henize 1956). The star has been studied in detail by Wolf et al. (1981) who compared it with the famous galactic hypergiant P Cygni. Unexpectedly large light variations for the spectral type were first found by Appenzeller (1972). In the course of the extended photometric monitoring project (Long-Term Photometry of Variables = LTPV) initiated by Sterken (1983) these variations were found to be periodic. A period of about 74.59 days was found by Stahl et al. (1987) and the star was classified as an eclipsing binary. This makes R 81 one of the very few eclipsing early-type hypergiants known. However, the long period made full phase coverage very difficult and no spectroscopic orbital variations could be found.
The star has been detected by IRAS with a flux density of 2.54 Jy at
60 ![]() m (Beichman et al. 1988). Only lower limits of 0.4 and 0.25 Jy
at 12 and 25
m (Beichman et al. 1988). Only lower limits of 0.4 and 0.25 Jy
at 12 and 25 ![]() m have been found. This indicates the presence of an
extended cool dust shell around the system. This possibly links the
star to the S Dor stars (Luminous Blue Variables, LBVs) - many LBVs
show evidence for associated nebulosities with cool dust
(Hutsemékers 1997). An associated optical nebulosity has not
been detected so far.
m have been found. This indicates the presence of an
extended cool dust shell around the system. This possibly links the
star to the S Dor stars (Luminous Blue Variables, LBVs) - many LBVs
show evidence for associated nebulosities with cool dust
(Hutsemékers 1997). An associated optical nebulosity has not
been detected so far.
van Genderen et al. (1992) discussed the LTPV data and analyzed the scatter around the mean light curve between the eclipses in the phase interval 0.2-0.7. They found significant scatter with a maximum light amplitude of 0.17 mag and a quasi-period of 24.1 days. van Genderen (2001) also found indications that the visual brightness before 1950 was up to one magnitude brighter than at present. Because of this finding and the unusually large amplitude of variability, he suggested a relation of R 81 to the S Dor variables.
In this paper, we shall describe the observational results of an extended spectroscopic and photometric monitoring campaign. A detailed model of the system will be presented in a forthcoming paper (Orosz et al., in preparation).
The main aim of the project was to cover at least one full orbital cycle of about 75 days of R 81 with spectra of high signal-to-noise ratio (S/N), high spectral resolution and well sampled over the whole period. In order to cover also shorter time scales, a sampling of about one spectrum per night was aimed for. Since the star is irregularly variable in light on shorter time scales, simultaneous photometry was also obtained.
Due to the long period, the sampling of the full phase required considerable effort. We used part of the guaranteed observing time at the FEROS instrument for the spectroscopic campaign.
The FEROS instrument (Kaufer et al. 2000) at the ESO
1.52-m telescope has been built by a consortium led by the
Landessternwarte Heidelberg. FEROS is a fiber-coupled echelle
spectrograph which covers the wavelength range from 3700-9200 Å with a spectral resolution of
![]() in one exposure. We obtained 78 spectra of R 81 in the time
interval from October 1998 until January 1999, i.e. a total time span
of 111 days. The exposure time was one hour for most spectra. The S/Nstrongly depends on wavelength and is of the order of 100. Typically
one spectrum per night was obtained. The spectra were reduced with
the FEROS data reduction software running under ESO-Midas
(Stahl et al. 1999). In addition, the continuum has been rectified by
fitting a spline function to selected continuum points and dividing
each spectrum by this function.
in one exposure. We obtained 78 spectra of R 81 in the time
interval from October 1998 until January 1999, i.e. a total time span
of 111 days. The exposure time was one hour for most spectra. The S/Nstrongly depends on wavelength and is of the order of 100. Typically
one spectrum per night was obtained. The spectra were reduced with
the FEROS data reduction software running under ESO-Midas
(Stahl et al. 1999). In addition, the continuum has been rectified by
fitting a spline function to selected continuum points and dividing
each spectrum by this function.
The period and light curve of R 81 have been known quite accurately already before our campaign. However, apart from the periodic orbital variations, the star also shows smaller irregular variations on shorter time scales. Therefore we observed the star also photometrically simultaneously with the spectroscopy.
The simultaneous observations were done with the Danish Strömgren Automatic Telescope (SAT) at ESO, La Silla in the uvby filter system. The SAT is a 50 cm telescope equipped with a spectro-photometer. The observations were transformed to the standard uvby system by the observations of standard stars. For details of the instrument and data reduction see Olsen (1994). 89 measurements in 100 nights (JD 2 451 111-JD 2 451 211) have been obtained. The precision of the observations is between 0.005 and 0.01 mag. The data are summarized in Table 1.
In addition, further by observations have been obtained simultaneously and for about one consecutive orbital cycle at the Dutch 90-cm telescope at La Silla with a CCD detector. These observations have also been transformed to the standard system. The observations cover the dates from JD 2 451 124 to 2 451 239. Details about these data will be published elsewhere.
The photometric results from the SAT telescope, which have been
obtained simultaneously with the spectroscopy, are plotted in
Fig. 1.
![\begin{figure}
\par\includegraphics[width=7cm,clip]{MS2507f01.eps} \end{figure}](/articles/aa/full/2002/27/aa2507/img19.gif) |
Figure 1: Photometric data obtained simultaneous with the spectroscopic monitoring. Note the strong primary eclipses, the strong variations in between the eclipses and the pronounced change in c1. |
| Open with DEXTER | |
The published photoelectric observations of R 81 cover almost 30 years. By combining all these observations with our new data, the period can be determined with high precision. In addition, by averaging the light curve in phase bins, irregular variability can be averaged and a mean light curve of high quality can be constructed. In addition to our new data, we used the photometric data published by Appenzeller (1972), the extended published data set from the LTPV program (Manfroid et al. 1991, 1995; Sterken et al. 1993; Sterken et al. 1995) and the Hipparcos data (Perryman et al. 1997). Most data have been obtained in the Strömgren uvby system and have been transformed to the standard Johnson V band. The data of Appenzeller (1972) have been obtained directly in the Johnson UBV system. The Hipparcos data correspond to a filter which is broader than the Johnson V band. The statistical aspects of the use of Hipparcos data in variability research have been described by van Leeuwen et al. (1997) and in vol. 3 of the Hipparcos catalogue (ESA 1997).
van Leeuwen et al. (1998) derived a period of
![]() days from
the photometric data, including data from Hipparcos, available
to them, slightly shorter than the value of 74.59 days originally
given by Stahl et al. (1987). We used our more extended data set to
further improve the period. Using the phase dispersion minimization
method described by Stellingwerf (1978), we derive an orbital
period which is, within the errors, in agreement with the result of
van Leeuwen et al. (1998).
days from
the photometric data, including data from Hipparcos, available
to them, slightly shorter than the value of 74.59 days originally
given by Stahl et al. (1987). We used our more extended data set to
further improve the period. Using the phase dispersion minimization
method described by Stellingwerf (1978), we derive an orbital
period which is, within the errors, in agreement with the result of
van Leeuwen et al. (1998).
All photometric data folded with this period are plotted in
Fig. 3.
![\begin{figure}
\par\includegraphics[angle=-90,width=8.8cm,clip]{MS2507f02.eps} \end{figure}](/articles/aa/full/2002/27/aa2507/img22.gif) |
Figure 2: Phase plot of the y magnitude in two consecutive cycles. Note the strong cycle-to-cycle variations around phase 0.5. The primary eclipse and the secondary minimum around phase 0.8 are stable. Circles are the SAT data, plus signs are the data obtained at the Dutch 90-cm telescope. |
| Open with DEXTER | |
![\begin{figure}
\par\includegraphics[angle=-90,width=8.8cm,clip]{MS2507f03.eps} \end{figure}](/articles/aa/full/2002/27/aa2507/img24.gif) |
Figure 3:
All available photometric data,
folded with the period of 74.566 days. Phase zero corresponds
to the primary photometric minimum. Symbols are as follows:
|
| Open with DEXTER | |
![\begin{figure}
\par\includegraphics[angle=-90,width=8.8cm,clip]{MS2507f04.eps} \end{figure}](/articles/aa/full/2002/27/aa2507/img25.gif) |
Figure 4: Mean light curve obtained by phase-binning using a period of 74.566 days. |
| Open with DEXTER | |
The c1 colour is strongly variable around eclipse, indicating variations of the Balmer jump or the Balmer continuum. All other colours observed do not show significant variations with phase. The c1 colour variations are clearly correlated with the visual brightness. This is shown in Fig. 5. The c1 index varies with y, but with a different relation during egress and ingress. The colour variations could indicate a temperature difference between primary and secondary or variations in the Balmer continuum absorption in the medium surrounding the binary. A large c1 index indicates a strong Balmer jump in absorption, thus the Balmer jump is more pronounced in primary eclipse. Since a strong absorption in stellar-wind lines appears at the same phase interval as the c1variations (see below), Balmer jump variations, caused by absorption in a gas stream in the system, appear to be the most plausible explanation for the variations in c1.
van Genderen et al. (1992) already discussed the variations around the
mean light curve. They found a period of 24.1 days of the residuals
and an amplitude of ![]() mag. Our new data confirm the presence
of significant variability on time scales shorter than the orbital
period. We find a period of 20.1 days and an amplitude of
mag. Our new data confirm the presence
of significant variability on time scales shorter than the orbital
period. We find a period of 20.1 days and an amplitude of ![]() mag for the variations. The difference in our results as compared with
van Genderen et al. (1992) probably indicates that the short-term
variations of R 81 are not strictly periodic. This is not surprising,
since quasi-periodic small-scale variations, so-called
mag for the variations. The difference in our results as compared with
van Genderen et al. (1992) probably indicates that the short-term
variations of R 81 are not strictly periodic. This is not surprising,
since quasi-periodic small-scale variations, so-called
![]() Cygni variations, are typical for luminous early-type stars.
Cygni variations, are typical for luminous early-type stars.
![\begin{figure}
\par\includegraphics[angle=-90,width=8.8cm,clip]{MS2507f05.eps} \end{figure}](/articles/aa/full/2002/27/aa2507/img28.gif) |
Figure 5: Correlation of the visual magnitude y with the Balmer jump index c1. Crosses denote data between the eclipses, boxes the ingress and circles the egress phase. |
| Open with DEXTER | |
In order to produce a spectrum with very high S/N, a mean spectrum was
computed from all 78 observed spectra. The individual spectra have
been summed with optimal weights computed from their S/N. The mean
spectrum shows the typical signatures of an early-type B supergiant of
high luminosity. It is dominated by strong hydrogen lines of the
Balmer and Paschen series, which show strong P Cyg-type profiles.
Also a number of strong lines of He I, Fe II, Fe
III and Si II show P Cyg profiles. Most of the weaker lines
are in absorption, in some cases with an additional faint emission
component. A few weak lines of Si II, O I, Al II
and Mg II show only a pure emission profile. Some emission
lines are clearly double-peaked, while others show a flat-topped
profile. A few forbidden lines of [N II] and [Ti II] are
also observed in emission and also show a flat-topped profile, similar
to, but fainter than in the hypergiant P Cygni (Stahl et al. 1991). A
few selected line profiles are shown in Fig. 6.
![\begin{figure}
\par\includegraphics[angle=270,width=10cm,clip]{MS2507f06a.eps}\\ [5mm]
\includegraphics[angle=270,width=15.5cm,clip]{MS2507f06b.eps} \end{figure}](/articles/aa/full/2002/27/aa2507/img29.gif) |
Figure 6:
Profiles of selected lines in the mean spectrum plotted on a
common velocity scale. The vertical lines mark the systemic velocity
of 253 km s-1. The sharp absorption lines near
Mg II |
| Open with DEXTER | |
The Na I D lines and the Ca II H and K lines show many
components, most of which are most likely of interstellar origin. For
Ca II H and K, we found a total of 13 components, at
heliocentric radial velocities of 13, 44, 57, 70, 117, 168, 200, 221,
228, 247, 254, 269 and 280 km s-1. The components at velocities
above about 200 km s-1 of the Ca II H line are blended
with H
![]() .
With the exception of the components at 254 and
280 km s-1, the components are seen in both the H and the K
line. The component at 117 km s-1 is also present in some
Fe II lines (cf. Fig. 14) and is therefore
probably of circumstellar origin.
Some other components may be of
circumstellar origin as well.
.
With the exception of the components at 254 and
280 km s-1, the components are seen in both the H and the K
line. The component at 117 km s-1 is also present in some
Fe II lines (cf. Fig. 14) and is therefore
probably of circumstellar origin.
Some other components may be of
circumstellar origin as well.
The flat-topped emission lines are centered at the systemic velocity and indicate outflow velocities of about 150 km s-1. The double-peaked emission lines are also centered close to the systemic velocity with the peaks at approximately +100 and -100 km s-1. In the mean spectrum, no lines could be detected that could be ascribed to the secondary star.
In this section we discuss the orbital variations of various groups of lines.
A number of lines in the spectrum of R 81 do not show any sign of an
emission contribution and therefore are mainly of photospheric origin.
As an example, the Si III ![]() 4567 line is shown in
Fig. 7.
4567 line is shown in
Fig. 7.
![\begin{figure}
\par\includegraphics[angle=0,width=7cm,clip]{MS2507f07.eps} \end{figure}](/articles/aa/full/2002/27/aa2507/img31.gif) |
Figure 7:
Phase diagram of the Si III |
| Open with DEXTER | |
Our spectroscopic observations clearly show, for the first time, radial-velocity variations of R 81 which are clearly related to the orbital motion of the hypergiant. Note, however, that in addition to the clear signature of the orbital variation with the 74.566 day period, these lines also show pronounced variations on shorter time scales. These variations are probably due to pulsations and make the orbit determination uncertain.
The best pure absorption lines have been selected to determine the
radial velocity curve of the hypergiant star. The following 15 lines
have been selected: He I
![]() 3927, 4009, 4121, 4144,
N II
3927, 4009, 4121, 4144,
N II
![]() 3995, 4601, 4607, 5667, 5680, Si
III
3995, 4601, 4607, 5667, 5680, Si
III
![]() 4553, 4567, 4575, 5740, C II
4553, 4567, 4575, 5740, C II ![]() 4267
and Al III
4267
and Al III ![]() 5696. The radial velocity curve resulting
from measurements of these lines is plotted in Fig. 8 and
listed in Table 2.
5696. The radial velocity curve resulting
from measurements of these lines is plotted in Fig. 8 and
listed in Table 2.
![\begin{figure}
\par\includegraphics[angle=-90,width=8.8cm,clip]{MS2507f08.eps} \end{figure}](/articles/aa/full/2002/27/aa2507/img33.gif) |
Figure 8: Radial velocity curve derived from measurements of 15 selected lines. |
| Open with DEXTER | |
The strong variations in the emission line strength of H![]() and
other strong emission lines are largely artificially introduced by the
normalization of the continuum level. The radial velocity of the
emission lines does not follow the orbital motion as derived from the
absorption lines. This indicates that the emission is largely formed
in the circum-binary matter which does not follow the orbital motion
of the primary. The dynamical spectra for H
and
other strong emission lines are largely artificially introduced by the
normalization of the continuum level. The radial velocity of the
emission lines does not follow the orbital motion as derived from the
absorption lines. This indicates that the emission is largely formed
in the circum-binary matter which does not follow the orbital motion
of the primary. The dynamical spectra for H![]() to H
to H![]() are
shown in Figs. 9 and 10.
are
shown in Figs. 9 and 10.
![\begin{figure}
\par\includegraphics[angle=0,width=7.2cm,clip]{MS2507f09.eps} \end{figure}](/articles/aa/full/2002/27/aa2507/img34.gif) |
Figure 9:
Dynamical spectrum of H |
| Open with DEXTER | |
![\begin{figure}
\par\includegraphics[angle=0,width=7.2cm,clip]{MS2507f10.eps} \end{figure}](/articles/aa/full/2002/27/aa2507/img35.gif) |
Figure 10:
Dynamical spectrum of H |
| Open with DEXTER | |
If the emission line strength of H![]() is corrected for the
varying continuum by using the light curve information, we obtain the
absolute emission strength of the H
is corrected for the
varying continuum by using the light curve information, we obtain the
absolute emission strength of the H![]() line which is shown in
Fig. 11.
line which is shown in
Fig. 11.
![\begin{figure}
\par\includegraphics[angle=-90,width=8.8cm,clip]{MS2507f11.eps} \end{figure}](/articles/aa/full/2002/27/aa2507/img36.gif) |
Figure 11:
Brightness-corrected emission strength of the H |
| Open with DEXTER | |
Since the emission-line radial velocities do not follow the orbital motion, they can be used to derive the system velocity of R 81. The measurements of these lines are summarized in Table 3.
| line |
|
|
| Si II | 5979 | 257 |
| 5958 | 254 | |
| 5056 | 255 | |
| [N II] | 5755 | 244 |
| [Ti II] | 6125 | 255 |
| 253 |
![\begin{figure}
\par\includegraphics[angle=0,width=7.2cm,clip]{MS2507f12.eps} \end{figure}](/articles/aa/full/2002/27/aa2507/img38.gif) |
Figure 12:
Phase diagram of the Mg II |
| Open with DEXTER | |
The blue-shifted absorption at the primary eclipse is very strong in
low-excitation lines showing enhanced stellar-wind effects. As an
example, the Fe II ![]() 5169 line is shown in
Fig. 13.
5169 line is shown in
Fig. 13.
![\begin{figure}
\par\includegraphics[angle=0,width=7.2cm,clip]{MS2507f13.eps} \end{figure}](/articles/aa/full/2002/27/aa2507/img39.gif) |
Figure 13:
Phase diagram of the Fe II |
| Open with DEXTER | |
The absorption event starts abruptly near primary eclipse. The line absorption appears simultaneously over a broad radial velocity range. Thereby the maximum outflow velocity reached is about 250 km s-1 or about 100 km s-1 more than the terminal outflow velocity seen at other phases, e.g. in the hydrogen lines. After the appearance the maximum outflow velocity of the absorption diminishes within a few weeks to the "normal'' velocity seen during other phases. Since the effect is predominately seen in low-excitation lines, the gas in this stream has a lower temperature than the rest of the wind outflow seen during other phases.
A less pronounced absorption enhancement around eclipse is observed in many lines. The most likely explanation is a gas stream from the primary, moving into the line of sight around primary eclipse.
The absorption event is not strictly repeating from cycle to cycle. While the general appearance is similar in both observed cycles, the details are significantly different. Therefore the phase diagram shows a jump for this line. The two absorption events observed are shown in more detail in Fig. 14 below.
![\begin{figure}
\par\includegraphics[angle=0,width=8.8cm,clip]{MS2507f14.eps} \end{figure}](/articles/aa/full/2002/27/aa2507/img40.gif) |
Figure 14:
Time series spectrum of the Fe II |
| Open with DEXTER | |
The profiles of a few selected lines as observed at phase 0.9 and
phase 0.1 are shown in Fig. 15.
![\begin{figure}
\par\includegraphics[angle=0,width=7cm,clip]{MS2507f15.eps} \end{figure}](/articles/aa/full/2002/27/aa2507/img41.gif) |
Figure 15:
Selected line profiles at phase 0.9 and phase 0.1.
The high-velocity absorption is very pronounced in Fe
II |
| Open with DEXTER | |
In this section, we derive the basic properties of the binary system.
The measured radial velocities have been used to derive an orbit with
the program veloc, kindly provided by W. Schmutz. The program
determines the orbital parameters from a least square fit to the
radial velocity data. Thereby the adopted photometric period was kept
fixed for this fit. The found orbital parameters, which are supposed
to be slightly better than in Tubbesing et al. (2001), are:
The phased radial velocities and the orbital solution are over-plotted in Fig. 16.
![\begin{figure}
\par\includegraphics[angle=-90,width=8.8cm,clip]{MS2507f16.eps} \end{figure}](/articles/aa/full/2002/27/aa2507/img47.gif) |
Figure 16: Observed radial velocities and the orbital solution derived by a fit to the data. Here phase zero is the periastron passage, not the photometric phase. |
| Open with DEXTER | |
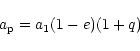
The true orbit is sketched in Fig. 17.
![\begin{figure}
\par\includegraphics[angle=-90,width=7.2cm,clip]{MS2507f17.eps} \end{figure}](/articles/aa/full/2002/27/aa2507/img48.gif) |
Figure 17:
The true orbit of the primary star of R 81. The
observer is at bottom. The plot is labeled with the orbital
phase. C is the center of gravity of the entire binary. For
comparison the radius of the primary is roughly 100 |
| Open with DEXTER | |
The radial velocity curve in Fig. 16 clearly shows the
presence of significant deviations between the orbital solution and
the observations at all phases. These deviations are mainly due to the
pulsation-like variations which can be seen e.g. in
Fig. 7. The residuals between the measured radial
velocities and the orbital solution have been analyzed for
periodicities. A period of
![]() days with an amplitude of
days with an amplitude of
![]() was found. In
Fig. 18 we show the measured radial velocities again,
with an over-plot of the superposition of the orbital model and a
model computed with a sinusoidal pulsational velocity with an
amplitude
was found. In
Fig. 18 we show the measured radial velocities again,
with an over-plot of the superposition of the orbital model and a
model computed with a sinusoidal pulsational velocity with an
amplitude
![]() and a period of 10.78 days.
and a period of 10.78 days.
![\begin{figure}
\par\includegraphics[angle=-90,width=8.8cm,clip]{MS2507f18.eps} \end{figure}](/articles/aa/full/2002/27/aa2507/img53.gif) |
Figure 18: Orbital and pulsational velocities versus date. |
| Open with DEXTER | |
In order to show the pulsational variations more clearly, we computed
a phase diagram of the residual line profiles, i.e., a mean spectrum
has been subtracted from every spectrum. All spectra have been shifted
according to the orbital model for this purpose. The result of the
mean over several absorption lines is shown in Fig. 19.
![\begin{figure}
\par\includegraphics[angle=0,width=8.8cm,clip]{MS2507f19.eps} \end{figure}](/articles/aa/full/2002/27/aa2507/img54.gif) |
Figure 19: Residual line profile of the mean of several absorption lines folded with the 10.78 day pulsational period. The pattern is typical for low-order pulsational modulation. |
| Open with DEXTER | |
The spectroscopic period of 10.78 days is about half the period
of the photometric micro-variations (20-24 days). This is similar to
the B hypergiant ![]() Sco, where the radial velocity variations
show a timescale of 12 days (Rivinius et al. 1997) and the photometric
variations have quasi-periods of 32 and 25 days
(Sterken et al. 1997). Since for R 81 the spectroscopic and
photometric data have been obtained simultaneously, we searched for a
possible correlation. No significant correlation between the two data
sets could be found. It is therefore not clear if the spectroscopic
and photometric variations are related.
Sco, where the radial velocity variations
show a timescale of 12 days (Rivinius et al. 1997) and the photometric
variations have quasi-periods of 32 and 25 days
(Sterken et al. 1997). Since for R 81 the spectroscopic and
photometric data have been obtained simultaneously, we searched for a
possible correlation. No significant correlation between the two data
sets could be found. It is therefore not clear if the spectroscopic
and photometric variations are related.
In order to determine the fundamental stellar parameters
![]() and
and ![]() we compare the observed colours with
model-atmosphere predictions from ATLAS9 (Kurucz 1993).
Unfortunately, the reddening-free colour indices [u-b] and [c1] vary
more or less in tandem, such that it is difficult to determine a
unique combination of effective temperature and gravity. As can be
appreciated from inspecting Fig. 20,
we compare the observed colours with
model-atmosphere predictions from ATLAS9 (Kurucz 1993).
Unfortunately, the reddening-free colour indices [u-b] and [c1] vary
more or less in tandem, such that it is difficult to determine a
unique combination of effective temperature and gravity. As can be
appreciated from inspecting Fig. 20,
![\begin{figure}
\par\includegraphics[angle=-90,width=8.8cm,clip]{MS2507f20.eps} \end{figure}](/articles/aa/full/2002/27/aa2507/img59.gif) |
Figure 20:
|
| Open with DEXTER | |
Since our photometry has no unique solution for the fundamental
stellar parameters, we used spectral lines to break this photometric
degeneracy. We measured the equivalent widths of several lines which
appear to be free of stellar wind effects from visual inspection. They
are given in Table 4.
Since two ionization stages of
silicon are present, we can set an additional spectroscopic
constraint on the effective temperature. We seek the ionization
balance of Si III/ IV in NLTE as a function of stellar
parameters with the silicon abundance fixed at
![]() (Si) = 7.1 (on the scale log
(Si) = 7.1 (on the scale log
![]() (H) = 12),
a typical value for young LMC objects (cf. Korn et al. 2002). The
micro turbulence is determined concordantly between Si and O following
methods described in Gummersbach et al. (1998).
(H) = 12),
a typical value for young LMC objects (cf. Korn et al. 2002). The
micro turbulence is determined concordantly between Si and O following
methods described in Gummersbach et al. (1998).
The final stellar parameters, which are supposed to be better than
in Tubbesing et al. (2001), are as follows:
| line | ||
| O II | 4367 | 91 |
| 4649 | 159 | |
| 4676 | 68 | |
| 4696 | 10 | |
| Si III | 4568 | 146 |
| 4575 | 95 | |
| Si IV | 4116 | 38 |
| N II | 3995 | 180 |
The best values are relatively uncertain as finding the intersection of the fit lines requires some extrapolation (cf. Fig. 20). We account for this fact by assigning large error bars.
It should also be stressed that the parameters derived above are based on a model which assumes a plane-parallel, static atmosphere, with an atmospheric structure based on the assumption of LTE. This is certainly not strictly true for R 81. In addition, we neglect the possible influence of the secondary on the spectrum.
The parameters derived are very close to the parameters of the hypergiants P Cygni (Lamers et al. 1983; Pauldrach & Puls 1990) and other B1Ia hypergiants (Rivinius et al. 1997). However, the strength of Fe II is much larger than in other B1Ia supergiants. Also the spectral type of R 81 (B2.5Ia-O) implies a significantly lower temperature. This might indicate substantial deviations from the assumed temperature and pressure stratification, probably due to significant stellar wind effects.
Unfortunately, despite an extensive search, the secondary component could not be identified in the spectrum. We searched for the secondary in the mean spectrum and also in orbit-corrected spectra of the system. For this purpose, the spectra were corrected for the orbit of the secondary, by assuming different mass ratios and in this way constructing the orbit of the secondary from the known orbit of the primary. No spectroscopic signature of the secondary could be found.
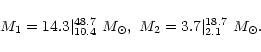
Therefore we can only use the parameters derived above for the primary to derive constraints for the binary system.
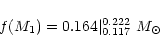
First, we derive from the brightness in secondary minimum the
magnitude of the primary. During this phase, the contribution of the
secondary to the total light has a minimum. We derive:
With
![]() and a distance modulus of
18.60 for the LMC (Groenewegen & Oudmaijer 2000) we get:
and a distance modulus of
18.60 for the LMC (Groenewegen & Oudmaijer 2000) we get:
The relation
![]() from Vacca et al. (1996) thus gives us:
from Vacca et al. (1996) thus gives us:
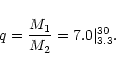
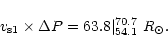
From the orbital data, the mass function can be derived:
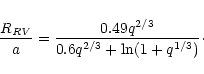
In order to roughly check the parameters derived above, we used an
independent estimate, which does not use the spectroscopically derived
![]() value. For an inclination of
value. For an inclination of
![]() ,
the duration of
the eclipse is given by the approximate formula:
,
the duration of
the eclipse is given by the approximate formula:
The spectroscopic detection of the secondary was one of the main motivations for the observations discussed here. Although we obtained many spectra with high S/N, the detection failed. From the depth of the secondary minimum in the visual, the contribution of the secondary to the total light can be estimated to be about 10%. From the ratio of the depths of the secondary and primary minimum - which indicates the ratio of the surface brightness - the secondary's temperature is estimated to be around 8000 K. If it is a normal star, this would correspond to an A-star of about 13th magnitude. The secondary's spectrum should be therefore easily observable, provided it has sufficiently narrow lines. The absence of the secondary spectrum therefore indicates that the secondary has an unusual spectrum. We suspect that a small star (much smaller than the size of the occulting object producing primary eclipse) is embedded in an extended shell or disk of material accreted from the primary. The estimated mass would be compatible with a B main sequence object. More exotic objects, like Wolf-Rayet stars or black holes seem to be unlikely as no strong mass loss or accretion phenomena are seen from the secondary.
Strong variations, synchronized to the binary motion, are seen in the
mass outflow. Very pronounced in this respect is the repeated
appearance of strong high-velocity wind absorptions near primary
eclipse. Also, the H![]() emission-line flux varies roughly
sine-like with phase. Thereby the minimum emission flux roughly
coincides with primary eclipse, possibly indicating just a maximum in
the absorption of the blue-shifted absorption component. Thus both
effects indicate an enhanced mass flow in the direction of and beyond
the companion. A possible cause for this effect could be the lower
gradient in the gravitational potential near the Lagrange point L1,
facilitating the wind acceleration into this direction by radiation
pressure. However, other effects like the eccentric binary orbit or
gravitational focusing of the wind by the companion should also be
considered in future studies on the interpretation of the observed
time- and direction-dependent mass outflow in R 81.
emission-line flux varies roughly
sine-like with phase. Thereby the minimum emission flux roughly
coincides with primary eclipse, possibly indicating just a maximum in
the absorption of the blue-shifted absorption component. Thus both
effects indicate an enhanced mass flow in the direction of and beyond
the companion. A possible cause for this effect could be the lower
gradient in the gravitational potential near the Lagrange point L1,
facilitating the wind acceleration into this direction by radiation
pressure. However, other effects like the eccentric binary orbit or
gravitational focusing of the wind by the companion should also be
considered in future studies on the interpretation of the observed
time- and direction-dependent mass outflow in R 81.
With the photospheric radius of the primary
![]() ,
rotational velocity
,
rotational velocity
![]() ,
and an inclination
,
and an inclination
![]() ,
we calculate the
rotation period to be 49 days. In R 81 we are facing a system that has
an eccentric orbit. Co-rotation is therefore not possible. Torques
from tidal forces depend strongly on the binary separation
(Zahn 1977). Thus, in an eccentric orbit the torque will be
strongest at the periastron passage, leading to a rotation period
shorter than the orbital period P. This is in agreement with the
rotation period derived here.
,
we calculate the
rotation period to be 49 days. In R 81 we are facing a system that has
an eccentric orbit. Co-rotation is therefore not possible. Torques
from tidal forces depend strongly on the binary separation
(Zahn 1977). Thus, in an eccentric orbit the torque will be
strongest at the periastron passage, leading to a rotation period
shorter than the orbital period P. This is in agreement with the
rotation period derived here.
Surprisingly, the strong modulation of the absorption-line profiles of R 81
clearly shows the characteristics of non-radial
pulsation. No comparable line profile variations have been reported
for stars with similar stellar parameters, although in some cases
these stars have been monitored extensively, e.g. the B-hypergiant
![]() Sco (Rivinius et al. 1997) and the LBV AG Car
(Stahl et al. 2001). Radial-velocity variations have been found in
these two and many other early-type supergiants, but the variations in
most cases appear more irregular and typically do not show the
characteristic pattern of non-radial pulsations. This raises the
question whether the oscillations of R 81 are forced by the tidal
forces in the binary system. Forced oscillations have been discussed
by e.g. Harmanec et al. (1997). For the specific case of eccentric
orbits as in the case of R 81, the pulsations could possibly be
excited by tidal forces at periastron passage.
Sco (Rivinius et al. 1997) and the LBV AG Car
(Stahl et al. 2001). Radial-velocity variations have been found in
these two and many other early-type supergiants, but the variations in
most cases appear more irregular and typically do not show the
characteristic pattern of non-radial pulsations. This raises the
question whether the oscillations of R 81 are forced by the tidal
forces in the binary system. Forced oscillations have been discussed
by e.g. Harmanec et al. (1997). For the specific case of eccentric
orbits as in the case of R 81, the pulsations could possibly be
excited by tidal forces at periastron passage.
Acknowledgements
We thank Jens Viggo Clausen, Bodil Helt, Erik Heyn Olsen for the observations at the SAT telescope and their reduction. This work, and the development of the FEROS spectrograph, was supported by the Deutsche Forschungsgemeinschaft (DFG) with grants Ap 19/6-1/6-2 and Wo 296/26-1/26-3. We thank Werner Schmutz for the program veloc. C.S. expresses his gratitude to the Belgian Fund for Scientific Research (FWO) and to the Flemish Ministry for Foreign Policy, European Affairs, Science and Technology for supporting part of this project. We thank H. Duerbeck, A. van der Meer and R. Dijkstra, who obtained part of the photometric data at the Dutch 90-cm telescope.