The ISM is so complicated that any model of it is bound to be heavily idealized and stylized, especially the assumption of a strict equilibrium. But some aspects, especially the presence of phases - discrete regimes of density and ionization - seem robust to variations in the underlying parameters. The existence of multiphase gas seems to be quite general, highly conserved across space and time.
The basis of the present work is a calculation of two-phase equilibrium
following work on the local ISM by Wolfire et al. (1995a). Notable constraints on
the model locally are the thermal pressure range
![]() K
observed (via C I and C I*) in neutral gas locally by Jenkins et al. (1983),
and the electron density in warm gas at the Solar radius
K
observed (via C I and C I*) in neutral gas locally by Jenkins et al. (1983),
and the electron density in warm gas at the Solar radius
![]() (Taylor & Cordes 1993). As noted by Wolfire et al. (1995a),
strict two-phase equilibrium
is an idealized goal toward which the ISM may tend, but true equilibrium
is hard to attain, especially in warm gas where the cooling timescales
are long.
(Taylor & Cordes 1993). As noted by Wolfire et al. (1995a),
strict two-phase equilibrium
is an idealized goal toward which the ISM may tend, but true equilibrium
is hard to attain, especially in warm gas where the cooling timescales
are long.
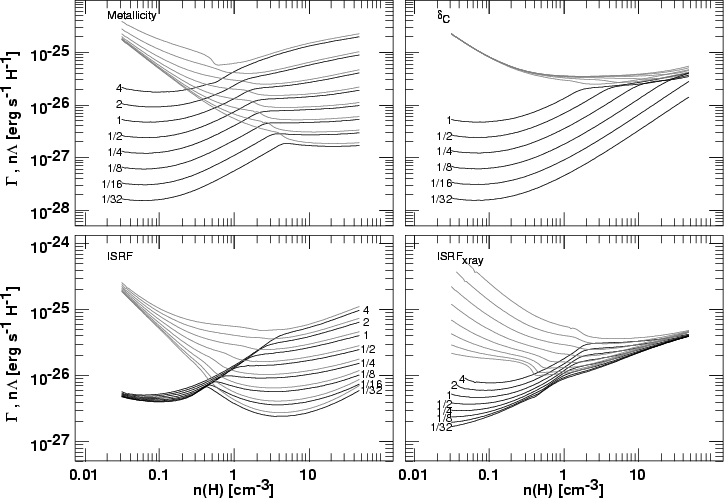 |
Figure 2:
As in Fig. 1, but the quantities shown in each panel are
the energy loss rate n |
Basically, this "standard'' model of the local diffuse ISM is driven by the heating due (in increasing order of importance in warm gas) to cosmic-rays, soft X-rays, and - the dominant mechanism in both warm and cool gas - the photoelectric effect on small grains (Bakes & Tielens 1994). The charge state of the small grains, their heating rates and the recombination of ions on them (which dominates over gas-phase processes at moderate densities in diffuse gas) are all very sensitive to the electron density, so local thermal and ionization equilbria are tightly coupled. Given that carbon is the main source of cooling in cooler gas (O I to a lesser extent) and an important source of free electrons, it follows that the equilibrium conditions and the condition of carbon in the gas are very tightly coupled.
We recently used this code (Liszt 2001) to discuss the
behaviour of the H I spin temperature in local warm gas (the H I there
is not generally thermalized by collisions in multiphase equilbrium)
and to calculate the abundances of ![]() and CO in denser diffuse gas
(Liszt & Lucas 2000). The latter reference describes the model in more
detail than will be given here, especially the various collisional
processes which drive fine-structure cooling in the gas (they are,
of course also discussed in the original reference by Wolfire et al. 1995a).
and CO in denser diffuse gas
(Liszt & Lucas 2000). The latter reference describes the model in more
detail than will be given here, especially the various collisional
processes which drive fine-structure cooling in the gas (they are,
of course also discussed in the original reference by Wolfire et al. 1995a).
Our basic calculation differs from that of Wolfire et al. (1995a) in two minor
ways which are subsumed by the extent of our parameter variations.
The earlier authors took the locally-determined soft X-ray flux from
Garmire et al. (1992) and decomposed it into three components, each of which
they represented by a (physically-motivated) plasma emissivity
which was then separately attenuated (or not) by an assumed column of warm
gas; the three contributions were then summed to provide the assumed
incident X-ray spectrum at a typical location. Their final spectrum
is characterized by a quantity they called Nw, the overall column of
warm gas attenuating part of the incident spectrum
![]() whose standard value they took to be
Nw = 1019 H atoms
whose standard value they took to be
Nw = 1019 H atoms
![]() We
used a simpler representation of the soft X-ray flux, whereby the
observed spectrum is attenuated by a column of neutral gas Nw directly.
Our standard value of
We
used a simpler representation of the soft X-ray flux, whereby the
observed spectrum is attenuated by a column of neutral gas Nw directly.
Our standard value of
![]() H atoms
H atoms
![]() produces a pressure-density curve which differs little from that
of Wolfire et al. (1995a).
produces a pressure-density curve which differs little from that
of Wolfire et al. (1995a).
We also used a somewhat different set of reference (Solar) atomic
abundances whereby
![]() ,
,
![]() ,
namely those
which accompanied the distribution of the soft X-ray absorption cross-
sections from (Balucinska-Church & McCammon 1992), which both we and Wolfire et al. (1995a) used
(in their most recently updated version). In both calculations the
reference model has (following Wolfire et al. 1995a) little or no
depletion of the gas phase oxygen and carbon onto grains, which
might be acceptable for warm gas (where carbon does not bear the
brunt of the cooling or contribute many of the electrons, see below)
but is unlikely to be reasonable in local cool gas; if there are grains,
they have to be made of something! The gas phase depletion is considered
an adjustable parameter here, independent of the metallicity.
,
namely those
which accompanied the distribution of the soft X-ray absorption cross-
sections from (Balucinska-Church & McCammon 1992), which both we and Wolfire et al. (1995a) used
(in their most recently updated version). In both calculations the
reference model has (following Wolfire et al. 1995a) little or no
depletion of the gas phase oxygen and carbon onto grains, which
might be acceptable for warm gas (where carbon does not bear the
brunt of the cooling or contribute many of the electrons, see below)
but is unlikely to be reasonable in local cool gas; if there are grains,
they have to be made of something! The gas phase depletion is considered
an adjustable parameter here, independent of the metallicity.
The net effect of these two differences is slight. With the exception of one system, the observations show that carbon is present in the gas in the same proportion as other species which are typically undepleted locally, i.e. there is low metallicity, but little global carbon depletion.
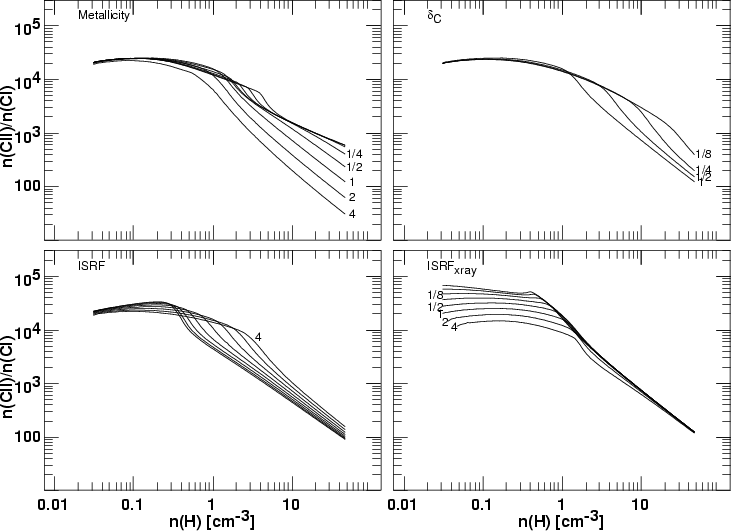 |
Figure 3: As in Figs. 1 and 2, but the quantity shown in each panel here is the ratio of once-ionized to neutral carbon n(C II)/n(C I). |
In Fig. 1 we show the basics of two-phase equilibrium and its
sensitivity to some assumed parameter variations. In these curves
of pressure vs. density (one assumes a density, calculates the
ionization and thermal equilibrium, sums the particle densities
and multiplies by the derived temperature), the regions where
dP/dn < 0 are held to be unstable and unlikely to occur in nature.
Those pressures for which there are two densities n
![]() having
dP/d
n|n' > 0 are those for which "two-phase'' equilibrium
is possible. Two-phase heating and cooling calculations by themselves
furnish only the possibility of multi-phase equilibrium; Hennebelle (2000) and
Kritsuk & Norman (2002) elaborate on some processes by which phase transitions and
multi-phase equilibrium are actually brought about.
having
dP/d
n|n' > 0 are those for which "two-phase'' equilibrium
is possible. Two-phase heating and cooling calculations by themselves
furnish only the possibility of multi-phase equilibrium; Hennebelle (2000) and
Kritsuk & Norman (2002) elaborate on some processes by which phase transitions and
multi-phase equilibrium are actually brought about.
The curve labelled "1'' in all panels is the same (reference) model; perhaps most clearly at upper right it is apparent that the reference model provides for two-phase equilibrium over precisely the pressure range which is observed in local gas (Jenkins et al. 1983). Typically (but see below and the lower-left panel), only warm (7000 K-10 000 K) neutral gas appears if the density and pressure are below the two-phase regime and only cold (below 1000 K) neutral gas appears if the pressure and density are larger. If conditions are such that the warm gas may persist up to higher density and pressure, or when the cold medium cannot exist except at higher density and pressure, the medium is more likely to be warm.
At the top left, the metallicity is varied by factors of 4 to 1/32
relative to the reference value; these may be compared with the
calculations of Wolfire et al. (1995b). Many properties of the model actually
vary in concert including; the elemental and gas-phase C and O abundances
(there is no depletion); the columns of all other species heavier than
Helium providing soft X-ray absorption; and the number of grains both large
and small (the latter scales the heating rate of photoelectric ejection).
Vladilo (1998) shows that the dust/metal ratio
![]() at
higher redshift relative to conditions in the Milky Way (MW) so
that
at
higher redshift relative to conditions in the Milky Way (MW) so
that
![]() changes mostly because
of metallicity (Z/G), not D/Z. In fact, such an overall scaling
has a surprisingly modest effect compared to some other changes
discussed next. The warm phase may persist up to slightly higher
pressures and densities in gas of lower overall metallicity but
the existence of two-phase equilibrium is not threatened as long
as the balance between heating (small grains) and cooling (carbon)
is maintained in denser gas (as it is in this case).
changes mostly because
of metallicity (Z/G), not D/Z. In fact, such an overall scaling
has a surprisingly modest effect compared to some other changes
discussed next. The warm phase may persist up to slightly higher
pressures and densities in gas of lower overall metallicity but
the existence of two-phase equilibrium is not threatened as long
as the balance between heating (small grains) and cooling (carbon)
is maintained in denser gas (as it is in this case).
At upper right, the gas-phase abundances of C and O are decreased while all other parameters are held fixed and this actually has a much more profound effect than scaling the grain (heating) and gas (cooling) abundances in tandem. Carbon provides some heating of the gas (via its ionization, see Spitzer & Scott 1969) but is more important as a source of electrons, influencing the grain heating and recombination rates, and as a coolant. Clearly, when the ambient fluxes are maintained while the main coolants (carbon and oxygen) and source of electrons are depleted, it is substantially more difficult to provide enough pressure to maintain gas in the cool phase. This hearkens back to our discussion, slightly earlier, of the lack of inclusion of depletion in the reference model for MW conditions. In order to maintain two-phase stability over the reference range of pressures in the presence of gas-phase depletion, the incident optical/uv ionizing radiation field must be decreased somewhat. In fact this might not be unreasonable locally for cool gas, which does not occur in arbitrarily small increments and therefore exists under conditions of non-trivial extinction (especially at uv wavelengths). At lower metallicity, this sort of compensation is less obvious and (consistent with some aspects of the observations) the pressure may in fact be somewhat higher in cool gas.
At lower left, we scale the ambient optical/uv radiation field which ionizes carbon (directly) and provides heating and electrons via the photoelectric effect on small grains. Regions whose ambient radiation field (ISRF) falls even a factor four below the average will be predominantly cool. This is an inversion of the normal order of things in diffuse gas and darker clouds in the nearby ISM occur at higher, not lower, thermal pressure.
Last, at lower right, we scale the soft X-ray flux. Cool regions of higher density will probably never see the full extent of the ambient soft x-ray flux because even a small region of appreciable density accumulates a high degree of X-ray absorption. The heating due to soft X-rays tends to increase on a per-event basis as the X-ray spectrum hardens somewhat after absorption, and tends to decrease as the electrons cause more secondary ionization and less direct heating when the ionization fraction is smaller (in neutral gas).
Figure 2 shows, for the same set of parameter variations, the total
gas heating rate ![]() and the loss of energy (
and the loss of energy (![]() )
due to
cooling in the
)
due to
cooling in the
![]() C II line (discussed below at some length), in
units of ergs s-1 H-1. For the reference model, some 90%
of the heating is due to the photoelectron effect operating on small
grains, see Fig. 3 of Wolfire et al. (1995a). In warm gas, the burden of cooling
is taken up by excitation of the Ly-
C II line (discussed below at some length), in
units of ergs s-1 H-1. For the reference model, some 90%
of the heating is due to the photoelectron effect operating on small
grains, see Fig. 3 of Wolfire et al. (1995a). In warm gas, the burden of cooling
is taken up by excitation of the Ly-![]() lines under the
highly-idealized assumption that all photons escape; in fact, these photons
may travel substantial distances but by and large do not always
escape a two-phase galactic layer before being absorbed by
dust, at Solar metallicity: the situation may actually be very different
in three-phase models, see Neufeld (1991) and Liszt (2001). In cool gas,
the cooling is due almost entirely to carbon and oxygen fine-structure
excitation, in the reference model. The curves of
lines under the
highly-idealized assumption that all photons escape; in fact, these photons
may travel substantial distances but by and large do not always
escape a two-phase galactic layer before being absorbed by
dust, at Solar metallicity: the situation may actually be very different
in three-phase models, see Neufeld (1991) and Liszt (2001). In cool gas,
the cooling is due almost entirely to carbon and oxygen fine-structure
excitation, in the reference model. The curves of ![]() in Fig. 2
directly show the brightness (normalized; per H) of the C II*
in Fig. 2
directly show the brightness (normalized; per H) of the C II*
![]() cooling transition; in cool gas the O I* transition at
cooling transition; in cool gas the O I* transition at
![]() makes up most of the cooling not provided by C II.
makes up most of the cooling not provided by C II.
There is really a quite profound change in the local thermodynamics when the metallicity or ionizing flux varies (Fig. 2, upper and lower left). In particular, while the energy input per H into cool and warm gas is nearly the same for the "Solar'' metallicity and the standard ISRF or higher, it is much smaller in cooler gas when the metallicity is low. In the Milky Way, the carbon cooling rate can be used to infer the heating in both cool and warm gas. In systems of low metallicity such is not the case.
In general, the brightness of the C II ![]() line scales with metallicity
at all densities (Fig. 2, upper left) and varies nearly linearly in cool
phase-stable gas since n(C II*)/n(C II) changes little with metallicity (see
Fig. 5). It also scales with the strength of the ISRF in cool gas (Fig. 2,
lower left), due to changes in n(C II*)/n(C II) (Fig. 5). The C II
line scales with metallicity
at all densities (Fig. 2, upper left) and varies nearly linearly in cool
phase-stable gas since n(C II*)/n(C II) changes little with metallicity (see
Fig. 5). It also scales with the strength of the ISRF in cool gas (Fig. 2,
lower left), due to changes in n(C II*)/n(C II) (Fig. 5). The C II
![]() brightness varies with depletion at lower densities (Fig. 2 upper right) and
slightly, at low density, with variations in the soft X-ray flux.
From the results at upper right in Fig. 2 we see that C II may not
be the dominant host of cooling in cooler gas, at quite high densities,
if the depletion (not the metallicity) is extreme; oxygen becomes the
preferred coolant due to the higher energy separation in its ground state
fine-structure levels. There is no reason to believe that such conditions
occur widely in diffuse gas, either locally or in damped Lyman-
brightness varies with depletion at lower densities (Fig. 2 upper right) and
slightly, at low density, with variations in the soft X-ray flux.
From the results at upper right in Fig. 2 we see that C II may not
be the dominant host of cooling in cooler gas, at quite high densities,
if the depletion (not the metallicity) is extreme; oxygen becomes the
preferred coolant due to the higher energy separation in its ground state
fine-structure levels. There is no reason to believe that such conditions
occur widely in diffuse gas, either locally or in damped Lyman-![]() systems, although one
source in Table 2 (PHL957) seems quite deficient in carbon, given its
quoted metallicity.
systems, although one
source in Table 2 (PHL957) seems quite deficient in carbon, given its
quoted metallicity.
Figure 3 shows the ratio of the two lowest ionization states of carbon n(C II)/n(C I). It differs by a factor of 40-100 between warm and cool neutral gas for the standard model, and is relatively insensitive to parameter changes, redshift, etc. This makes it a sensitive indicator of the thermodynamic state of the gas, as discussed in Sect. 3, but also causes confusion when mixtures of the two phases are observed along the same line of sight (see Sect. 2.6). Some aspects of the behaviour shown in Fig. 3 are counter-intuitive; for instance, a stronger ISRF maintains a high C II/C I ratio into denser gas, but the C II/C I ratio is actually smaller in very tenuous gas when the radiation field is higher. This arises in part because the equilibrium pressure increases with the strength of the radiation field and partly due to the level of ionization in the gas (which is not solely determined by carbon).
If the C II lines are saturated or N(C II) is otherwise unknown, but N(C I)
and N(H) are available, the thermodynamic state of the gas may also be
inferred by computing N(C)/N(H) ![]() N(C II)/N(H)
N(C II)/N(H) ![]() N(C II)/N(C I)
N(C II)/N(C I) ![]() N(C I)/N(H). Presumably, if the gas is actually cool, the
inferred carbon abundance will be much too large (inconsistent with
the metallicity) if the high n(C II)/n(C I) ratios typical of warm gas
are assumed.
N(C I)/N(H). Presumably, if the gas is actually cool, the
inferred carbon abundance will be much too large (inconsistent with
the metallicity) if the high n(C II)/n(C I) ratios typical of warm gas
are assumed.
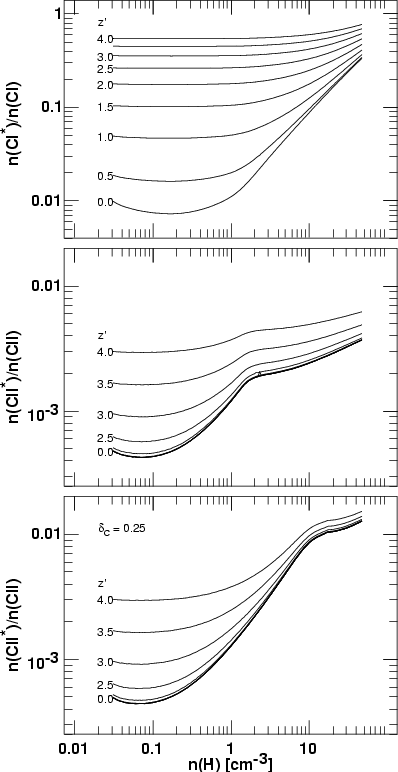
The triplet fine-structure of the C I ground state is also accessible to spectroscopy. It is actually rather insensitive to the parameter variations noted above (with the slight exception that C I*/C I increases modestly with increasing X-ray flux at low density) but responds very strongly to a change in the cosmic background level because the first excited state is only 23.2 K above ground. Figure 4 (top) shows the ratio of populations in the lowest two levels as a function of cmb. Clearly, this ratio is a sensitive indicator of the ionization state at low redshift (it differs by a factor of about thirty between warm and cool gas) but is rather insensitive for redshifts above 1.5 or so. The C I*/C I ratio measures cmb at high redshift in the context of our models (see Roth & Meyer 1992). Although perhaps within observational errors, it follows from the results in Fig. 4 that quoted column densities of neutral carbon for high-z systems should include a correction factor for the excited state population.
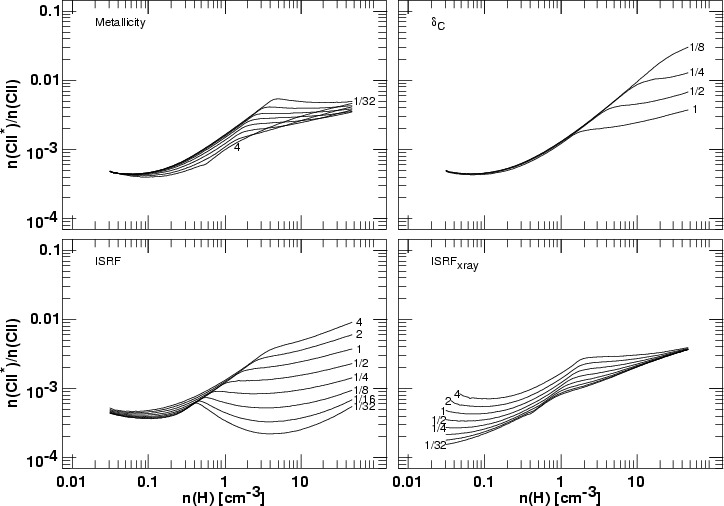 |
Figure 5: As in Figs. 1, 2 and 3, but the quantity shown in each panel here is the ratio of excited (C II*) to ground-state atoms in once-ionized carbon. |
The rate of energy loss due to a radiative transition between two
levels k and j having statistical weights ![]() and
and ![]() ,
level populations
,
level populations ![]() and
and ![]() (units of
(units of
![]() ),
energy separation Ekj and spontaneous emission rate Akj (
),
energy separation Ekj and spontaneous emission rate Akj (
![]() ),
immersed in an isotropic radiation field characterized by cmb is
(Goldreich & Kwan 1974)
),
immersed in an isotropic radiation field characterized by cmb is
(Goldreich & Kwan 1974)
The 133.5 and 133.6 nm C II and C II* absorption lines have received
more attention because of the obvious possibility that C II is the
dominant ionization stage. But discussions of the excitation of
the C II* fine-structure levels often fail to recognize the role of
carbon in determining the conditions under which it is observed; in many
cases (see Fig. 2) C II will be the dominant coolant when it is the
dominant ionization stage. This means
that the brightness of the C II
![]() line and the C II*/C II ratio are
determined by thermodynamic equilibrium - the energy input to the gas
which occurs at a given density and temperature. So, if the energy
input into the gas does not change, neither will the brightness of the
line and the C II*/C II ratio are
determined by thermodynamic equilibrium - the energy input to the gas
which occurs at a given density and temperature. So, if the energy
input into the gas does not change, neither will the brightness of the
![]() line or the strength of the 133.5 nm C II* absorption line. In Fig. 2 at upper right, for a density of
line or the strength of the 133.5 nm C II* absorption line. In Fig. 2 at upper right, for a density of
![]() ,
it requires a factor
8 drop in the the amount of carbon in the gas to weaken the
,
it requires a factor
8 drop in the the amount of carbon in the gas to weaken the
![]() line
by about a factor 2, all other things being equal.
line
by about a factor 2, all other things being equal.
Figure 5 shows the parameter sensitivities of the C II*/C II ratio. Weak
variation in the n(C II*)/n(C II) ratio in cool gas is shown in
many ways in the panels of Fig. 5. For the reference model, the ratio
varies by only 50% between
![]() (K = 1000 K) and n(H) 40
(K = 1000 K) and n(H) 40
![]() (K = 75 K). The variation with carbon depletion at upper
right illustrates the effects of thermodynamic considerations.
The ratio n(C II*)/n(C II) increases
as carbon is removed from the gas or n(C II) decreases, because the
brightness of the
(K = 75 K). The variation with carbon depletion at upper
right illustrates the effects of thermodynamic considerations.
The ratio n(C II*)/n(C II) increases
as carbon is removed from the gas or n(C II) decreases, because the
brightness of the
![]() line (and n(C II*)) must stay constant in order
to carry away a given amount of energy which is being input to the
gas (see Fig. 2). The behaviour at lower left, where the C II*/C II
ratio is a scaled representation of the cooling rate (also see
Fig. 2) shows how the brightness of the
line (and n(C II*)) must stay constant in order
to carry away a given amount of energy which is being input to the
gas (see Fig. 2). The behaviour at lower left, where the C II*/C II
ratio is a scaled representation of the cooling rate (also see
Fig. 2) shows how the brightness of the
![]() line, or the amount
of excited-state C II*, must change proportionally as the energy input
to the gas changes.
line, or the amount
of excited-state C II*, must change proportionally as the energy input
to the gas changes.
In warm gas where its excitation is weak and C II is not the dominant coolant, the population of the C II* level is susceptible to change with cmb. This is shown in the lower two panels of Fig. 4. The ability of the C II* population to discriminate between phases may be lost at higher redshift.
| Source | 3C286 | 0454+039 | 1756+237 | 1331+170 | 0013-004 | 1232+0815 | PHL957 |
| z | 0.69 | 0.86 | 1.67 | 1.78 | 1.97 | 2.24 | 2.31 |
| [Zn/H] | -1.22 | -1.1 | (-0.8)a | -1.27 | -0.80 | -1.20 | -1.38 |
| N(H I) | 1.8E21 | 4.2E20 | 2.0E20 | 1.5E21 | 5.0E20 | 7.9E20 | 2.8E21 |
| N( |
6.9E19 | 6.3E16 | <5.0E15 | ||||
| N(C I) | >4E13 | 4.4E13 | 1.4E13 | 1.7E13 | 6.3E13 | 4.0E13 | |
| N(C II) | 4.5E16 | 2.7E16 | 7.8E15 | ||||
| N(C II*) | 7.9E13 | 1.4E14 | 1.9E14 | 7.6E13 | |||
| N(C II) |
3.8E16 | 1.2E16 | (1.1E16) | 2.9E16 | 2.8E16 | 1.8E16 | 4.1E16 |
| N(C II)/N(C I)c | (<952) | (293) | (803) | 2647 | 446 | 445 | >1734 |
| N(C II*)/N(C II) | (0.0072) | 0.0031 | 0.0070 | 0.0097 |
a assumed for illustrative purposes; other (entries) follow.
b N(C II)![]() is the amount of carbon if [C/Zn] is Solar.
is the amount of carbon if [C/Zn] is Solar.
c values in parentheses use N(C II)![]() .
.
References:
3C286: Boisse et al. (1998); Roth & Meyer (1992).
0454+039: Boisse et al. (1998); Steidel et al. (1995).
1756+237: Roth & Bauer (1999).
1331+170: Chaffee et al. (1988); Ge et al. (1997).
0013-004: Ge et al. (2001).
1232+0815: Black et al. (1987); Srianand et al. (2000) quote N(![]() )
= 1.5E17
)
= 1.5E17
![]() .
.
PHL957: Black et al. (1987).
In this context it is important to note that the
![]() K
energy separation of the C II fine-structure levels (to a lesser extent
the 232 K separation in O I), is absolutely crucial to the similarity
of two-phase equilibrium conditions out to moderate redshift, say
z < 10. If the gas locally were cooled by softer photons of
energy
K
energy separation of the C II fine-structure levels (to a lesser extent
the 232 K separation in O I), is absolutely crucial to the similarity
of two-phase equilibrium conditions out to moderate redshift, say
z < 10. If the gas locally were cooled by softer photons of
energy ![]() such that we could observe out to some redshift
where
such that we could observe out to some redshift
where
![]() ,
the distant gas would have to have
a different coolant. It is apparent from the behaviour of the C I*/C I
ratio in Fig. 4 that C I*, for example, could not be an important gas
coolant at z > 3. The same is true of the lower lines of CO (where
,
the distant gas would have to have
a different coolant. It is apparent from the behaviour of the C I*/C I
ratio in Fig. 4 that C I*, for example, could not be an important gas
coolant at z > 3. The same is true of the lower lines of CO (where
![]() K, 11.0 K, 16.5 K, etc.).
K, 11.0 K, 16.5 K, etc.).
When a property like the N(C II*)/N(C II) ratio - call it R - takes on
values ![]() and
and ![]() in warm and cool gas, respectively, and a transparent
superposition of phases is observed to have a global value
in warm and cool gas, respectively, and a transparent
superposition of phases is observed to have a global value
![]() ,
,
![]() is related to the proportion of gas in the two phases as
is related to the proportion of gas in the two phases as
![\begin{displaymath}\mbox{$F_{\rm C}$ }= {{\mbox{$R_{\rm C}$ }}\over{\mbox{$R_{\r...
...t[{{\mbox{$R_{\rm W}$ }}\over{\mbox{$R_{\rm OBS}$ }}}-1\right]
\end{displaymath}](/articles/aa/full/2002/26/aa2497/img57.gif)
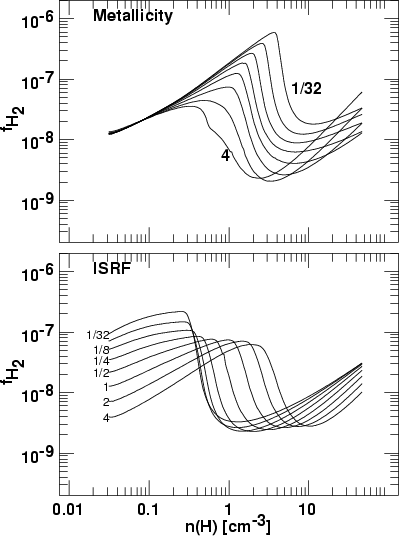 |
Figure 6:
Molecular fractions 2n( |
In stable two-phase gas (Fig. 3 at upper left) ![]() = 20 000 and (roughly)
= 20 000 and (roughly)
![]() = 700/n(H) in gas of Solar metallicity (
= 700/n(H) in gas of Solar metallicity (![]() varies rather less at
low metallicity). In this case, measuring a global average of, say,
varies rather less at
low metallicity). In this case, measuring a global average of, say,
![]() = 1000 implies only that there is some fraction
= 1000 implies only that there is some fraction
![]() of
gas having
of
gas having
![]() along the line of sight.
along the line of sight.
This ambiguity cannot generally be resolved with recourse to comparison of profiles, which are largely undifferentiated in the C II line, having been broadened due to some combination of; underlying kinematics in the host system; doppler-broadening of individual gas complexes; and, saturation. In the Milky Way, C II lines are typically fit with much larger b-values (Doppler broadening parameters) even when a single cloud or gas complex dominates the line of sight to a nearby star (cf. Morton 1975). Because of this one cannot, for instance, try to compare the C II* with only that fraction of the C II which overlaps it in velocity.
Copyright ESO 2002