G. B. Gelfreikh1 - V. I. Makarov1 - A. G. Tlatov1 - A. Riehokainen2 - K. Shibasaki3
1 - Pulkovo Astronomical Observatory, 196140 Saint
Petersburg, Russia,
2 - Tuorla Observatory, 21500 Piikkiö, Finland,
3 - Nobeyama Radio Observatory, Minamisaku, Nagano 384-13, Japan
Received 15 November 2001 / Accepted 15 April 2002
Abstract
An analysis of solar rotation as a function of heliographic
latitude and
time is
made using daily radio maps of the Sun at the wavelength of 1.76 cm.
Variations of the
velocity as a function of the latitude during the period 1992-2001 have been
studied.
The mean synodical rotation rate of the intensity features is best fit by
Radio observations with high accuracy and reliability thus confirm the reality of torsional oscillations in the higher levels of the solar atmosphere.
Key words: Sun: activity - Sun: rotations - Sun: radio radiation
In the previous work (Paper I) we used daily radio maps of the Sun at the wavelength of 1.76 cm to analyse the parameters of solar activity at all latitudes. We described some effective methods of studying the development of the present solar cycle. We analysed the areas/numbers of regions with an excess of brightness above a certain fixed level (bright regions), as well as regions with brightness below a certain level (dark regions) as indices of the level of solar activity.
In the present paper we investigate solar differential rotation and its
variations with the phase of solar activity.
The spatial resolution of the Nobeyama radio heliograph, ten arcsec at
![]() cm, has proved to be high enough to achieve high accuracy in
measuring the angular
rotation of the Sun, its dependence on the heliographic latitude and its
variations with time.
Our main goal is to derive the time dependence of the rotation rate,
which might be related to the solar activity cycle.
cm, has proved to be high enough to achieve high accuracy in
measuring the angular
rotation of the Sun, its dependence on the heliographic latitude and its
variations with time.
Our main goal is to derive the time dependence of the rotation rate,
which might be related to the solar activity cycle.
Traditional methods of studying solar differential rotation are based on measuring the Doppler shift of the spectral lines, analyzing positions of sunspots, floculae and prominences, etc. In the optical range LaBonte & Howard (1982) analysed Doppler measurements and detected a time variation in the differential rotation, or alternating bands of faster and slower rotation, which they called "torsional oscillations''. They found that the rotation rate as a function of time can be described as a superposition of an average rotation and an oscillating component with a period about that of the solar cycle. The time-varying component appears as alternating bands of faster and slower than average rotation, moving from high latitudes towards the equator. Snodgrass (1985, 1991), using Doppler measurements and magnetograms, found a torsional oscillation pattern in the magnetic field, similar to the one in the Doppler data, but not exactly the same. Komm et al. (1993) used Kitt Peak magnetograms with high spatial resolution and found that the small magnetic features rotate faster than the large-scale magnetic field pattern in the equatorial region, but show the same rotation rate at higher latitudes. They found that magnetic torsional oscillation resembles the pattern derived from Doppler measurements, but is different in some aspects. Antonucci et al. (1990) found a north-south asymmetry in the rotation rate of the photospheric magnetic fields. Makarov & Tlatov (1997) investigated the differential rotation of the large-scale magnetic field in the H-alpha synoptic charts for 1915-1990 using Walsh function expansions. They found seven zones of slower and faster than average rotation.
In general, the torsional oscillation patterns resemble each other, but with some differences that could be due to the different depth at which the differential torsional oscillation indicators are rooted. One should keep in mind, however, that different methods do not lead to identical rotation parameters, probably due to the very complicated structure of the solar plasma. In addition, many methods are applicable only to narrow latitude intervals. In many cases the observational coverage is not full enough for homogeneous daily data, essential for studying the variations over a solar cycle. The daily Nobeyama radio observations therefore open a new page in such studies.
The Nobeyama observations for the first time give high-quality radio observations at a level suitable for studying not only the dependence of the rotation velocity on the heliographic latitude over whole disk but also the variations of this function with the phase of the solar activity. The period of observations at Nobeyama (1992-2001) is long enough to observe both the initial events of the present cycle (especially important near the solar poles) and the development of the cycle up to its maximum (in 2001). One should keep in mind that the behaviour of the law of rotation near solar poles provides important information in constructing modern theories of the cycles of solar activity (Kosovichev et al. 1997).
This study is not the first attempt to use radio data to measure solar
rotation. At the
frequency of 37 GHz (
![]() mm) (Brajsa et al. 2000;
Riehokainen et al. 1998) the differential rotation
velocities are in the range of 9 to 13 deg/day (sidereal rotation) at
latitudes higher
than
mm) (Brajsa et al. 2000;
Riehokainen et al. 1998) the differential rotation
velocities are in the range of 9 to 13 deg/day (sidereal rotation) at
latitudes higher
than ![]() .
.
We may hope that the analysis of torsional oscillations observed in the radio region will result in progress in their physical interpretation.
We have used the full-disk Nobeyama radio intensity map (one per
day) in FITS format.
In the analysis we used partial maps, that were made by remapping
full-disk radio intensity maps for an area of
![]() in latitude and
in latitude and
![]() in longitude.
We measured the one-dimensional intensity
distribution along fixed latitudes
in longitude.
We measured the one-dimensional intensity
distribution along fixed latitudes ![]() ,
,
![]() ,
,
![]() ,
etc., using
,
etc., using ![]() longitude steps.
The angular rotation rate at a given
latitude was found through a correlation analysis of the obtained brightness
distributions in two consecutive days.
longitude steps.
The angular rotation rate at a given
latitude was found through a correlation analysis of the obtained brightness
distributions in two consecutive days.
The total number of crosscorrelated pairs of days
used during 1992-2001 was 2992: 170 pairs in 1992, 343 in 1993, 306 in 1994,
280 in 1995, 335 in 1996, 355 in 1997,
347 in 1998, 339 in 1999, 346 in 2000 and 71 in 2001.
The longitude shift
![]() (or
(or ![]() see below) due
to the rotation between the two radio images was found from the
condition of a maximum
correlation coefficient between the brightness distributions.
A preliminary value of
longitude shift (or k for given latitude) was estimated from
see below) due
to the rotation between the two radio images was found from the
condition of a maximum
correlation coefficient between the brightness distributions.
A preliminary value of
longitude shift (or k for given latitude) was estimated from
![]() ,
where
,
where
![]() is time interval between the daily pair and
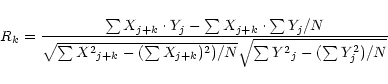
is time interval between the daily pair and ![]() is the rotation rate (Komm et al. 1993).
Correlation coefficients for
different latitudes were calculated according to
is the rotation rate (Komm et al. 1993).
Correlation coefficients for
different latitudes were calculated according to
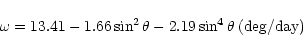
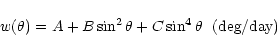
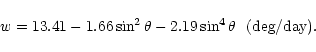
For comparison with other results we presented the differential rotation
in the following expansion:
In calculating the rotation velocities we have used only pairs with a correlation coefficient R>0.7.
The average differential rotation deduced from the whole data
set for
1992-2001 is shown in Fig. 1. Error bars are not plotted in this figure
because the variance at a given latitude has a significant contribution
from solar cycle effects as well as from observational noise.
The synodic
rotation rate (averaged over the whole period) can be approximated
by the formula:
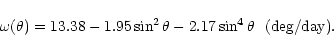
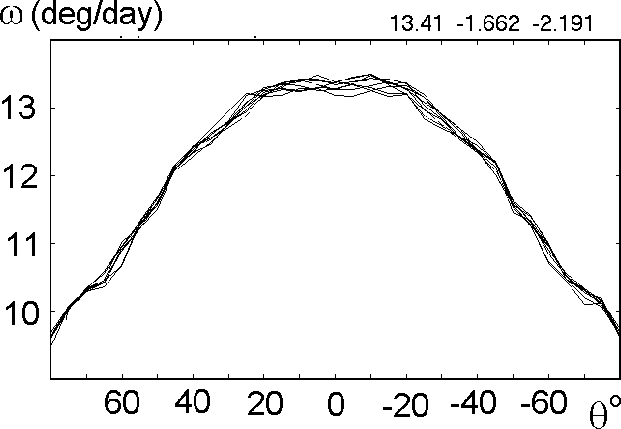 |
Figure 1: The synodic velocity of the solar rotation for the years 1992-2001 (averaged for each year). |
| Open with DEXTER | |
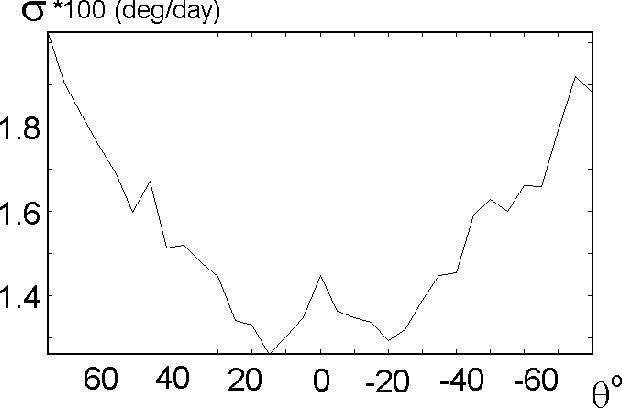 |
Figure 2: The root mean square deviation of the rotation rate from the yearly mean rate of the solar rotation. |
| Open with DEXTER | |
 |
Figure 3:
Time variation of synodic angular velocity in the equatorial zone
|
| Open with DEXTER | |
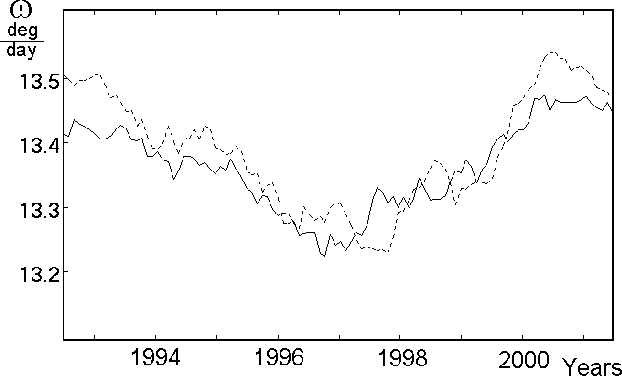 |
Figure 4:
Time variation of synodic angular velocity for the heliographic latitudes
|
| Open with DEXTER | |
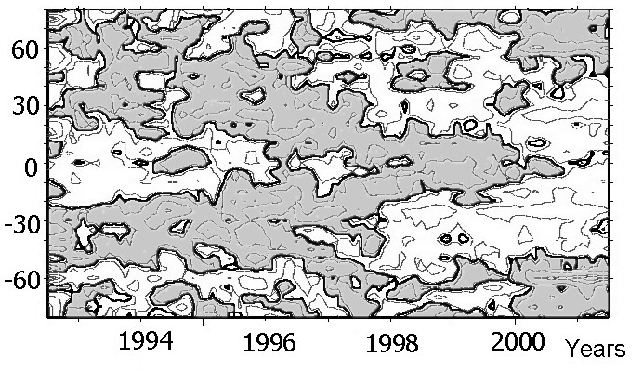 |
Figure 5: The net pattern derived from the rotation rate fits smoothed by a 3-month running mean. It is the latitude-time diagram of shift velocities in respect to the mean value of differential rotation of the Sun during 1992-2001. Dark features represent the slower than average rotation, bright features - faster than average. |
| Open with DEXTER | |
The error in the rotation rate is shown in Fig. 2. The root mean
square deviation from the yearly mean values of the rotation rate was found
to be around 0.013 deg/day for the equatorial regions and about 0.02 deg/day
for the polar ones. The resulting average difference in the
rotation rate is about ![]() at low and middle latitudes and
less than
at low and middle latitudes and
less than ![]() at high latitudes. The small maximum in
at high latitudes. The small maximum in ![]() at
the equatorial
zone is connected with the absence of activity in this region.
These values may be considered as an estimation of the accuracy of
the method. However, at the same time they may also reflect real
instabilities in the solar rotation.
at
the equatorial
zone is connected with the absence of activity in this region.
These values may be considered as an estimation of the accuracy of
the method. However, at the same time they may also reflect real
instabilities in the solar rotation.
In Paper I we have studied the observational characteristics
of the bright and dark emission
regions in the radio range. Here we compare the rotation rates of
bright and dark regions. We find that in the equatorial zone the
rotation rate of bright regions is slightly higher
than that of the dark ones.
At middle latitudes the rotation rate of the bright regions is
somewhat slower than that of the dark ones.
The rotation rate for the bright regions can be
approximated by the following expansion:
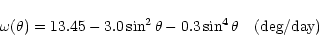
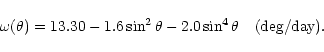
Figure 3 shows the monthly averages of the equatorial zone
(
![]() )
rotation velocity for 1992-2001.
A gradual decrease of the rotation rate from 13.5 deg/day in 1992
to 13.2 deg/day in 1999 is clearly seen. The rotation rate
slowed down by more than
)
rotation velocity for 1992-2001.
A gradual decrease of the rotation rate from 13.5 deg/day in 1992
to 13.2 deg/day in 1999 is clearly seen. The rotation rate
slowed down by more than ![]() between the minimum solar activity in 1996
and 1999. After this there was a rapid increase from 13.2 deg/day
to 13.5 deg/day during the next two years.
In 2001 the equatorial rotation rate reached the same value as
in 1992. It is worth mentioning that in 2001 we observed the end of the
polar magnetic field reversal on the Sun (Makarov & Tlatov 2001). At present we do
not know if there is a connection between these processes.
between the minimum solar activity in 1996
and 1999. After this there was a rapid increase from 13.2 deg/day
to 13.5 deg/day during the next two years.
In 2001 the equatorial rotation rate reached the same value as
in 1992. It is worth mentioning that in 2001 we observed the end of the
polar magnetic field reversal on the Sun (Makarov & Tlatov 2001). At present we do
not know if there is a connection between these processes.
A slightly different pattern of the variation of the rotation rate
is seen in Fig. 4 for the latitudes
![]() .
A minimum rotation rate of about 13.25 deg/day was observed in 1997
(it is the minimum
sunspot activity!) in the Northern hemisphere latitude zone.
In the South the minimum rotation rate was observed
one year later, in 1998 (it is near minimum sunspot activity too).
.
A minimum rotation rate of about 13.25 deg/day was observed in 1997
(it is the minimum
sunspot activity!) in the Northern hemisphere latitude zone.
In the South the minimum rotation rate was observed
one year later, in 1998 (it is near minimum sunspot activity too).
From this analysis we conclude that the solar rotation rate in equatorial
and low latitude zones shows clear variations, up to about ![]() ,
during the
solar cycle.
,
during the
solar cycle.
In the previous section we studied the cycle dependence of the rotation
rate of the equatorial and the low latitude
zones. Here we investigate the variation as a function of latitude and time,
corrected for the average rotation.
We can define a net pattern as the difference between the actual
observed rotation and the smoothed average rotation
determined for each latitude zone. The net pattern thus shows the
time-varying component of the
rotation. In Fig. 5 we see bands of
faster than average rotation moving towards the equator,
which start at high latitudes during the cycle maximum and reach
the equator during the
cycle minimum. Slower than average rotation bands
are found at latitude
![]() near the minimum activity in 1993-1994 and reach the equator
during the maximum activity in 2000-2001.
near the minimum activity in 1993-1994 and reach the equator
during the maximum activity in 2000-2001.
The results of our analysis based on specially developed methods of
treating Nobeyama radio
maps of the Sun demonstrate the possibility of studying
the solar rotation as a
function of the heliographic latitude at different altitudes in the
atmosphere as compared with Doppler and magnetogram data. The behaviour
of the obtained time variations of the rotation rate refers probably
to the middle and upper
chromosphere,
including some input from low coronal structures.
Therefore it is very important to compare the radio net pattern with
the photosphere one. We plan to investigate this more quantitatively in the
near future.
The accuracy, of the order
of 0.1-![]() ,
appears to be high enough to study not only the angular rate
,
appears to be high enough to study not only the angular rate ![]() of the solar atmosphere at chromospheric altitudes as a
function of the heliographic latitude
of the solar atmosphere at chromospheric altitudes as a
function of the heliographic latitude ![]() (see Fig. 1), but also the
variation of this function
with time, e.g. its dependence on the phase of the solar activity.
Strong temporal variations of the rotation rate in two latitude zones
are illustrated in Figs. 3 and 4.
The general development of the excess and the deficit in rotation rate, as
compared with the mean
values for the heliographic latitudes, is illustrated in Fig. 5 for
the period of 1992-2001.
(see Fig. 1), but also the
variation of this function
with time, e.g. its dependence on the phase of the solar activity.
Strong temporal variations of the rotation rate in two latitude zones
are illustrated in Figs. 3 and 4.
The general development of the excess and the deficit in rotation rate, as
compared with the mean
values for the heliographic latitudes, is illustrated in Fig. 5 for
the period of 1992-2001.
The main tendency observed is a drift of the rate deficit from the
pole to the equator
with a characteristic time comparable to the 11-year solar cycle
(or a bit longer). The
amplitude of this drift is about 0.02 deg/day, or ![]() of
of ![]() .
An extrapolation to
the previous maximum of solar activity (near 1990-1991) and the situation
at the current
maximum (2000-2001) both show that at the solar maximum we have a maximal
local deficit in the
angular velocity near the poles as well as at the equator. This may be
considered to be a result
of the 11-year drift of a kind of a wave from the pole to the equator
during the 23rd cycle. The existence of such waves is an important
feature of the solar activity cycle and should be
taken into account
while developing its theory.
.
An extrapolation to
the previous maximum of solar activity (near 1990-1991) and the situation
at the current
maximum (2000-2001) both show that at the solar maximum we have a maximal
local deficit in the
angular velocity near the poles as well as at the equator. This may be
considered to be a result
of the 11-year drift of a kind of a wave from the pole to the equator
during the 23rd cycle. The existence of such waves is an important
feature of the solar activity cycle and should be
taken into account
while developing its theory.
Earlier optical observations, both of Doppler effects (Howard & LaBonte 1980) and of magnetograms (Snodgrass H. B. 1991; Komm et al. 1993) have shown similar periodic variations in the global rotation of the Sun. This effect has been called torsional oscillations. Our results present a new advance in the study of torsional oscillations:
1. They confirm the existence of this weak and difficult to analyse effect by a completely independent method of observations.
2. They enable the study of the phenomenon at the level of the chromosphere and the lower corona, in addition to the photospheric level.
3. They are based on an unprecedentedly full set of observations - daily data for nine years with the same instrument.
Future analysis of torsional oscillations based on observations with all possible methods, referring to different levels of the solar atmosphere, is highly desirable in order to proceed in the understanding of their role in the physics of the solar cycle.
An analysis of observed time variations of weak brightness fluctuations over the whole solar disk resulted in detailed rotation data for the Sun and its variations with the phase of the solar activity. We have been able to demonstrate a new and accurate way of studying the global effects of different types of magnetic solar activity. In most cases we confirmed the previous results, however using more homogeneous and regular observations.
The main limitation of the Nobeyama data is the absence of spectral information. For some problems of the physical interpretation of the radio observations (diagnostics of the plasma parameters, radio tomography of the solar active regions) one dimensional observations with the radio telescope RATAN-600 can be used (see e.g. Grebinskij et al. 2000; Gelfreikh 1998). Nevertheless, we suggest that an instrument, combining high resolution two dimensional mapping of the Sun at many frequencies, sensitive to polarization, and devoted to regular monitoring of the Sun, would enable a significant breakthrough in solving the problem of the nature of the solar cycle activity.
Acknowledgements
This work was partially supported by the grants: RFBR 99-02-16171, 99-02-16200, 00-02-16355, and the National Russian Program "Astronomy'' 1.5.4.6. We thank E. Valtaoja for comments on the paper.