A&A 389, 115-125 (2002)
DOI: 10.1051/0004-6361:20020576
D. Dallacasa 1,2 - S. Tinti 1,2,![]() - C. Fanti
3,2 - R. Fanti 3,2 - L. Gregorini 3,2 -
C. Stanghellini 4 - M. Vigotti 2
- C. Fanti
3,2 - R. Fanti 3,2 - L. Gregorini 3,2 -
C. Stanghellini 4 - M. Vigotti 2
1 - Dipartimento di Astronomia, Universitá di Bologna, Via Ranzani 1, 40127 Bologna, Italy
2 - Istituto di Radioastronomia del CNR, via Gobetti 101, 40129 Bologna, Italy
3 - Dipartimento di Fisica, Universitá di Bologna, via Irnerio 46, 40126 Bologna, Italy
4 - Istituto di Radioastronomia del CNR, CP 141, 96017 Noto SR, Italy
Received 22 January 2002 / Accepted 11 April 2002
Abstract
VLBA observations at 18 cm are presented for 28 Compact Steep-spectrum
radio Sources (CSSs) from the B3-VLA CSS sample.
These sources were unresolved in previous VLA observations at high
frequencies or their brightness distribution was dominated by an unresolved
steep spectrum component. More than half of them also showed a low frequency
turnover in their radio spectrum.
The VLBA images display in most cases a compact symmetric structure. Only in a
minority of cases complex morphologies are present.
Key words: galaxies: active - radio continuum: galaxies - quasars: general
Starting from the seminal paper by Baldwin 1982, models for radio source evolution have been presented by several authors which link the CSS/GPS population to the larger size sources, (see e.g. Begelman 1996; Kaiser & Alexander 1997).
All models essentially predict a decrease of the source luminosity with
time, and therefore with increasing source linear size.
A key test for the models is the ability to reproduce the distribution of
sources in the "Radio Power - Linear Size" (
![]() )
plane
(Baldwin 1982).
CSSs/GPSs seem to be in
the right proportion as compared with model expectations (Fanti et al.
1995;
Readhead et al. 1996). However, from the samples studied so far
the statistics have been not very large and
suspicions were raised on some "irregularities" in the LS
distribution (O'Dea & Baum 1997) and on the, perhaps too high,
number of very small size CSSs, the GPSs (Polatidis et al. 1999;
Fanti & Fanti 2001).
)
plane
(Baldwin 1982).
CSSs/GPSs seem to be in
the right proportion as compared with model expectations (Fanti et al.
1995;
Readhead et al. 1996). However, from the samples studied so far
the statistics have been not very large and
suspicions were raised on some "irregularities" in the LS
distribution (O'Dea & Baum 1997) and on the, perhaps too high,
number of very small size CSSs, the GPSs (Polatidis et al. 1999;
Fanti & Fanti 2001).
Recently we have selected a new sample of CSSs from the B3-VLA catalogue
(Vigotti et al. 1989)
aimed at increasing significantly the statistics on sources with LS in
the range
![]() (kpc)
(kpc)
![]() (Fanti et al. 2001, hereafter referred to as Paper I). This sample,
consisting of 87 CSSs (
(Fanti et al. 2001, hereafter referred to as Paper I). This sample,
consisting of 87 CSSs (
![]() kpc), has VLA
observations at 1.4 GHz
(A and C configurations), 5 and 8.4 GHz (both A configuration).
About 50% of these sources were not resolved or were poorly resolved
even at 8.4 GHz
(beam size
kpc), has VLA
observations at 1.4 GHz
(A and C configurations), 5 and 8.4 GHz (both A configuration).
About 50% of these sources were not resolved or were poorly resolved
even at 8.4 GHz
(beam size ![]() 0.2
0.2![]() ). For them two VLBI observing
projects were undertaken with the VLBA and EVN & MERLIN.
). For them two VLBI observing
projects were undertaken with the VLBA and EVN & MERLIN.
This paper reports on the results of the VLBA observations of the most compact sources. The EVN & MERLIN observations instead are presented in a companion paper by Dallacasa et al. (2002, Paper III).
| Source | Id | mR | z | LAS | Log
|
|
|
|
LLS | Morph. |
| mas | W/Hz h-2 | mJy | mJy | mas | kpc h-1 | |||||
| (1) | (2) | (3) | (4) | (5) | (6) | (7) | (8) | (9) | (10) | (11) |
| 0039+373 | G | 1.006 | 100 | 27.37 | 784 | 779 | 120 | 0.50 | CSO | |
| 0147+400 | E | 100 | >26.6 | 631 | 563 | 95 | scJ? |
|||
| 0703+468 | E | 80 | >26.6 | 1392 | 1356 | 75 | CSO | |||
| 0800+472 |
E | 1000 | >26.8 | 769 | 447 | 160 | scJ? |
|||
| 0809+404 |
G | 0.551 | 1200 | 26.90 | 929 | 522 | 80 | 0.28 | ? | |
| 0822+394 | G | 1.180 | 50 | 27.33 | 1003 | 942 | 70 | 0.30 | CSO | |
| 0840+424A | E | 80 | >26.8 | 1243 | 1187 | 135 | CSO | |||
| 1007+422 |
E | 130 | >26.4 | 370 | 313 | 265 | MSO | |||
| 1008+423 | E | 50 | >26.5 | 521 | 498 | 115 | CSO | |||
| 1016+443 | G | 19.7 | 0.33 R | 110 | 26.11 | 287 | 266 | 155 | 0.44 | CSO |
| 1044+454 |
G | 24.8 | 4.10 K | 1000 | 28.82 | 352 | 311 | 175 | 0.55 | ? |
| 1049+384 |
G | 20.9 | 1.018 | 100 | 27.14 | 574 | 502 | 210 | 0.89 | CSO? |
| 1133+432 | E | 70 | >26.3 | 1247 | 1265 | 45 | CSO | |||
| 1136+383 |
E | 50 | >26.4 | 400 | 377 | 70 | CSO | |||
| 1136+420 | G | 21.7 | 0.829 | 1000 | a 26.9 | 402 | 279 | 120 | 0.49 | ? |
| 1159+395 | G | 23.4 | 2.370 | 50 | 27.57 | 535 | 498 | 70 | 0.26 | CSO |
| 1225+442 | G | 18.2 | 0.22 R | 200 | 27.50 | 316 | 291 | 420 | 0.95 | CSO |
| 1242+410 | Q | 19.7 | 0.811 | 40 | 27.08 | 1215 | 1126 | 70 | 0.29 | CSO? |
| 1314+453A |
G | 21.8 | 1.544 | 160 | 27.77 | 574 | 493 | 185 | 0.79 | CSO |
| 1340+439 | E | 70 | >26.5 | 447 | 397 | 130 | CSO | |||
| 1343+386 |
Q | 17.5 | 1.844 | 110 | 27.70 | 793 | 717 | 130 | 0.54 | CSO |
| 1432+428B |
E | 40 | >26.3 | 809 | 706 | 50 | CSO | |||
| 1441+409 | E | 100 | >26.7 | 834 | 768 | 130 | CSO | |||
| 1449+421 | E | 80 | >26.9 | 639 | 592 | 120 | CSO | |||
| 2304+377 | G | 19.7 | 0.40 R | 100 | 26.44 | 1299 | 1217 | 150 | 0.49 | CSO |
| 2330+402 | E | 70 | >26.7 | 730 | 705 | 100 | CSO | |||
| 2348+450 |
G | 0.978 | 200 | 27.36 | 630 | 520 | 310 | 1.32 | MSO | |
| 2358+406 | E | 80 | >26.8 | 1159 | 1161 | 120 | CSO |
|
a The value given in Fanti et al. (2001) is wrong.
|
![\begin{figure}
\par\includegraphics[width=8.8cm,clip]{h3442f1.ps}\end{figure}](/articles/aa/full/2002/25/aah3442/Timg13.gif) |
Figure 1: Typical uv coverage. |
| Open with DEXTER | |
Among the twenty-eight sources selected for VLBA
observations, twenty-four are unresolved or slightly resolved
(angular size ![]() 0.2
0.2![]() )
in the VLA 8.4 GHz observations.
The remaining four sources are dominated in flux density by an
unresolved or slightly resolved component, with the additional
presence of some weaker emission (bringing the overall size up to
)
in the VLA 8.4 GHz observations.
The remaining four sources are dominated in flux density by an
unresolved or slightly resolved component, with the additional
presence of some weaker emission (bringing the overall size up to
![]() 1
1![]() ,
Table 1) whose connection with the compact feature is unclear.
In addition about half of the sample sources present a low frequency turnover
in the total spectrum which is usually considered an indication
of compactness in some sub-component. All these sources, therefore,
deserved further investigation.
,
Table 1) whose connection with the compact feature is unclear.
In addition about half of the sample sources present a low frequency turnover
in the total spectrum which is usually considered an indication
of compactness in some sub-component. All these sources, therefore,
deserved further investigation.
The selected sample is presented in Table 1. The content of the table is the following.
Column 1: Source name; an "
Column 2: Optical Identification (Id) from Paper I (G = galaxy, Q = quasar, E = no known optical counterpart);
Column 3: R magnitude;
Column 4: redshift; "K'' and "R'' indicate that the redshift is estimated by photometric measurements in the respective optical band (see Paper I for details);
Column 5: VLA Largest Angular Size (LAS) in mas, from Paper I;
Column 6: log
Column 7: flux density (mJy), interpolated at 1.67 GHz from the 1.4 GHz NVSS (Condon et al. 1998) and the 5 GHz VLA data from Paper I;
Column 8: VLBA 1.67 GHz flux density (mJy), measured on the images presented here (see Sect. 3);
Column 9: VLBA Largest Angular Size (mas);
Column 10: Largest Linear Size (LLS, kpc h-1) from VLBA data; for E sources z = 1.05 was assumed (see Paper I for details) and LLS, given with a leading "
Column 11: overall morphology (see Sect. 5).
The VLBA observations were carried out in February 2000 at the frequency of 1.67 GHz, with a recording band-width of 32 MHz at 64 Mbps. Each source was observed for a total of about 1 hour, spread into 10 to 15 short scans in order to improve the uvcoverage. A typical example of uv coverage is given in Fig. 1. As no single VLA antenna was available, the shortest baseline is Pie Town-Los Alamos (
| Source | S | (PA) | Source | S | (PA) | ||||||
| (mJy) | mas | mas | deg | (mJy) | mas | mas | deg | ||||
| (1) | (2) | (3) | - | (4) | - | (1) | (2) | (3) | - | (4) | - |
| 0039+373 | N1 | 229 | 4.7 | 4.3 | 101 | 1225+442 | E1 | 138 | 26.6 | 15.1 | 88 |
| N2 | 143 | 11.0 | 6.8 | 17 | E |
28 | |||||
| N |
17 | W1 | 94 | 46.6 | 23.3 | 71 | |||||
| S1 | 303 | 13.2 | 6.9 | 24 | W2 | 35 | 32.4 | 10.6 | 134 | ||
| S |
88 | 1242+410 | S | 818 | 20.8 | 5.1 | 26 | ||||
| 0147+400 | E | 208 | 2.7 | 2.4 | 41 | N | 208 | 7.7 | 4.8 | 53 | |
| W1 | 134 | 11.6 | 7.6 | 40 | 101 | ||||||
| W2 | 109 | 13.7 | 10.6 | 26 | 1314+453 | W1 | 175 | 26.7 | 15.6 | 71 | |
| 113 | W2 | 77 | 31.6 | 26.9 | 73 | ||||||
| 0703+468 | W1 | 794 | 7.1 | 4.01 | 51 | Ce | 60 | 19.0 | 15.0 | 143 | |
| W |
22 | E1 | 101 | 28.0 | 14.6 | 63 | |||||
| E1 | 497 | 5.7 | 4.0 | 80 | E2 | 76 | 41.4 | 10.2 | 65 | ||
| E |
44 | NW | 18 | 25.0 | 8.9 | 82 | |||||
| 0800+472 | S1 | 177 | 25.5 | 9.4 | 49 | 1340+439 | N1 | 208 | 9.0 | 5.2 | 9 |
| S2 | 95 | 32.4 | 6.9 | 70 | N2 | 104 | 13.9 | 5.8 | 44 | ||
| N1 | 120 | 36.5 | 19.2 | 34 | Ce1 | 38 | 10.3 | 1.5 | 26 | ||
| N2 | 68 | 25.6 | 22.9 | 60 | Ce2 | 13 | 7.2 | 2.2 | 4 | ||
| N3 | 24 | 18.8 | 11.3 | 178 | S | 27 | 12.0 | 6.6 | 83 | ||
0809+404 |
N | 250 | 16.1 | 12.2 | 161 | 1343+386 | S1 | 541 | 6.2 | 5.9 | 131 |
| S | 221 | 17.5 | 12.2 | 161 | S |
68 | |||||
| 51 | Ce | 20 | 12.8 | 4.5 | 170 | ||||||
| 0822+394 | E1 | 424 | 5.3 | 3.5 | 37 | N | 66 | 3.5 | 0.6 | 171 | |
| E2 | 269 | 16.4 | 3.3 | 57 | N |
20 | |||||
| W1 | 153 | 6.7 | 4.5 | 66 | 1432+428 | E1 | 570 | 4.9 | 3.0 | 106 | |
| W2 | 97 | 6.4 | 3.7 | 81 | E |
25 | |||||
0840+424 |
N1 | 823 | 8.2 | 4.8 | 10 | W | 104 | 11.4 | 7.5 | 133 | |
| N2 | 145 | 12.5 | 4.5 | 169 | 1441+409 | W1 | 312 | 6.7 | 4.2 | 50 | |
| S1 | 71 | 7.1 | 5.7 | 50 | W2 | 132 | 17.1 | 8.0 | 43 | ||
| S2 | 137 | 16.8 | 11.6 | 139 | Ce1 | 140 | 7.6 | 3.0 | 63 | ||
1007+422 |
S1 | 238 | 32.9 | 15.8 | 84 | Ce2 | 42 | <3.5 | <3.5 | -180 | |
| S2 | 52 | 22.4 | 8.7 | 40 | E1 | 70 | 8.0 | 3.1 | 176 | ||
| N | 32 | 40.0 | 23.5 | 153 | E2 | 68 | 17.2 | 7.3 | 30 | ||
1008+423 |
W1 | 139 | 12.3 | 4.4 | 128 | 1449+421 | N1 | 121 | 12.04 | 7.0 | 96 |
| W2 | 250 | 12.0 | 5.3 | 35 | N2 | 149 | 5.2 | 2.7 | 26 | ||
| W |
14 | N3 | 87 | 8.09 | 4.1 | 4 | |||||
| Ce | 14 | 12.2 | 5.2 | 54 | Ce1 | 15 | 8.5 | 2.6 | 24 | ||
| E | 104 | 27.8 | 19.4 | 46 | Ce2 | 58 | 5.8 | 3.4 | 31 | ||
1016+443 |
N1 | 109 | 8.1 | 5.5 | 156 | Ce3 | 44 | 8.9 | 2.1 | 27 | |
| N2 | 67 | 15.1 | 3.5 | 175 | S | 120 | 11.0 | 8.2 | 60 | ||
| N3 | 6 | 15.9 | 1.6 | 166 | 2304+377 | W1 | 244 | 4.8 | 0.2 | 89 | |
| S1 | 27 | 15.1 | 7.7 | 155 | W2 | 671 | 21.0 | 6.6 | 117 | ||
| S2 | 58 | 18.9 | 7.2 | 5 | W3 | 91 | 7.1 | 2.3 | 104 | ||
1044+454 |
E1 | 124 | 8.3 | 3.8 | 106 | E1 | 219 | 4.0 | 3.3 | 114 | |
| E2 | 138 | 19.9 | 17.1 | 110 | E2 | 41 | 9.0 | 5.6 | 67 | ||
| E |
18 | E3 | 124 | 28.0 | 17.8 | 110 | |||||
| W1 | 24 | 7.3 | 4.4 | 6 | 2330+402 | W1 | 332 | 2.4 | 1.8 | 33 | |
| W2 | 7 | 10.6 | 1.7 | 177 | W |
37 | |||||
1049+384 |
W1 | 244 | 7.0 | 4.1 | 8 | E1 | 62 | 7.0 | 4.8 | 152 | |
| W2 | 206 | 8.7 | 2.5 | 119 | E2 | 204 | 17.5 | 12.9 | 164 | ||
| E1 | 21 | <5.5 | <5.5 | -179 | E |
70 | |||||
| E2 | 26 | 5.4 | 3.6 | 133 | 2348+450 | S1 | 203 | 5.1 | 4.1 | 159 | |
1133+432 |
N | 799 | 3.5 | 2.9 | 48 | S |
168 | ||||
| S | 460 | 4.1 | 3.6 | 167 | N1 | 75 | 19.9 | 14.4 | 93 | ||
| 1136+383 | N1 | 134 | 5.2 | 3.0 | 170 | N |
74 | ||||
| N2 | 93 | 10.1 | 4.1 | 10 | 2358+406 | S1 | 681 | 5.6 | 3.9 | 143 | |
| Ce | 23 | 8.2 | 3.2 | 170 | S |
158 | |||||
| S | 125 | 5.8 | 5.1 | 3 | Ce | 71 | 9.3 | 1.0 | 156 | ||
1136+420 |
T | 292 | 52.2 | 31.1 | 103 | N1 | 95 | 8.8 | 4.3 | 3 | |
| 1159+395 | N1 | 198 | 5.2 | 3.3 | 179 | N2 | 213 | 15.1 | 6.1 | 123 | |
| N2 | 130 | 21.3 | 9.4 | 167 | |||||||
| S1 | 165 | 6.7 | 4.8 | 141 |
![\begin{figure}
\par\includegraphics[width=8.7cm,clip]{h3442f2a.ps}\hspace*{4mm}
\includegraphics[width=8.5cm,clip]{h3442f2b.ps}\end{figure}](/articles/aa/full/2002/25/aah3442/Timg21.gif) |
Figure 2: (left): comparison between the VLBA integrated flux densities and total flux densities interpolated from the literature. The line has a slope of one. (right): ratio between the VLBA and the total flux density is shown as a function of the overall source angular size. |
| Open with DEXTER | |
The data were correlated with the NRAO processor at Socorro. Amplitude calibration was obtained using the system temperature measured at the various antennas during the observations and the gain information provided by NRAO. Consistency checks were performed with OQ208 and DA193, whose amplitudes were found to be generally within 2% of what expected.
Standard editing and fringe-fitting were applied. Most sources provided fringes with high signal-to-noise ratio on all baselines.
Radio images were obtained using AIPS, after a number of phase
self-calibrations, ended by a final amplitude self-calibration. The
last step was made with great care, as the gain self-calibration
tends to depress the total flux density when extended components are
poorly sampled in uv coverage. Generally the gain corrections from
self-calibration were <3%. In those sources in which they
were ![]() 3%, or in which the total flux density decreased by more
than 1-2%, they were not considered.
3%, or in which the total flux density decreased by more
than 1-2%, they were not considered.
The rms noise level (1 ![]() ), measured on the images far from the
sources, is in the range of 0.1-0.2 mJy/beam, comparable to the
expected thermal noise. The dynamic range, defined as the ratio of
peak brightness to 1
), measured on the images far from the
sources, is in the range of 0.1-0.2 mJy/beam, comparable to the
expected thermal noise. The dynamic range, defined as the ratio of
peak brightness to 1 ![]() ,
is
,
is ![]() 700 on average, ranging from
300 to a few thousands. The typical resolution is
700 on average, ranging from
300 to a few thousands. The typical resolution is ![]()
![]() mas. We must remark that the LAS determined on the VLBA images
(Table 1, Col. 9) does not take into account the eventual presence
of components completely resolved out by the VLBA observations. We
note also that it may exceed the VLA rough estimate due to the
source structure (e.g. a double edge-brightened source will appear
smaller when fitted by a single Gaussian with a resolution smaller
than the separation between components).
mas. We must remark that the LAS determined on the VLBA images
(Table 1, Col. 9) does not take into account the eventual presence
of components completely resolved out by the VLBA observations. We
note also that it may exceed the VLA rough estimate due to the
source structure (e.g. a double edge-brightened source will appear
smaller when fitted by a single Gaussian with a resolution smaller
than the separation between components).
The total flux density "seen'' by VLBA (Table 1, Col. 8) has been measured by integration over the source images using the AIPS task TVSTAT. The brightest sub-structures of each source were fitted by a Gaussian model (task JMFIT) which allows to obtain total flux density, the beam-deconvolved Half Maximum Widths (HMW) and major axis position angle (PA). Sub-components are referred to as North (N), South (S), East (E), West (W) and Central (Ce). When a component is split into more pieces, a digit (1, 2, etc.) is added (e.g. N1, N2). Other symbols used are self-explanatory. The source images are shown in Fig. 3. The labels are marked on the images, next to each sub-component. The parameters of the brightest sub-components are given in Table 2, which has the following layout:
Columns 1, 2: Source name and sub-component label; an "
Column 3: VLBA flux density;
Column 4: deconvolved angular sizes of major and minor axis of a Gaussian component and position angle of the major axis as estimated using the AIPS Gaussian-fitting task JMFIT.
For more extended features, marked by an "
We have checked the integrated flux densities in our images with the low resolution flux densities obtained by interpolating to our observing frequency the values from the NVSS (Condon et al. 1998) and from the VLA data at 5 GHz from Paper I. The comparison is displayed in Fig. 2.
There is clearly a systematic flux density difference, typically
![]() 5%, which could be partially ascribed to calibration
uncertainties.
For the more extended objects there are larger flux density losses,
clearly due to the absence of short uv-spacings (see, as an
example, Fig. 4).
The two sources with the largest deviations in
Fig. 2 (0800+472 and 0809+404) do possess indeed another
component detected by the VLA but completely resolved out by the VLBA
baselines (see also next section).
5%, which could be partially ascribed to calibration
uncertainties.
For the more extended objects there are larger flux density losses,
clearly due to the absence of short uv-spacings (see, as an
example, Fig. 4).
The two sources with the largest deviations in
Fig. 2 (0800+472 and 0809+404) do possess indeed another
component detected by the VLA but completely resolved out by the VLBA
baselines (see also next section).
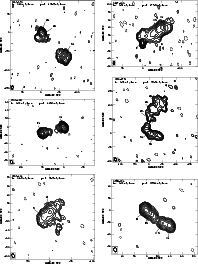 |
Figure 3: VLBA images: the first contour (f.c) is generally three times the rms noise level on the image; contour levels increase by a factor of 2; the restoring beam is shown in the bottom left corner in each image. |
| Open with DEXTER | |
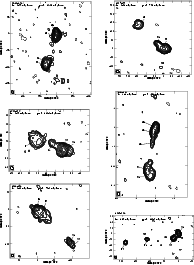 |
Figure 3: continued. |
| Open with DEXTER | |
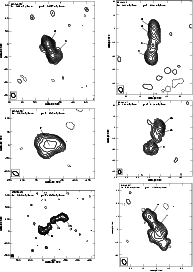 |
Figure 3: continued. |
| Open with DEXTER | |
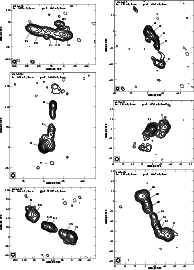 |
Figure 3: continued. |
| Open with DEXTER | |
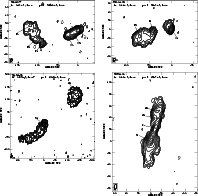 |
Figure 3: continued. |
| Open with DEXTER | |
- 0809+404: at arcsec scale the source appears as a very asymmetric double, with 1.2
- 1007+422: about 15% of total flux density is missing in our VLBA observations.
- 1044+454: on the arcsec scale the source appears as a very asymmetric double, with flux density ratio
- 1049+384: About 12% of the total flux density is missing in our VLBA observations.
- 1136+420: on the arcsec scale the source appears as a very asymmetric double, with flux density ratio
- 1314+453: about 15% of the total flux density is missing in the VLBA image.
- 1343+386: a weak feature, accounting for
![\begin{figure}
\par\includegraphics[width=8.8cm,clip]{h3442f4.ps}\end{figure}](/articles/aa/full/2002/25/aah3442/Timg33.gif) |
Figure 4: Plot of the correlated flux density versus projected baseline for the source B3 1314+453. The horizontal arrows indicate the integrated flux density in the VLBA image and total flux density from the VLA as given in Table 1. |
| Open with DEXTER | |
- 1432+428: a weak feature, accounting for
- 2348+450: about 20% of total flux density is missing in the VLBA image.
The present observations do not allow to pick up the radio core, due to the relatively low observing frequency, but the overall morphology strongly indicates that the sources are mostly two-sided. We see either well separated lobes or lobes connected by bridges, possibly jets. Most sources are edge brightened, suggesting the presence of hot spots, in general not fully resolved from the mini-lobe emission, which contribute most of the source flux density. We tentatively classify these sources as CSOs (two of them are actually MSOs). There are also a few objects with edge darkening, as B3 2304+377, B3 2348+450 and B3 2358+406. There are a number of sources where a compact component, centrally located, could be the source core. However, having only one relatively low frequency we are not in the position to make a definitive statement about core identifications.
Some asymmetries in the flux densities of the two sides are seen, as also some moderate distortions. B3 0800+472 and B3 2304+377 are extreme examples. The sources B3 1225+442 and B3 1449+421 are reminiscent of an S morphology (see also Stanghellini et al. 2001).
The average ratio between the component size transverse to the source
axis (
![]() )
and Largest Angular Size (LAS) is
)
and Largest Angular Size (LAS) is
![]() ,
consistent with findings
in other source samples (e.g. Fanti et al. 1990).
,
consistent with findings
in other source samples (e.g. Fanti et al. 1990).
We have computed the equipartition parameters for the source
components, under the following assumptions: a) proton to electron energy
ratio of one; b) filling factor of one; c) maximum and minimum
electron (and proton) energies corresponding to synchrotron emission
in the frequency range 100 GHz to 10 MHz; d) ellipsoidal volumes with
axis corresponding to the observed ones. We also computed the
brightness temperatures (![]() )
of each component.
In order to make easier the reading of the paper, we do not report the
individual component values, since they can be obtained from the
parameters in Table 2, but only mention the typical
values.
)
of each component.
In order to make easier the reading of the paper, we do not report the
individual component values, since they can be obtained from the
parameters in Table 2, but only mention the typical
values.
The magnetic fields are in the range of several mGauss, going up to
![]() 20 mGauss in the most compact components
(e.g. B3 1133+432). Brightness temperatures range from
20 mGauss in the most compact components
(e.g. B3 1133+432). Brightness temperatures range from ![]() 108 up
to
108 up
to ![]() 1011 K.
1011 K.
The large majority of sources have a "double type'' structure, with
sizes ranging from ![]() 200 h-1 pc to
200 h-1 pc to ![]() 1 h-1 kpc.
Together with the VLA data on the large size sources and with EVN &
MERLIN data, presented in Dallacasa et al. (2002, Paper III)
on intermediate size sources, we have at the end a new determination
of the Linear Size distribution in the range
1 h-1 kpc.
Together with the VLA data on the large size sources and with EVN &
MERLIN data, presented in Dallacasa et al. (2002, Paper III)
on intermediate size sources, we have at the end a new determination
of the Linear Size distribution in the range ![]() 0.2
h-1 <
LS (kpc) <20 h-1. This is an important piece of information
to test the source evolution model. We will discuss it in a separate
paper.
0.2
h-1 <
LS (kpc) <20 h-1. This is an important piece of information
to test the source evolution model. We will discuss it in a separate
paper.
The sources presented here have just been observed with the VLBA at higher frequencies, with the aim of detecting the radio core, therefore obtaining an unambiguous classification, and of studying the structure of the hot spots. The results will be presented in a forthcoming paper.
Acknowledgements
This work has been partially supported by the Italian MURST under grant COFIN-2001-02-8773. The VLBA is operated by the U.S. National Radio Astronomy Observatory which is a facility of the National Science Foundation operated under a cooperative agreement by Associated Universities, Inc.