Observation of periodic variable stars towards the Galactic spiral arms by EROS II![[*]](/icons/foot_motif.gif) ,
,
F. Derue1,2, -
J.-B. Marquette3 -
S. Lupone3 -
C. Afonso2,4, -
C. Alard5 -
J.-N. Albert1 -
A. Amadon2 -
J. Andersen6 -
R. Ansari1 -
É. Aubourg2 -
P. Bareyre2,4 -
F. Bauer2 -
J.-P. Beaulieu3 -
G. Blanc2, -
A. Bouquet4 -
S. Char7, -
X. Charlot2 -
F. Couchot1 -
C. Coutures2 -
R. Ferlet3 -
P. Fouqué8,9 -
J.-F. Glicenstein2 -
B. Goldman2,4,
-
A. Gould4,10 -
D. Graff2,11 -
M. Gros2 -
J. Haïssinski1 -
J.-C. Hamilton4, -
D. Hardin2, -
J. de Kat2 -
A. Kim4,
-
T. Lasserre2 -
L. Le Guillou2 -
É. Lesquoy2,3 -
C. Loup3 -
C. Magneville 2 -
B. Mansoux1 -
É. Maurice1,2 -
A. Milsztajn 2 -
M. Moniez1 -
N. Palanque-Delabrouille2 -
O. Perdereau1 -
L. Prévot1,2 -
N. Regnault1,
-
J. Rich2 -
M. Spiro2 -
A. Vidal-Madjar3 -
L. Vigroux2 -
S. Zylberajch2 - The EROS collaboration
1 - Laboratoire de l'Accélérateur Linéaire,
IN2P3-CNRS-Université de Paris-Sud, BP 34, 91898 Orsay Cedex, France
2 -
CEA, DSM, DAPNIA,
Centre d'Études de Saclay, 91191 Gif-sur-Yvette Cedex, France
3 -
Institut d'Astrophysique de Paris, INSU-CNRS,
98bis boulevard Arago, 75014 Paris, France
4 -
Collège de France, LPCC, IN2P3-CNRS,
11 place Marcelin Berthelot, 75231 Paris Cedex, France
5 -
DASGAL, INSU-CNRS, 77 avenue de l'Observatoire, 75014 Paris, France
6 -
Astronomical Observatory, Copenhagen University, Juliane Maries Vej 30,
2100 Copenhagen, Denmark
7 -
Universidad de la Serena, Facultad de Ciencias, Departamento de Fisica,
Casilla 554, La Serena, Chile
8 -
Observatoire de Paris, DESPA, 92195 Meudon Cedex, France
9 -
European Southern Observatory (ESO), Casilla 19001, Santiago 19, Chile
10 -
Ohio State University, Department of Astronomy, Columbus, OH 43210, USA
11 -
University of Michigan, Department of Astronomy, Ann Arbor, MI48109, USA
12 -
Observatoire de Marseille, INSU-CNRS,
2 place Le Verrier, 13248 Marseille Cedex 04, France
Received 26 September 2001 / Accepted 11 April 2002
Abstract
We present the results of a massive variability search
based on a photometric survey of a six square degree region along the Galactic
plane at (
 ,
,
 )
and (
)
and (
 ,
,
 ).
This survey was performed in the framework of the EROS II
(Expérience de Recherche d'Objets Sombres) microlensing program.
The variable stars were found among 1 913 576 stars
that were monitored between April and June 1998 in two passbands,
with an average of 60 measurements.
A new period-search technique is proposed which makes use of
a statistical variable that characterizes the overall regularity
of the flux versus phase diagram.
This method is well suited when the photometric data are
unevenly distributed in time, as is our case.
1362 objects whose luminosity varies were selected.
Among them we identified 9 Cepheids, 19 RR Lyræ, 34 Miras,
176 eclipsing binaries and 266 Semi-Regular stars.
Most of them are newly identified objects.
The cross-identification with known catalogues
has been performed.
The mean distance of the RR Lyræ is estimated to be
).
This survey was performed in the framework of the EROS II
(Expérience de Recherche d'Objets Sombres) microlensing program.
The variable stars were found among 1 913 576 stars
that were monitored between April and June 1998 in two passbands,
with an average of 60 measurements.
A new period-search technique is proposed which makes use of
a statistical variable that characterizes the overall regularity
of the flux versus phase diagram.
This method is well suited when the photometric data are
unevenly distributed in time, as is our case.
1362 objects whose luminosity varies were selected.
Among them we identified 9 Cepheids, 19 RR Lyræ, 34 Miras,
176 eclipsing binaries and 266 Semi-Regular stars.
Most of them are newly identified objects.
The cross-identification with known catalogues
has been performed.
The mean distance of the RR Lyræ is estimated to be

 kpc undergoing an average absorption
of
kpc undergoing an average absorption
of
 mag.
This distance is in good agreement with that of disc stars that contribute
to the microlensing source star population.
Our catalogue and light curves are available electronically
from the CDS, Strasbourg and from our Web site.
mag.
This distance is in good agreement with that of disc stars that contribute
to the microlensing source star population.
Our catalogue and light curves are available electronically
from the CDS, Strasbourg and from our Web site.
Key words: techniques: photometry - stars: variables: general - galaxy: stellar content
1 Introduction
In 1996, the EROS II collaboration started an
observation program towards the Galactic Spiral Arms (GSA)
dedicated to microlensing events.
Since then, four regions of the Galactic plane located at large angles
with respect to the
Galactic Centre are being monitored to disentangle the disc, bar
and halo contributions to the microlensing optical depth.
Seven microlensing event candidates have already been published, based on
three years (1996-98) of observations
(Derue et al. 1999, 2001), (hereafter Papers I and II).
The distance of the source stars used in these papers
to compute the expected optical depths
was deduced from a detailed study of our colour-magnitude diagrams.
It was thus found that the source star population is located
7 kpc away,
undergoing an interstellar extinction A(V) of about 3 mag
(see Mansoux 1997 for more details).
This distance estimate is in rough agreement with the distance
to the spiral arms obtained by Georgelin et al. (1994) and Russeil et al. (1998),
but its uncertainty is limiting
further interpretation of our microlensing optical depth estimates.
It was therefore desirable to seek more information on the
distance distribution of the source stars - whether these
stars belong to the disc or to the spiral arms - and on the
reddening along our observation line of sights.
This led us to perform a dedicated variable star search
between April and June 1998,
on a subset of our Galactic plane fields.
The analysis was restricted to the brightest
stars of this subset.
Among the wide variety of variable stars, periodic ones
are of particular interest.
The properties of Cepheids make them well suited
to trace the Galactic spiral arms.
Their reddening is measurable as well as
their distance via the period-luminosity (PL) relation.
RR Lyræ stars are old stars,
well suited to trace the disc population.
One can infer their mean dereddened magnitude
and their absolute magnitude (Gould & Popowski 1998).
The infrared PL(K) relation for Miras
and Semi-Regular variable stars can be
calibrated using a comparison of DENIS and
EROS LMC giant stars (Cioni et al. 2001).
Finally detached eclipsing binaries also offer the opportunity to measure
their stellar parameters and their distance (Paczynski 1996).
This paper presents the results of this particular campaign that led to
a catalogue containing a large number of new
variable objects in the Galactic plane.
Section 2 gives the basic features of the observational setup,
Sect. 3 gives details on a new algorithm used
to search for periodic variations of the luminosity.
Section 4 describes the catalogue and the cross-identification
process.
In Sect. 5 we use the selected RR Lyræ to
estimate the mean reddening of our fields and we give the distance
distribution of these stars.
2 Experimental setup and observations
The MARLY telescope and its two cameras, the way we carry
out our observations, as well as our data reduction sequence
are described in Paper I and references therein.
The two EROS passbands are non standard.
The so-called EROS-red passband  is centred on
 ,
close to
,
close to  Cousins,
with a full width at half maximum
Cousins,
with a full width at half maximum
 ,
and EROS-visible passband
,
and EROS-visible passband  is centred on
 ,
close to
,
close to  Johnson,
with
Johnson,
with
 .
The EROS II colour magnitude system is defined as follows:
a zero colour star with
.
The EROS II colour magnitude system is defined as follows:
a zero colour star with
 (a main sequence A0 star) will
have its
magnitude numerically equal to its Cousins
(a main sequence A0 star) will
have its
magnitude numerically equal to its Cousins  magnitude
and its
magnitude numerically equal to its Johnson
magnitude.
The colour transformation between the EROS II system (,)
and the standard Johnson-Cousins (,)
system is then:
magnitude
and its
magnitude numerically equal to its Johnson
magnitude.
The colour transformation between the EROS II system (,)
and the standard Johnson-Cousins (,)
system is then:
The colour coefficients are obtained from the study of our passbands
based on Landolt standards and on one of the EROS II LMC
fields observed simultaneously
in B
with the Danish 1.54 m
(at ESO-La Silla) and
with the MARLY.
The zero points are established with tertiary standards
in BVRI taken with the Danish 1.54 m (Regnault 2000).
We have cross-checked our
photometry with the
one of DENIS (Fouqué et al. 2000).
Furthermore, using Eqs. (1),
the mean magnitudes of the LMC red-giant clump stars agree
within 0.1
 with determinations made by Harris & Zaritsky (1999) and
Udalski et al. (1998).
We thus estimate that the precision of the zero points of the
MARLY calibration is
with determinations made by Harris & Zaritsky (1999) and
Udalski et al. (1998).
We thus estimate that the precision of the zero points of the
MARLY calibration is
 .
.
Among the 29 fields of the EROS GSA microlensing program,
the six fields considered here were monitored about once per
night between April and June 1998.
They represent 2 square degrees towards  Mus and
4 towards
Mus and
4 towards  Nor (named after the closest bright star).
Table 1 gives their coordinates,
the number of images
Nor (named after the closest bright star).
Table 1 gives their coordinates,
the number of images  taken in each direction and the
number of analysed light curves
taken in each direction and the
number of analysed light curves
 .
.
![\begin{figure}
\par\includegraphics[width=8.8cm,clip]{ms1945f1.eps}\end{figure}](/articles/aa/full/2002/25/aa1945/Timg43.gif) |
Figure 1:
Average time sampling for the 6 fields monitored
(2 towards
Nor, upper panel, and 4 towards
Mus,
lower panel), in number of measurements per week and per field. |
| Open with DEXTER |
To avoid CCD saturation by the brightest stars (
 ),
by Cepheids or Miras in particular,
we have reduced the exposure time to 15 s instead of
the 120 s used in the microlensing survey.
As a consequence the catalogue is incomplete as far as faint stars
are concerned, but it could be
updated later by using the total set of available GSA images.
Figure 1 shows the average time sampling.
Three gaps can be seen in our data: the first two (around
weeks 119 and 123) were due to bad weather conditions while the
third one (around week 127) corresponds to the
annual maintenance of our setup.
),
by Cepheids or Miras in particular,
we have reduced the exposure time to 15 s instead of
the 120 s used in the microlensing survey.
As a consequence the catalogue is incomplete as far as faint stars
are concerned, but it could be
updated later by using the total set of available GSA images.
Figure 1 shows the average time sampling.
Three gaps can be seen in our data: the first two (around
weeks 119 and 123) were due to bad weather conditions while the
third one (around week 127) corresponds to the
annual maintenance of our setup.
3 Search for periodic stars
Since the EROS photometry is described in detail in Ansari (1996)
only the main features of the PEIDA++ package are summarised below.
For each field, a template image is first constructed using
one exposure of very good quality.
A reference star catalogue is set up with this template
using the CORRFIND star finding algorithm (Palanque-Delabrouille et al. 1998).
For each subsequent image, after geometrical alignment with the template,
each identified star is fitted together with
its neighbours, using a PSF determined on bright isolated
stars and imposing the position from the reference catalogue.
A relative photometric alignment is then performed, assuming that
most stars do not vary.
Photometric errors are computed for each measurement, assuming again
that most stars are stable, and parameterised as a function of star
brightness and image sequence number.
Figure 2 shows the mean point-to-point relative dispersion
of the measured fluxes along the light curves as a function of
and .
The photometric accuracy is 15% at
 ,
and about 2% for the brightest stars.
,
and about 2% for the brightest stars.
![\begin{figure}
\par\includegraphics[width=8.8cm,clip]{ms1945f2.eps}\end{figure}](/articles/aa/full/2002/25/aa1945/Timg46.gif) |
Figure 2:
Average value of the relative frame to frame dispersion
of the luminosity
measurements versus
(upper panel) and
(lower panel), for stars with at least 30 reliable
measurements in each colour.
This dispersion is taken as an estimator of the mean photometric precision.
The superimposed hatched histograms show the EROS
magnitude distribution of monitored stars. |
| Open with DEXTER |
Finally, using the PEIDA++ photometric package,
we reconstruct the light curves of 1 913 576 stars.
Table 2:
Impact of each selection criterion on the data. For each cut,
the number of remaining light curves is given.
| Cut |
Criterion |
|
| |
Total analysed |
1 913 576 |
| 1 |
> 30 |
1 299 690 |
| 2 |
 |
330 089 |
| 3 |
Pre-filtering |
41 545 |
| 4 |
Period search |
2553 |
| 5 |
Aliasing |
2424 |
| 6 |
Visual inspection |
1362 |
Each one of the light curves is subjected to a series of selection criteria
in order to isolate
a small sub-sample on which we will apply the time consuming period search
algorithms.
These analysis cuts are briefly described hereafter
(see Derue 1999 for more details) and their
effect on the data is summarised in Table 2:
- cut 1:
- At least 30 measurements should be available
in both passbands
and the base flux must be positive;
- cut 2:
- The search is restricted to stars whose magnitude is
which corresponds to a photometric
accuracy in
better than 10%.
- cut 3:
- A non specific pre-filter is applied which retains most
variable stars. It selects light curves satisfying one or both
of the following criteria:
- the relative dispersion of the flux measurements is
25% larger than the average one for the set of stars having
the same magnitude;
- the distribution of the deviations with respect to the
base flux is incompatible with the one expected from a stable source
with Gaussian errors during the observation period (Kolmogorov-Smirnov test).
These cuts are tuned to select 10% of the light curves.
We have checked that this procedure allows one to retrieve the previously
known Cepheids observed by EROS in the Magellanic Clouds.
We also keep a randomly selected set of light curves (2%)
to produce unbiased colour-magnitude diagrams, for comparison purposes;
At this stage a set of 41 545 light curves remains
which is then subjected to a periodicity search.
We use three independent methods to extract periodic light curves.
The first two are classical methods already described in the literature:
method 1 is based on the Lomb-Scargle periodogram (see Scargle 1982)
while method 2 makes use of the One Way Analysis of Variance algorithm
(see Schwarzenberg-Czerny 1996).
Both provide the probability for false periodicity detection.
In method 1 one computes the Fourier power over a
set of frequencies.
It is therefore well adapted to identify sinusoidal light curves.
It can be improved by incorporating
higher harmonics in order to detect
any kind of variability such as eclipsing
binaries (Grison 1994; Grison et al. 1995).
We developed a new method, the third one, in order to extract periodic
light curves in a way which is insensitive to the particular shape
of the variation.
This method also provides a probability for false periodicity detection.
![\begin{figure}
\par\includegraphics[width=8.8cm,clip]{ms1945f3.eps}\end{figure}](/articles/aa/full/2002/25/aa1945/Timg49.gif) |
Figure 3:
Distributions of  (left panels) and
variation of x with the value of the test-period in days (middle panels)
obtained with the third method
for a stable star and for a typical Cepheid candidate.
The bold dots are pointing to the actual period of the star.
The right panels show the light curve (in )
obtained once
the period has been folded in.
(left panels) and
variation of x with the value of the test-period in days (middle panels)
obtained with the third method
for a stable star and for a typical Cepheid candidate.
The bold dots are pointing to the actual period of the star.
The right panels show the light curve (in )
obtained once
the period has been folded in. |
| Open with DEXTER |
It consists in searching for a frequency such that the corresponding
phase diagram, i.e. the series of fluxes Fi
versus phases
 in increasing order of
  ,
displays a regular structure significantly less scattered
than for other frequencies.
Let
,
displays a regular structure significantly less scattered
than for other frequencies.
Let
 be the observation duration (100 days in this analysis).
We span the frequency domain from
be the observation duration (100 days in this analysis).
We span the frequency domain from
 to
to
 with
a constant step of
with
a constant step of
 .
The total number of test-frequencies is thus
.
The total number of test-frequencies is thus
 .
This sampling ensures that the total phase increment over
is
.
This sampling ensures that the total phase increment over
is  for two adjacent test-frequencies.
For each value of the test-frequency we compute the corresponding
phase diagram.
We calculate a
from the weighted differences of Fi and
the fluxes interpolated between Fi-1 and Fi+1:
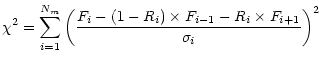 |
|
|
(2) |
where
 and
is the number of measurements.
The uncertainty
and
is the number of measurements.
The uncertainty  takes into account the errors
 on
the flux Fi and on the interpolated flux:
on
the flux Fi and on the interpolated flux:
 .
.
![\begin{figure}
\par\includegraphics[width=8.8cm,clip]{ms1945f4.eps}
\end{figure}](/articles/aa/full/2002/25/aa1945/Timg64.gif) |
Figure 4:
Distribution of
 for method 1 (top),
2 (middle) and 3 (bottom).
The histograms show the distribution for all 41 545
stars on which the periodicity search is done (in white) and
for the 2553 selected light curves (in black).
for method 1 (top),
2 (middle) and 3 (bottom).
The histograms show the distribution for all 41 545
stars on which the periodicity search is done (in white) and
for the 2553 selected light curves (in black). |
| Open with DEXTER |
Expression (2) can be interpreted as the
of the
set of differences between the odd measurements with respect
to the line joining even ones, added to the
of the
set of differences between even measurements with respect to the
line joining odd ones.
If the star is measured in both colours,
we add the
obtained in each colour (
is then twice
as large).
For a given stable star with Gaussian errors,
each phase diagram can be considered as a random realisation
of the light curve.
When the test-frequency spans the search domain, the distribution
of the
parameter defined by Eq. (2) is the one of the
standard
with
degrees of freedom.
Since
is large enough, this distribution is close to a
Gaussian with average
and variance
 (see upper left panel of Fig. 3).
For a periodic variable star,
the
distribution displays a main cluster,
when the test-frequency results in a phase diagram with non-correlated
point to point variations, and a few lower values
when the test-frequency corresponds to a phase diagram with a regular
structure (see lower left and middle panels of Fig. 3).
In practice, instead of using the parameter defined by
Eq. (2), we use the reduced variable:
(see upper left panel of Fig. 3).
For a periodic variable star,
the
distribution displays a main cluster,
when the test-frequency results in a phase diagram with non-correlated
point to point variations, and a few lower values
when the test-frequency corresponds to a phase diagram with a regular
structure (see lower left and middle panels of Fig. 3).
In practice, instead of using the parameter defined by
Eq. (2), we use the reduced variable:
 |
|
|
(3) |
where
 is the average of the realisations of for all test-frequencies.
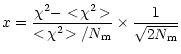
For a stable star, the distribution of this variable x is a Gaussian
centred at zero, with unit variance.
If the errors are correctly determined
is the average of the realisations of for all test-frequencies.
For a stable star, the distribution of this variable x is a Gaussian
centred at zero, with unit variance.
If the errors are correctly determined
 is
close to unity;
if the errors are all systematically overestimated (or underestimated),
then including this term ensures a global renormalisation
of the errors in Eq. (3), and the distribution of our reduced variable x is also a normal distribution.
Let
is
close to unity;
if the errors are all systematically overestimated (or underestimated),
then including this term ensures a global renormalisation
of the errors in Eq. (3), and the distribution of our reduced variable x is also a normal distribution.
Let
 be the smallest value of x calculated among
all test-frequencies for a given star.
Under the hypothesis that the light curve is produced by a stable star,
the probability to obtain at least
one value
be the smallest value of x calculated among
all test-frequencies for a given star.
Under the hypothesis that the light curve is produced by a stable star,
the probability to obtain at least
one value
 in a series of
 realisations is
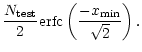
![${\rm Prob}(x < x_{\rm min} \vert N_{\rm test}) = 1 - \left[ 1 - \frac{1}{\sqrt{2\pi}} \int_{-\infty}^{x_{\rm min}} e^{-x^{2}/2} {\rm d}x \right]^{N_{\rm test}}$](/articles/aa/full/2002/25/aa1945/img72.gif) .
If this probability is small, then:
.
If this probability is small, then:
If the light curve exhibits periodic variations, then there exist
test-frequencies for which x is significantly smaller than
typical values of this variable (see middle and right panels of
Fig. 3), and the probability for false detection
is then extremely small.
Figure 4 displays the probability distribution
obtained with the three methods for the set of filtered light
curves.
We apply the three algorithms which all give a probability for
no periodicity.
A star is accepted only if selected by all three methods with
the following thresholds:
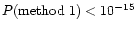 ,
,
 ,
,
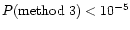 ,
tuned in order to allow one to retrieve the previously
known Cepheids observed by EROS in the Magellanic Clouds
(see Derue 1999 for more details).
This procedure (cut 4) selects a sample of 2553 stars.
,
tuned in order to allow one to retrieve the previously
known Cepheids observed by EROS in the Magellanic Clouds
(see Derue 1999 for more details).
This procedure (cut 4) selects a sample of 2553 stars.
Ten times more stars would have been selected if we had
used method 1 or method 2 only (with the same thresholds), most of them being
spurious variables.
The third method would have added far less candidates if used alone,
but still a factor 2 more.
Combining independent methods has thus the advantage of
considerably reducing the noise background
(mostly due to aliases of one day or noisy measurements) while
giving redundant information about the period.
To obtain individual periods we perform Fourier fits with
five harmonics:
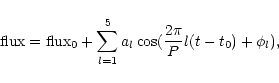 |
(5) |
where P is the period,  the phase and al the amplitude.
We define the amplitude ratios
Rkl = ak/al,
and the phase differences (defined modulo 2
the phase and al the amplitude.
We define the amplitude ratios
Rkl = ak/al,
and the phase differences (defined modulo 2 )
)
 ,
with k>l.
Objects with non-significant harmonic amplitudes (i.e. with almost sinusoidal light curves) have
,
with k>l.
Objects with non-significant harmonic amplitudes (i.e. with almost sinusoidal light curves) have
 and their
 is ill defined.
The selection of periodic variable stars is complicated by aliases.
Some of the stars with periods equal to a simple fraction or a low multiple
of one day may be badly phased because of the nightly
sequence of measurements.
These aliased periods are seen in Fig. 5 as vertical groups of dots
at 2/3, 2 and 3 days.
To eliminate them we demand (cut 5)
that the fitted periods are not within
 of these values.
One can also notice some vertical groups of points around 25
days which correspond to data gaps in our sample
(see Fig. 1).
Once these objects are removed, 2424 stars remain.
The flux values of the remaining stars are folded using each period
obtained with the three methods.
The resulting phase diagrams are visually inspected.
Some of them display an obvious spurious periodic or quasi-periodic
variability due to a low
photometric quality.
After this final visual selection (cut 6) the list of variable
stars includes 1362 candidates which exhibit unambiguous periodic variability.
of these values.
One can also notice some vertical groups of points around 25
days which correspond to data gaps in our sample
(see Fig. 1).
Once these objects are removed, 2424 stars remain.
The flux values of the remaining stars are folded using each period
obtained with the three methods.
The resulting phase diagrams are visually inspected.
Some of them display an obvious spurious periodic or quasi-periodic
variability due to a low
photometric quality.
After this final visual selection (cut 6) the list of variable
stars includes 1362 candidates which exhibit unambiguous periodic variability.
The classification of the selected stars among
different types of variability cannot be based on the position of the objects
in the colour-magnitude diagram since
the spread in distance of these stars entails a spread in
magnitude and colour.
It is desirable however to classify the various light curves according
to some physical parameters.
In the following we mainly
use criteria based on the period P of the luminosity variations
and on the amplitude ratio
 .
For each selected type of variable star the phase diagram of a typical
candidate is displayed in Fig. 6.
.
For each selected type of variable star the phase diagram of a typical
candidate is displayed in Fig. 6.
![\begin{figure}
\par\includegraphics[width=8.8cm,clip]{ms1945f5.eps}\end{figure}](/articles/aa/full/2002/25/aa1945/Timg89.gif) |
Figure 5:
Period-colour diagram (P in days vs. -)
of the 2553 selected candidates before cut 5. |
| Open with DEXTER |
Three groups are distinguished depending on their period:
- 1st:
- stars with a period larger than 60 days (543 objects):
For these objects an entire period has not been observed.
There is thus no warranty that these objects are periodic ones.
34 display a nearly linear light curve and are thus catalogued
as Miras candidates.
The other 509 objects are catalogued as Long Period Variable stars (LPVs).
- 2nd:
- stars with a period between 30 and 60 days (387 objects):
264 Semi-Regular variable stars are selected by requiring:
 /
/
 1.2 to select pulsating stars (see below),
 > 2.5 to discriminate from bluer variable stars and
 to avoid possible Miras or LPVs wrongly phased.
The long term stability of these stars is not known.
Some of the reported periods may change from season to season,
as a result of their semi-regular behaviour.
The remaining 123 objects are catalogued as miscellaneous
variable stars.
to avoid possible Miras or LPVs wrongly phased.
The long term stability of these stars is not known.
Some of the reported periods may change from season to season,
as a result of their semi-regular behaviour.
The remaining 123 objects are catalogued as miscellaneous
variable stars.
![\begin{figure}
\par\includegraphics[width=12.5cm,clip]{ms1945f6.eps}\end{figure}](/articles/aa/full/2002/25/aa1945/Timg94.gif) |
Figure 6:
Phase diagrams (or light curves for the two lowest
panels) for typical variable stars of our catalogue
in
magnitude. |
| Open with DEXTER |
Table 3:
Number of selected objects for each type of variability.
| Period range |
Type |
Number of objects |
| P>60 d |
|
543 |
| |
LPV |
509 |
| |
Miras |
34 |
| 60 > P>30 d |
|
387 |
| |
Semi-Regular |
264 |
| |
miscellaneous |
123 |
| P<30 d |
|
432 |
| |
pulsating |
60 |
| |
RRc |
14 |
| |
RRab |
5 |
| |
classical-Cepheids |
6 |
| |
s-Cepheids |
3 |
| |
miscellaneous |
32 |
| |
non-pulsating |
372 |
| |
EA |
130 |
| |
EB |
35 |
| |
EW |
11 |
| |
miscellaneous |
196 |
- 3rd:
- stars with a period smaller than 30 days (432 objects):
The colour change for a Cepheid in standard passbands
is
 /
/
 1.3 (Madore et al. 1991) which corresponds
to
/
1.2 in the EROS system.
Two sets are thus distinguished based on this criterion:
1.3 (Madore et al. 1991) which corresponds
to
/
1.2 in the EROS system.
Two sets are thus distinguished based on this criterion:
- -
- The pulsating variable stars (60 objects):
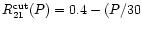
For stars with period P<1 day, two samples of RR Lyræ are identified:
the RRc have
R21 < 0.4 (14 objects) and
the RRab have
R21 > 0.4 (5 objects).
We adopt the morphological classification
proposed by Antonello et al. (1986) and classify as s-Cepheids the stars
that lie in the lower part of the R21-P plane, and as classical
Cepheids the remaining stars.
s-Cepheids pulsate in the first overtone and classical Cepheids in the
fundamental mode (see e.g. Beaulieu et al. 1995; Beaulieu & Sasselov 1996).
We use the empirical function
 days)
in order to separate these pulsation modes (see Fig. 7).
Among the five objects that pass the s-Cepheid cut, only three
belong to the R21-P and
days)
in order to separate these pulsation modes (see Fig. 7).
Among the five objects that pass the s-Cepheid cut, only three
belong to the R21-P and
 distributions of galactic s-Cepheids and their phase parameter
is poorly constrained.
Besides most of classical Cepheids have amplitudes larger than
distributions of galactic s-Cepheids and their phase parameter
is poorly constrained.
Besides most of classical Cepheids have amplitudes larger than
 (see e.g. Afonso et al. (1999)).
For stars with period P>1 day, three samples are then identified:
the classical Cepheids have
(see e.g. Afonso et al. (1999)).
For stars with period P>1 day, three samples are then identified:
the classical Cepheids have
 and
(6 objects);
the s-Cepheids have
and
(6 objects);
the s-Cepheids have
 and
and
 (3 objects);
the remaining 32 objects are catalogued as miscellaneous
pulsating stars.
(3 objects);
the remaining 32 objects are catalogued as miscellaneous
pulsating stars.
- -
- The non-pulsating variable stars (372 objects):
The remaining objects have similar amplitudes in both passbands.
We classify them according to the following criteria.
Algol systems (130 stars, type EA) display well-defined eclipses
whose secondary one has a depth lower than half the primary one,
and possibly flat light curve between them.
EB type objects (35 in total) show a secondary
eclipse equal to half the primary one.
The EW type (11 objects) is characterised by similar depths
of the two eclipses.
The members of a residual sample of 196 objects do not look
like convincing
eclipsing binaries and are catalogued as miscellaneous variable stars.
As emphasised by Udalski et al. (1999a) a large number of
variable objects show small amplitude sinusoidal variations, such as
ellipsoidal binary variable stars.
A contamination of the sample of pulsating stars by eclipsing binaries
is thus possible.
Figures 8 and 9 show the location of the selected variables in the
colour-magnitude diagrams.
Also plotted are 10 000 stars located
in the central part of the two fields tm550 and gn450.
Most of the Cepheids are much brighter than our magnitude threshold
(cut 2); this is not so for RR Lyræ (see Fig. 9, lower panel).
Our catalogue is thus not complete for this
type of variable stars, as already mentionned.
4 The catalogue
The catalogue is composed of two tables containing
objects with periods P smaller or larger than 30 days, respectively.
The identifier of each star is given according to the recommendations of
the IAU Commission 5 in The Rules and Regulations for
Nomenclature (see the Annual Index of A&A).
The general acronym used in the
catalogue is EROS2 GSA followed by J2000 equatorial coordinates
in the format
 .
The remainder of the identifier in parentheses gives some information
relating to the internal organisation of the EROS database:
gnnnn or tmnnn is the name of the field, followed by the CCD number and
the location on the image following the EROS II
nomenclature.
The remaining number is the star identifier used in the EROS database.
As an example, J132630-630945(tm5504m12359) is the
name of the 12359th star
observed in quarter m of CCD 4 in the field tm550.
The J2000 equatorial coordinates of this star are 13:26:30.11, -63:09:45.66.
.
The remainder of the identifier in parentheses gives some information
relating to the internal organisation of the EROS database:
gnnnn or tmnnn is the name of the field, followed by the CCD number and
the location on the image following the EROS II
nomenclature.
The remaining number is the star identifier used in the EROS database.
As an example, J132630-630945(tm5504m12359) is the
name of the 12359th star
observed in quarter m of CCD 4 in the field tm550.
The J2000 equatorial coordinates of this star are 13:26:30.11, -63:09:45.66.
The equatorial coordinates (J2000) of individual stars have been
obtained as follows.
First, we have inserted the suitable WCS keywords into the header of
the EROS II reference images using the WCSTOOLS
package (Mink 1999).
Whenever possible, the cross-identification of each star with previously known
objects within a 10 search radius has been done using
the SIMBAD and VIZIER databases available at
the CDS, Strasbourg.
search radius has been done using
the SIMBAD and VIZIER databases available at
the CDS, Strasbourg.
![\begin{figure}
\par\includegraphics[width=8.8cm,clip]{ms1945f7.eps}\end{figure}](/articles/aa/full/2002/25/aa1945/Timg103.gif) |
Figure 7:
Distinction between classical Cepheids,
s-Cepheids and miscellaneous
pulsating stars in the
R21-P and
planes.
The individual uncertainties are reported.
The cloud of points represent the Cepheids observed in the LMC
(adapted from Afonso et al. 1999).
The curve corresponds to the empirical
function
days) used to distinguish
between s and classical Cepheids. |
| Open with DEXTER |
The tables contain the following information:
- 1.
- Identifier;
- 2.
- Right ascension
 (J2000);
- 3.
- Declination
 (J2000);
- 4.
-
 mean magnitude in EROS-red;
- 5.
-
 amplitude peak to peak in ;
- 6.
-
 mean magnitude in EROS-visible;
- 7.
-
amplitude peak to peak in ;
- 8.
- Period in days. Note that periods longer than
30 days are given with less accuracy since the time span
of the measurements does not allow a precise determination.
Measured periods which are longer than 60 days
(i.e. 2/3 of the observation
period) are flagged by writing "P>60 d'' and have no warranty to
be true periodic variable stars.
The peak to peak amplitude of these stars could
be meaningless and the mean magnitude is determined with low accuracy.
For Cepheids and RR Lyræ the results of the Fourier fit are given:
- 9.
- Fourier coefficient ratio R21;
- 10.
- Fourier coefficient ratio R31;
- 11.
- Phase difference
 (in rad);
Also given when possible:
- 13.
- Type of variability (C = classical Cepheids,
S = s-Cepheids, puls. = miscellaneous pulsating stars,
EA, EB, EW = eclipsing binaries, misc = miscellaneous
variable stars, SR = Semi-Regular variables, M = Miras,
LPV = long period variables);
- 14.
- Name of cross-identified object(s)
within a search radius of 10.
Tables 4 and 5 show a sample of the
catalogue that we plan to install at the CDS
(see also our Web site http://eros.in2p3.fr/).
![\begin{figure}
\par\includegraphics[width=8.8cm,clip]{ms1945f8.eps}
\end{figure}](/articles/aa/full/2002/25/aa1945/Timg108.gif) |
Figure 8:
Colour-magnitude diagrams (
vs. -)
for the
Miras (represented by dots  ), Semi-Regular
variable stars (diamonds ), Semi-Regular
variable stars (diamonds  )
and
eclipsing binaries (open circles )
and
eclipsing binaries (open circles  ).
The dotted line corresponds to cut 2 on the luminosity
of the stars. ).
The dotted line corresponds to cut 2 on the luminosity
of the stars. |
| Open with DEXTER |
Table 5:
Catalogue of stars with P>30 days (sample).
| EROS2 GSA ID |
RA(J2000) |
DEC(J2000) |
|
|
|
|
P(days) |
Type |
Note |
| J132359-623229(tm5500l1488) |
13:23:59.86 |
-62:32:29.63 |
10.83 |
0.14 |
14.18 |
0.22 |
52.04 |
SR |
MSX5C G306.6758+00.0933 |
| J132400-632057(tm5504l1003) |
13:24:00.60 |
-63:20:57.82 |
12.34 |
0.20 |
16.06 |
0.38 |
45.83 |
SR |
[CKS91] 13206-6305 |
| J132419-632717(tm5506k3687) |
13:24:19.25 |
-63:27:17.42 |
11.56 |
0.34 |
14.94 |
5.43 |
>60 d |
LPV |
MSX5C G306.5942-00.8179 |
| J132427-631542(tm5504k5591) |
13:24:27.10 |
-63:15:42.08 |
11.75 |
0.18 |
14.88 |
0.33 |
>60 d |
LPV |
[CKS91] 13211-6300 |
| J132431-630539(tm5504k6408) |
13:24:31.78 |
-63:05:39.51 |
15.34 |
0.27 |
17.19 |
0.50 |
55.70 |
|
|
| J132433-632201(tm5504m10330) |
13:24:33.05 |
-63:22:01.64 |
11.96 |
0.24 |
9.49 |
0.43 |
58.46 |
|
[CKS91] 13229-6252 |
| J132437-623119(tm5500k7345) |
13:24:37.80 |
-62:31:19.09 |
12.4 |
0.21 |
15.94 |
0.47 |
>60 d |
|
|
| J132440-633236(tm5506k6457) |
13:24:40.22 |
-63:32:36.78 |
11.67 |
0.34 |
15.46 |
0.42 |
>60 d |
|
MSX5C G306.6222-00.9099 |
| J132444-632224(tm5504l7786) |
13:24:44.82 |
-63:22:24.20 |
10.79 |
0.44 |
14.13 |
1.19 |
55.00 |
|
IRAS 13214-6306; MSX5C G306.6524-00.7426 |
| J161332-541002(gn4590k724) |
16:13:32.50 |
-54:10:02.22 |
13.14 |
0.84 |
16.49 |
1.79 |
>60 d |
LPV |
2MASS 1613326-541004 |
| J161332-541453(gn4590k673) |
16:13:32.45 |
-54:14:53.91 |
13.87 |
0.18 |
16.12 |
0.26 |
38.29 |
SR |
2MASS 1613325-541454 |
![\begin{figure}
\par\includegraphics[width=12.3cm,clip]{ms1945f9.eps}
\end{figure}](/articles/aa/full/2002/25/aa1945/Timg112.gif) |
Figure 9:
Colour-magnitude diagrams (
vs -)
for the
classical Cepheids (represented by stars  ),
s-Cepheids (dots ),
and RR Lyræ (open circles ). ),
s-Cepheids (dots ),
and RR Lyræ (open circles ). |
| Open with DEXTER |
A by-product of such a survey
is the possibility to update the coordinates given in older catalogues.
As an example, it was found that the well known
classical Cepheid OO Cen with the SIMBAD
identifier V*OO Cen was 20 away from an EROS
object, namely J132630-630945(tm5504m12359), as shown in
the finding chart of Fig. 10.
Table 6:
Period and coordinates obtained on OO Cen by SIMBAD, GCVS and this study.
| Source |
SIMBAD |
GCVS |
This study |
| object |
V* OO Cen |
OO Cen |
J132630-630945(tm5504m12359) |
| P (days) |
n/a |
12.8805 |
12.894 |
|
(B1950) |
13:23:06.85 |
13:23:09 |
13:23:08.8 |
|
(B1950) |
-62:54:24.9 |
-62:54.0 |
-62:54:11 |
Table 7:
Previously known variable stars recovered by this survey.
For each star we give its name, the original catalogue, the type
of variability, the period and the I magnitude given (if any)
in the catalogue and in this survey.
| Object |
Catalogue |
Type |
P(days) |
I |
EROS ID |
P(days) |
 |
| OO Cen |
GCVS |
C |
12.8805 |
9.96 |
J132630-630945 |
12.8941 |
10.20 |
| |
|
|
|
|
(tm5504m12359) |
|
|
| V881 Cen |
GCVS |
C |
- |
10.57 |
J132721-630110 |
15.2278 |
10.97 |
| |
|
|
|
|
(tm5503l3554) |
|
|
| V608 Cen |
GCVS |
EB |
1.6287 |
12.95 |
J132948-630634 |
1.7601 |
12.05 |
| |
|
|
|
|
(tm5505m13922) |
|
|
| CKS91 |
CKS91 |
EA |
- |
13.29 |
J132758-631449 |
5.4918 |
13.03 |
| 13246-6259 |
|
|
|
|
(tm5505l9598) |
|
|
| CKS91 |
CKS91 |
E |
- |
13.05 |
J133311-630023 |
0.2141 |
13.20 |
| 13297-6244 |
|
|
|
1 |
(tm5511m5801) |
|
|
| CKS91 |
CKS91 |
SR |
- |
12.35 |
J132400-632057 |
45.83 |
12.34 |
| 13206-6305 |
|
|
|
|
(tm5504l1003) |
|
|
| CKS91 |
CKS91 |
LPV |
- |
11.73 |
J132427-631542 |
P>60 |
11.75 |
| 13211-6300 |
|
|
|
|
(tm5504k5591) |
|
|
| CKS91 |
CKS91 |
SR |
- |
10.51 |
J132444-632224 |
55.00 |
10.79 |
| 13214-6306 |
|
|
|
|
(tm5504l7786) |
|
|
| CKS91 |
CKS91 |
SR |
- |
12.85 |
J132447-631201 |
52.39 |
12.77 |
| 13214-6256 |
|
|
|
|
(tm5504k8841) |
|
|
| CKS91 |
CKS91 |
LPV |
- |
10.43 |
J132454-631437 |
P>60 |
10.23 |
| 13215-625 |
|
|
|
|
(tm5504k9938) |
|
|
| CKS91 |
CKS91 |
LPV |
- |
11.81 |
J132519-631720 |
P>60 |
13.00 |
| 13219-6301 |
|
|
|
|
(tm5504l13138) |
|
|
| CKS91 |
CKS91 |
LPV |
- |
12.51 |
J132433-632201 |
58.46 |
11.96 |
| 13229-6252 |
|
|
|
|
(tm5504m10330) |
|
|
| CKS91 |
CKS91 |
LPV |
- |
12.48 |
J132625-630645 |
P>60 |
12.41 |
| 13230-6251 |
|
|
|
|
(tm5504m11603) |
|
|
| CKS91 |
CKS91 |
LPV |
- |
12.63 |
J132714-634338 |
P>60 |
10.78 |
| 13238-6227 |
|
|
|
|
(tm5507l1058) |
|
|
| CKS91 |
CKS91 |
LPV |
- |
12.21 |
J132719-633644 |
P>60 |
11.91 |
| 13238-6254 |
|
|
|
|
(tm5507l1752) |
|
|
| CKS91 |
CKS91 |
M |
- |
12.46 |
J132803-632200 |
P>60 |
13.99 |
| 13246-6306 |
|
|
|
|
(tm5505l10106) |
|
|
| CKS91 |
CKS91 |
SR |
- |
12.66 |
J132813-630013 |
44.80 |
12.72 |
| 13247-6244 |
|
|
|
|
(tm5510k2095) |
|
|
| CKS91 |
CKS91 |
LPV |
- |
12.37 |
J132948-631227 |
P>60 |
12.56 |
| 13264-6256 |
|
|
|
|
(tm5510n4312) |
|
|
| CKS91 |
CKS91 |
M |
- |
12.65 |
J133222-632339 |
P>60 |
12.65 |
| 13289-6308 |
|
|
|
|
(tm5513k12129) |
|
|
The period and coordinates we report are compatible with
the ones given by the GENERAL CATALOGUE
OF VARIABLE STARS (GCVS)
(Kholopov 1985) (see Table 6).
It seems that an error occurred when the coordinates of this particular
star were filled in the SIMBAD.
The light curve of this object is shown in Fig. 6.
We have performed several cross-identifications of our
catalogue with those previously available, namely
the IRAS POINT SOURCE CATALOG (Beichman et al. 1998),
the MSX5C INFRARED ASTROMETRIC CATALOG (Egan et al. 1996),
the TWO MICRON ALL SKY SURVEY (2MASS) (Skrutskie et al. 1997),
the CKS91 catalogue (Caldwell et al. 1991) and the
GENERAL CATALOGUE OF VARIABLE STARS (GCVS) (Kholopov 1985).
A total of 38 IRAS sources and 220 MSX5C objects
have been thus retrieved.
The overlap with the available 2MASS catalogue exists only for the
EROS field gn459, representing 255 stars.
A total of 233 2MASS objects have been thus retrieved among them
37 objects classified as Semi-Regular variables.
An overlap exists with the CKS91 catalogue (Caldwell et al. 1991).
These authors have searched for bright Cepheids and
other variable stars with
I < 14, towards Crux and Centaurus, during 42 days with less than 10
measurements per star.
A small overlap exists between this survey and the GSA fields
tm550 and tm551.
Unfortunately this overlap involves our CCD #2 which was not operational
at the time of the observations.
Therefore the comparison can only be carried out on 0.7 square degree.
Furthermore, as pointed above, this comparison is restricted to
stars with magnitude
 .
A total of 118 EROS objects, 6 GCVS and 23 CKS91
objects lie in this region.
Three objects are common to the GCVS and
CKS91 catalogues one.
The overlap between the three catalogues represents only 19 objects.
Among them one finds the most interesting
ones, such as Cepheids OO CEN and V881 CEN
(see Table 7).
Some objects show a large difference between the
two magnitude determinations.
These are long period variables
for which the mean magnitude is measured on only a
part of the whole period, and thus ill determined in both surveys.
Only 7 known variable stars are not recovered by our analysis
(see Table 8).
Conversely, 99 objects of our catalogue are not listed
by CKS91. All of them are labelled Long Period Variable stars (LPV).
.
A total of 118 EROS objects, 6 GCVS and 23 CKS91
objects lie in this region.
Three objects are common to the GCVS and
CKS91 catalogues one.
The overlap between the three catalogues represents only 19 objects.
Among them one finds the most interesting
ones, such as Cepheids OO CEN and V881 CEN
(see Table 7).
Some objects show a large difference between the
two magnitude determinations.
These are long period variables
for which the mean magnitude is measured on only a
part of the whole period, and thus ill determined in both surveys.
Only 7 known variable stars are not recovered by our analysis
(see Table 8).
Conversely, 99 objects of our catalogue are not listed
by CKS91. All of them are labelled Long Period Variable stars (LPV).
![\begin{figure}
\par\includegraphics[width=8.8cm,clip]{ms1945f10.eps}\end{figure}](/articles/aa/full/2002/25/aa1945/Timg115.gif) |
Figure 10:
Finding chart of the star
OO Cen - J132630-630945(tm5504m12359).
The position given by the SIMBAD database is shown by the square
which is 10 wide, while the EROS position is
shown by the circle. |
| Open with DEXTER |
Table 8:
Previously known variable stars not recovered by this survey.
For each of them we give (where possible) their type of variability,
their period and the reason for their absence in the catalogue.
| Object |
Type |
P(days) |
catalogue |
comment |
| HQ Nor |
EB |
90.9 |
GCVS |
too long period |
| HY Nor |
Mira |
236 |
GCVS |
close to |
| |
|
|
|
the CCDs gap |
| UW Nor |
EA |
8.4860 |
GCVS |
fails cut 6 |
| 13214-6256 |
LPV |
|
CKS91 |
fails cut 6 |
| 13218-6254 |
LPV |
|
CKS91 |
fails cut 6 |
| 13248-6249 |
LPV |
|
CKS91 |
fails cut 6 |
| 13232-6249 |
LPV |
|
CKS91 |
fails cut 6 |
5 Discussion
The motivation of our search was to improve our knowledge
of the distance distribution and of the extinction of the
microlensing source stars used in Papers I and II.
In the following we use the RR Lyræ which are
well-known distance indicators and have been
observed in all six directions that we investigated.
The GSA fields having a high non-uniform absorption, we give only
an average reddening towards our fields, based on EROS data alone.
For each selected RR Lyræ we estimate the extinction
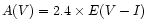 using the standard extinction coefficients (Schlegel et al. 1998; Stanek 1996).
The colour excess E(V-I) is derived from the colour that
we measured and their intrinsic colour:
using the standard extinction coefficients (Schlegel et al. 1998; Stanek 1996).
The colour excess E(V-I) is derived from the colour that
we measured and their intrinsic colour:
 and
and
 (Alcock et al. 1998).
The uncertainty on individual extinctions
is estimated to be
(Alcock et al. 1998).
The uncertainty on individual extinctions
is estimated to be
 .
This error includes the
.
This error includes the
 uncertainty on the
EROS colour measurement (see Eq. (1))
and a
magnitude uncertainty on the intrinsic colour.
The absolute magnitude of RR Lyræ is
uncertainty on the
EROS colour measurement (see Eq. (1))
and a
magnitude uncertainty on the intrinsic colour.
The absolute magnitude of RR Lyræ is
 with a precision of
 (Gould & Popowski 1998).
Finally, we estimate the distance to each star simply
by using the relation
(Gould & Popowski 1998).
Finally, we estimate the distance to each star simply
by using the relation
 .
The typical uncertainty on the distance is 20%.
The left panels of Fig. 11 show the obtained extinction
A(V) versus the calculated distance.
The mean extinction of the RR Lyræ
is
.
The typical uncertainty on the distance is 20%.
The left panels of Fig. 11 show the obtained extinction
A(V) versus the calculated distance.
The mean extinction of the RR Lyræ
is
 mag towards
Mus and
mag towards
Mus and
 towards
Nor, with a dispersion of 1 mag.
The mean distance of the RR Lyræ is
towards
Nor, with a dispersion of 1 mag.
The mean distance of the RR Lyræ is
 kpc
towards
Mus and
kpc
towards
Mus and
 kpc towards Nor.
The dispersion of the values is 1.4 kpc which reflects the spread in
distance of disc stars.
The disc population contributes to the sources of the microlensing events
that we observe in the Galactic plane.
A model based on the distribution of matter in the disc
and the luminosity function of neighbooring stars has been used
in Derue (1999) to estimate the distance of the star
population from the disc.
The distance of RR Lyræ is in good agreement with the one obtained
with this model.
kpc towards Nor.
The dispersion of the values is 1.4 kpc which reflects the spread in
distance of disc stars.
The disc population contributes to the sources of the microlensing events
that we observe in the Galactic plane.
A model based on the distribution of matter in the disc
and the luminosity function of neighbooring stars has been used
in Derue (1999) to estimate the distance of the star
population from the disc.
The distance of RR Lyræ is in good agreement with the one obtained
with this model.
![\begin{figure}
\par\includegraphics[width=8.8cm,clip]{ms1945f11.eps}
\end{figure}](/articles/aa/full/2002/25/aa1945/Timg128.gif) |
Figure 11:
Extinction A(V) versus the distance of RR Lyræ (in kpc)
towards
Mus and
Nor.
The right panels show the inferred distance distribution. |
| Open with DEXTER |
In the course of our program dedicated to microlensing events,
we have devoted a fraction of observing time to the search for variable
stars in six directions of the Galactic plane.
This exploratory campaign, that lasted three months,
led to the discovery of 1362 variable stars.
Among them we identified 9 Cepheids, 19 RR Lyræ, 34 Miras,
176 eclipsing binaries and 266 Semi-Regular variable stars.
We have set up a catalogue of all of the 1362 stars and
cross-identified it with several other catalogues.
In particular a comparison with the GCVS and
the CKS91 catalogues
shows that only a small fraction (15%) of the objects that we
have identified appear in those two.
Among the stars most appropriate to be used as distance indicators,
the Cepheids turned out to be too few to warrant a
particular study.
As far as RR Lyræ are concerned, we have
determined their mean distance and found it to be 5 kpc.
Yet the statistics being quite limited, we are considering pursuing
this effort by launching a longer search for variable stars based
on the results of this first campaign.
Acknowledgements
The WCSTools package was made available to us thanks to the work of Doug Mink,
NASA/GSFC, Harvard.
The Skycat/Gaia tool is the result of a joint effort
by the computer staff of ESO Garching and from the Starlink Project, UK.
-
Afonso, C., Albert, J. N, Amadon, A., et al. (EROS coll.) 1999,
CEA Saclay Report Dapnia-SPP 99/25. See also
In the text
http://www-dapnia.cea.fr/Spp/Experiences/EROS/Cepheides/catalog_cep.html
-
Alcock, C., Allsman, R. A., & Alves, D. R. (MACHO coll.) 1998,
ApJ, 492, 190
In the text
NASA ADS
-
Ansari, R. 1996, Vistas in Astron., 40, 519
In the text
NASA ADS
-
Antonello, E., & Poretti, E. 1986, A&A, 169, 149
In the text
NASA ADS
-
Beaulieu, J.-P., Grison, P., Tobin, W., et al. (EROS coll.) 1995, ApJ, 303, 137
In the text
-
Beaulieu, J.-P., & Sasselov, D. 1996,
Variable Stars and the Astrophysical Returns of Microlensing Surveys,
ed. R. Ferlet, J. P. Maillard, & B. Raban, 193
In the text
-
Beichman, C. A., Neugebauer, G. A., Habing, H. J., Clegg, P. E., & Chester, T. J. 1988,
Explanatory Supplement to the IRAS Catalogs and Atlases
In the text
-
Caldwell, J., Keane, M., & Schechter, P. 1991, AJ, 101, 1763
In the text
NASA ADS
-
Cioni, M.-R. L., Marquette, J.-B., Loup, C., et al. 2001, A&A, 377, 945
In the text
NASA ADS
-
Derue, F. 1999, Ph.D. Thesis,
CNRS/IN2P3, LAL report 99-14, Université Paris XI Orsay, also available at the URL In the text
http://www.lal.in2p3.fr/presentation/bibliotheque/publications/Theses99.html
-
Derue, F., Afonso, C., Alard, C., et al. ( EROS coll.) 1999, A&A, 351, 87
In the text
NASA ADS
-
Derue, F., Afonso, C., Alard, C., et al. ( EROS coll.) 2001, A&A, 373, 126
In the text
NASA ADS
-
Egan, M. P., Price, S. D., Moshir, M. M., et al. 1999, AFRL-VS-TR-1999-1522
In the text
-
Fouqué, P., Chevallier, L., Cohen, M., et al. 2000, A&AS, 141, 313
In the text
NASA ADS
-
Georgelin, Y. M, Amram, P., Georgelin, Y. P., et al. 1994, A&AS, 108, 513
In the text
NASA ADS
-
Gould, A., & Popowski, P. 1998, ApJ, 508, 844
In the text
NASA ADS
-
Grison, P. 1994, A&A, 289, 404
In the text
NASA ADS
-
Grison, P., Beaulieu, J.-P., Pritchard, J.-D., et al. ( EROS coll.) 1995, A&AS, 109, 447
In the text
NASA ADS
-
Harris, J., & Zaritsky, D. 1999, AJ, 117, 2831
In the text
NASA ADS
-
Kholopov, P. N. 1985, in General Catalogue of Variable Stars, vol. 1
(Moscow Nauka Pub. House)
In the text
-
Madore, B. F., & Freedman, W. L. 1991, PASP, 103, 933
In the text
NASA ADS
-
Mansoux, B. 1997, Ph.D. Thesis, CNRS/IN2P3, LAL report 97-19, Université Paris 7
In the text
- Mink, D. G. 1999, Astronomical Data Analysis Software and Systems VIII,
ASP Conf. Ser., ed. D. Mehringer, R. Plante, & D. Roberts, 498
In the text
-
Paczynski, B. 1996, invited talk at the Extragalactic Distance Scale
STScI Symp., May 7-10, 1996, Baltimore, Maryland, USA [astro-ph/9608094]
In the text
-
Palanque-Delabrouille, N., Afonso, C., Albert, J.-N., et al.
( EROS coll.) 1998, A&A, 332, 1
In the text
NASA ADS
-
Regnault, N. 2000, Ph.D. Thesis, Université Paris VII,
LAL-CNRS/IN2P3 Report 00/65.
also available at the URL
In the text
http://www.lal.in2p3.fr/presentation/bibliotheque/publications/Theses00.html
-
Russeil, D., Amram, P., Georgelin, Y. P., et al. 1998, A&AS, 130, 119
In the text
NASA ADS
-
Scargle, J. D. 1982, ApJ, 263, 835
In the text
NASA ADS
-
Schwarzenberg-Czerny, A. 1996, ApJ, 460, L107
In the text
NASA ADS
-
Schlegel, D. J., Finkbeiner, D. P., & Davies, M. 1998, AJ, 500, 525
In the text
-
Skrutskie, M. F., Schneider, S. E., Stiening, R., et al. (2MASS Coll) 1997, Proc. Workshop
The Impact of Large Scale Near-IR Sky Surveys, 25
In the text
-
Stanek, K. Z. 1996, ApJ, 460, L37
In the text
NASA ADS
-
Udalski, A., Szymanski, M., Kubiak, M., et al.
( OGLE Coll.) 1998, Act. Astr., 48, 1
In the text
NASA ADS
-
Udalski, A., Soszynski, I., Szymanski, M., et al.
( OGLE Coll.) 1999, Act. Astr., 49, 45
In the text
NASA ADS
Copyright ESO 2002
![\begin{figure}
\par\includegraphics[width=8.8cm,clip]{ms1945f1.eps}\end{figure}](/articles/aa/full/2002/25/aa1945/img43.gif)
![\begin{figure}
\par\includegraphics[width=8.8cm,clip]{ms1945f2.eps}\end{figure}](/articles/aa/full/2002/25/aa1945/img46.gif)
![\begin{figure}
\par\includegraphics[width=8.8cm,clip]{ms1945f3.eps}\end{figure}](/articles/aa/full/2002/25/aa1945/img49.gif)
![\begin{figure}
\par\includegraphics[width=8.8cm,clip]{ms1945f4.eps}
\end{figure}](/articles/aa/full/2002/25/aa1945/img64.gif)
![\begin{figure}
\par\includegraphics[width=8.8cm,clip]{ms1945f5.eps}\end{figure}](/articles/aa/full/2002/25/aa1945/img89.gif)
![\begin{figure}
\par\includegraphics[width=12.5cm,clip]{ms1945f6.eps}\end{figure}](/articles/aa/full/2002/25/aa1945/img94.gif)
![\begin{figure}
\par\includegraphics[width=8.8cm,clip]{ms1945f7.eps}\end{figure}](/articles/aa/full/2002/25/aa1945/img103.gif)
![\begin{figure}
\par\includegraphics[width=8.8cm,clip]{ms1945f8.eps}
\end{figure}](/articles/aa/full/2002/25/aa1945/img108.gif)
![\begin{figure}
\par\includegraphics[width=12.3cm,clip]{ms1945f9.eps}
\end{figure}](/articles/aa/full/2002/25/aa1945/img112.gif)
![\begin{figure}
\par\includegraphics[width=8.8cm,clip]{ms1945f10.eps}\end{figure}](/articles/aa/full/2002/25/aa1945/img115.gif)
![\begin{figure}
\par\includegraphics[width=8.8cm,clip]{ms1945f11.eps}
\end{figure}](/articles/aa/full/2002/25/aa1945/img128.gif)