The photophysics of interstellar PAHs have been described for example by
Léger et al. (1989). After the absorption of an UV photon, the
system follows a rapid evolution towards the ground electronic state
(internal conversion). The energy is redistributed in the vibrational
modes by the Intramolecular Vibrational Redistribution (IVR) mechanism, and the isolated excited
species then cool down by emitting in their IR active modes. Some of
the energy can also be lost through electronic fluorescence (Poincaré
fluorescence; Léger et al. 1988). The contribution of the electronic fluorescence to
the cooling process was found to be about 10% for the small cation coronene
C
![]() H
H
![]() and to become negligible for larger
PAH species. This mechanism was therfore not considered in the
calculations.
and to become negligible for larger
PAH species. This mechanism was therfore not considered in the
calculations.
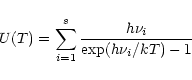
Assuming a statistical distribution of the energy among the vibrational modes, the infrared emission
rate
![]() of the mode i in the transition
of the mode i in the transition
![]() is given by:
is given by:
Several mechanisms can contribute to the broadening of the IR bands emitted by PAHs during their cooling.
The homogeneous IR band width of a vibrationnally excited PAH is governed by IVR. Driven by the coupling between
states, IVR is effective at vibrational energies larger than ![]() 2000
cm-1 in the case of PAHs (Felker & Zewail 1984). It leads to a lifetime of the levels much
shorter than the radiative lifetime (10-11 s compared to
10-7 s for the electronic fluorescence and 10-1 s for the
infrared emission). Therefore this mechanism dominates the band width
associated with a Lorentzian profile. As the vibrational energy increases, this band width becomes
larger (Ionov et al. 1988; Joblin et al. 1995). It is
found to increase linearly with temperature, a behaviour which is
well-explained by theory.
2000
cm-1 in the case of PAHs (Felker & Zewail 1984). It leads to a lifetime of the levels much
shorter than the radiative lifetime (10-11 s compared to
10-7 s for the electronic fluorescence and 10-1 s for the
infrared emission). Therefore this mechanism dominates the band width
associated with a Lorentzian profile. As the vibrational energy increases, this band width becomes
larger (Ionov et al. 1988; Joblin et al. 1995). It is
found to increase linearly with temperature, a behaviour which is
well-explained by theory.
Measurements on gas-phase PAHs have also revealed the
dependence on temperature of the IR band positions (Joblin et al. 1995). The positions are shifted towards lower
frequencies as the temperature increases, following a linear law.
This effect has a similar origin as the homogeneous band width described
above. Due to the coupling between modes (intermode anharmonicity), the IR band
associated with the mode i is shifted relative to the frequency ![]() (0),
that can only be attained when all the other modes are not populated. This temperature shift induces a consequent
broadening of the total band emitted during the cooling of PAHs, as was shown
in the case of the 3.3
(0),
that can only be attained when all the other modes are not populated. This temperature shift induces a consequent
broadening of the total band emitted during the cooling of PAHs, as was shown
in the case of the 3.3 ![]() m feature by Joblin et al. (1995).
m feature by Joblin et al. (1995).
Another cause of broadening is due to the anharmonicity of the modes themselves
(intramode anharmonicity; hot
bands as described by Barker et al. 1987). Indeed the transitions
![]() with v
with v ![]() 2 are
usually shifted relative to the fundamental
2 are
usually shifted relative to the fundamental
![]() transition. As a consequence, if the molecule is sufficiently heated to
populate the levels v
transition. As a consequence, if the molecule is sufficiently heated to
populate the levels v ![]() 2, the hot bands can create an additional
asymmetry in the total emitted feature.
2, the hot bands can create an additional
asymmetry in the total emitted feature.
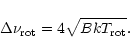
The values of the rotational constants of PAHs are very small. For
instance, the value of B for coronene is 0.011123 cm-1 (Cossart-Magos
& Leach 1990). It is smaller for larger PAHs since the
rotational constant is expected to scale as the inverse of the square of
the carbon number (Le Coupanec et al. 1998). As a result, the
rotational sub-structure is blurred by the other
broadening mechanisms. Only a global rotational envelope can be
observed. This is illustrated for instance by the gas-phase spectrum of
coronene at 770 K (Joblin et al. 1995).
The width of the
rotational envelope can be quantified by the separation of the maxima of
the P and R branches.
In this model, we have assumed that all PAHs have exactly the same IR
active modes. However, the exact positions of the modes are expected to
change from one PAH to the other and therefore to provide an additional
broadening to the observed spectra. This is well-known for small molecules
(
![]() )
but has still to be studied for larger systems
)
but has still to be studied for larger systems
![]() up to a few hundreds. The possible influence of molecular diversity on the
calculated spectrum is discussed in Sect. 3.3.
up to a few hundreds. The possible influence of molecular diversity on the
calculated spectrum is discussed in Sect. 3.3.
In the calculations, we aim to use as much as possible the photophysical
properties of PAHs derived from laboratory measurements. As mentioned earlier,
the relative intensities of the AIBs are more consistent with the carriers being PAH
cations rather than neutrals (Szczepanski & Vala 1993; DeFrees et al. 1993; Schutte et al. 1993;
Hudgins & Allamandola 1995; Langhoff 1996; Cook &
Saykally 1998). Laboratory data on PAH cations were therefore
used for the IR band strengths. For the band profiles, only data on
neutral PAHs are available. In all cases, the data concern 24-32 carbon
PAHs and we had to assume that the derived properties can be extrapolated to
larger systems (![]() 100 C).
100 C).
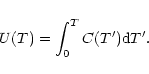
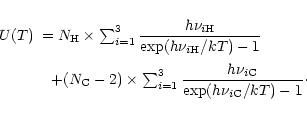
The exact calculation of the specific heat C(T) or the internal energy U(T) requires for each molecule the
whole set of vibrational frequencies. To simplify, three typical
frequencies have been associated with the C-C and C-H modes. The frequencies involving H atoms were readily determined as those of
the three IR active C-H modes at 3050, 1150 and 885 cm-1. For the C-C
bonds, three representative frequencies at 1499,
840 and 301 cm-1 were derived from the set of modes of dehydrogenated
coronene (Boissel et al. 1997). Considering that the
total number of modes 3N-6 can be split into 3
![]() C-H
modes, and 3(
C-H
modes, and 3(
![]() -2) C-C modes, Eq. (3)
can then be written as:
-2) C-C modes, Eq. (3)
can then be written as:
In the interstellar medium, PAHs are excited by UV photons from stars. In
this paper, we have considered the particular case of the planetary nebula IRAS 21282+5050. According to Cohen &
Jones (1987), the nebula is powered by a central star of spectral
type O7(f)-[WC11]. The flux ![]() from the star was taken from Kurucz
(1979) assuming a stellar temperature of 28 000 K (Leuenhagen &
Hamann 1998).
A data compilation on protoplanetary nebulae (Bujarrabal et al. 2001) gives the
distance (D=3 kpc) and the total luminosity (
from the star was taken from Kurucz
(1979) assuming a stellar temperature of 28 000 K (Leuenhagen &
Hamann 1998).
A data compilation on protoplanetary nebulae (Bujarrabal et al. 2001) gives the
distance (D=3 kpc) and the total luminosity (
![]() )
of this object. The maximum PAH emission is located at about 1'' from the central source (Meixner et al. 1993), e.g. at a
projected distance of the central source d*= 0.0145 pc. This
corresponds to a dilution factor of
)
of this object. The maximum PAH emission is located at about 1'' from the central source (Meixner et al. 1993), e.g. at a
projected distance of the central source d*= 0.0145 pc. This
corresponds to a dilution factor of
![]() and an
integrated UV photon flux of
and an
integrated UV photon flux of
![]()
![]() 3.7
3.7![]() 105
105
![]() ,
where
,
where
![]() is the average value for the
interstellar medium (
is the average value for the
interstellar medium (
![]() 1.6
1.6![]() 10-10 W cm-2; Habing
1968).
10-10 W cm-2; Habing
1968).
The rate of photons absorbed by PAHs is given by:
We have used the UV absorption cross-section
![]() measured by
Joblin et al. (1992) on mixtures of neutral PAHs. This cross section
consists of a far-UV rise, a broad feature centred at about 210 nm and a
tail extending down to 400 nm. There is not much data on the UV
cross-section of PAH cations. One study performed in boron oxide matrices
(Robinson et al. 1997) shows that PAH cations are likely to
have the same far-UV rise as neutral PAHs. In addition, PAH cations
have also relatively sharp absorption bands in the visible part of their
spectrum whose intensities and positions depend on the considered species
(Salama et al. 1995; Salama et al. 1999). However, in
the environment of a hot star, as considered here, the absorption in the
UV is largely dominant. The visible bands
of PAH cations were therefore not included and the UV-visible cross
section of a mixture of neutral PAHs was used (Fig. 1c from Joblin et al. 1992).
As shown by the authors, this UV cross section is proportional to the
number of carbon atoms. Figure 1 displays the absorption rate
of photons by PAHs in the environment of IRAS 21282+5050 as a function of
wavelengths. The total absorption rate is
measured by
Joblin et al. (1992) on mixtures of neutral PAHs. This cross section
consists of a far-UV rise, a broad feature centred at about 210 nm and a
tail extending down to 400 nm. There is not much data on the UV
cross-section of PAH cations. One study performed in boron oxide matrices
(Robinson et al. 1997) shows that PAH cations are likely to
have the same far-UV rise as neutral PAHs. In addition, PAH cations
have also relatively sharp absorption bands in the visible part of their
spectrum whose intensities and positions depend on the considered species
(Salama et al. 1995; Salama et al. 1999). However, in
the environment of a hot star, as considered here, the absorption in the
UV is largely dominant. The visible bands
of PAH cations were therefore not included and the UV-visible cross
section of a mixture of neutral PAHs was used (Fig. 1c from Joblin et al. 1992).
As shown by the authors, this UV cross section is proportional to the
number of carbon atoms. Figure 1 displays the absorption rate
of photons by PAHs in the environment of IRAS 21282+5050 as a function of
wavelengths. The total absorption rate is
![]() = 2.65
= 2.65![]() 10-4
10-4
![]() s-1.
s-1.
To calculate the IR spectrum emitted by a population of PAHs, it is
necessary to know their vibrational spectra including the band strengths
(in terms of Einstein coefficients) as well as the band positions and widths and their evolution with temperature.
Band strengths
The IR vibrational spectra of many PAHs![]() of sizes up to 32 carbon atoms are known.
We have therefore considered the two largest compact cations: coronene
C
of sizes up to 32 carbon atoms are known.
We have therefore considered the two largest compact cations: coronene
C
![]() H
H
![]() and ovalene C
and ovalene C
![]() H
H
![]() which have been studied experimentally (Szczepanski & Vala 1993; Hudgins & Allamandola
1995) and theoretically (Langhoff 1996).
The different IR modes for these species have been gathered together into the main
astrophysical features in order to derive Einstein Ai coefficients
for bands corresponding to the 3.3, 6.2, "7.7'', 8.6, 11.3 and 12.7
which have been studied experimentally (Szczepanski & Vala 1993; Hudgins & Allamandola
1995) and theoretically (Langhoff 1996).
The different IR modes for these species have been gathered together into the main
astrophysical features in order to derive Einstein Ai coefficients
for bands corresponding to the 3.3, 6.2, "7.7'', 8.6, 11.3 and 12.7 ![]() m AIBs. Classically, the
vibrations at 6.2 and "7.7''
m AIBs. Classically, the
vibrations at 6.2 and "7.7'' ![]() m are attributed to C-C stretching modes,
and the others to C-H modes. We note that the spectral
range 11.6-13
m are attributed to C-C stretching modes,
and the others to C-H modes. We note that the spectral
range 11.6-13 ![]() m includes the major feature at 12.7
m includes the major feature at 12.7 ![]() m and a
plateau in which minor bands can be observed (Hony et al. 2000). The classical interpretation
is that the 11.3
m and a
plateau in which minor bands can be observed (Hony et al. 2000). The classical interpretation
is that the 11.3 ![]() m band is due to solo H whereas bands at longer
wavelengths are attributed to other types of H (duo, trio, quatro;
Allamandola et al. 1989). We did not consider the
11.6-13
m band is due to solo H whereas bands at longer
wavelengths are attributed to other types of H (duo, trio, quatro;
Allamandola et al. 1989). We did not consider the
11.6-13 ![]() m plateau and put all the intensity into the 12.7
m plateau and put all the intensity into the 12.7 ![]() m band. In order to extrapolate the spectra to larger
sizes, we assumed that the Einstein coefficients Ai are proportional
to the number of C and H atoms for the C-C and C-H modes respectively. The
spectra of the PAH-like species considered in our model consist therefore
of bands at the positions of the interstellar
bands with Ai coefficients deduced from the C
m band. In order to extrapolate the spectra to larger
sizes, we assumed that the Einstein coefficients Ai are proportional
to the number of C and H atoms for the C-C and C-H modes respectively. The
spectra of the PAH-like species considered in our model consist therefore
of bands at the positions of the interstellar
bands with Ai coefficients deduced from the C
![]() H
H
![]() and
C
and
C
![]() H
H
![]() spectra and scaling with the number of
atoms (N
spectra and scaling with the number of
atoms (N
![]() or N
or N
![]() ;
cf. Table 1).
These values are quite comparable to those deduced by Schutte et al. (1993) in their standard model. In particular, the cross
sections of the 6.2, 7.7 and 8.6
;
cf. Table 1).
These values are quite comparable to those deduced by Schutte et al. (1993) in their standard model. In particular, the cross
sections of the 6.2, 7.7 and 8.6 ![]() m bands are significantly enhanced
compared to those of neutral PAHs.
m bands are significantly enhanced
compared to those of neutral PAHs.
| Molecule |
|
|
|
|
|
|
| (s
|
(s
|
(s
|
(s
|
(s
|
(s
|
|
| Generic spectrum a | 6.59 | 2.14 | 5.4 | 0.82 | 5.49 | 0.57 |
| Standard b | 8.95 | 0.93 | 2.68 | 0.82 | 1.87 | 0.58 |
In addition to the main AIBs, we have also considered two types of
bands measured on neutral PAHs but which have not been studied yet on PAH
cations. First, the overtone of the C-H stretch which has been measured in
the laboratory by Joblin (1992) and detected at 1.68 ![]() m in the object IRAS 21282+5050
(Geballe et al. 1994). The Einstein coefficient A20 measured for this
band is 1/6 of A10. Second, PAHs have modes in the far-infrared
domain that have to be included in the calculation of the
cooling process. Moutou et al. (1996) have reported the far-IR spectra
of many neutral PAHs. The positions of these bands are quite variable
from one molecule to the other. However, for compact PAHs, accumulation
points were found at 16, 18.2, 26 and 50
m in the object IRAS 21282+5050
(Geballe et al. 1994). The Einstein coefficient A20 measured for this
band is 1/6 of A10. Second, PAHs have modes in the far-infrared
domain that have to be included in the calculation of the
cooling process. Moutou et al. (1996) have reported the far-IR spectra
of many neutral PAHs. The positions of these bands are quite variable
from one molecule to the other. However, for compact PAHs, accumulation
points were found at 16, 18.2, 26 and 50 ![]() m. We have included these
bands in the calculations with Einstein coefficients corresponding to
the average values measured by Moutou et al. (1996) on compact
molecules: 0.057, 1.4
m. We have included these
bands in the calculations with Einstein coefficients corresponding to
the average values measured by Moutou et al. (1996) on compact
molecules: 0.057, 1.4![]() 10-2, 1.5
10-2, 1.5![]() 10-3 and
1.5
10-3 and
1.5![]() 10-2 (s-1/
10-2 (s-1/
![]() )
for the
)
for the
![]() ,
,
![]() ,
,
![]() and
and
![]() coefficients respectively.
coefficients respectively.
Widths and positions of the IR bands
The temperature dependence of the band positions and widths was studied on a
few gas-phase neutral molecules by Joblin et al. (1995). Due to the coupling between modes, the positions of
the IR bands shift towards lower frequencies as the temperature increases
and the band widths increase. Both effects appear to be linear at least in
the high-temperature range. They are expected to be general, independent of the PAH charge state. Temperature
laws for the bands' positions and widths were derived mostly from
measurements on neutral coronene (Joblin et al. 1995).
Compared to the authors' work, only the laws for the band widths were refined by subtracting the contribution of rotation
which was not negligible in these experiments at thermal equilibrium
(
![]() =
=
![]() ). Also, the band widths measured in neon matrices at 4 K (Joblin et al. 1994) were included before fitting the experimental
data points, in order to avoid negative widths at low temperatures.
In the case of the 3.3
). Also, the band widths measured in neon matrices at 4 K (Joblin et al. 1994) were included before fitting the experimental
data points, in order to avoid negative widths at low temperatures.
In the case of the 3.3 ![]() m band, a third-order polynomial had to be
included to fit the data at temperatures lower than 850 K. In all other
cases, a linear fit was found to be satisfactory with a maximum error of
10% for the 6.2
m band, a third-order polynomial had to be
included to fit the data at temperatures lower than 850 K. In all other
cases, a linear fit was found to be satisfactory with a maximum error of
10% for the 6.2 ![]() m band at 2000 K (cf. Fig. 2).
m band at 2000 K (cf. Fig. 2).
![\begin{figure}
\par\includegraphics[width=8.8cm,clip]{MS10311f2.eps}\end{figure}](/articles/aa/full/2002/23/aa10311/img85.gif) |
Figure 2:
Widths of the 3.3, 6.2 and 11.3 |
The temperature dependence of
the band positions and widths is summarized in Table 2. The
values are those of coronene and derivatives except for the position
![]() (0) of the 11.3
(0) of the 11.3 ![]() m band. Indeed, the position of the C-H out-of-plane bending
mode is very sensitive to the number of adjacent H. Coronene has only
duo H, whereas the 11.3
m band. Indeed, the position of the C-H out-of-plane bending
mode is very sensitive to the number of adjacent H. Coronene has only
duo H, whereas the 11.3 ![]() m band corresponds to solo H. We
therefore used the value of
m band corresponds to solo H. We
therefore used the value of
![]() (0) derived from measurements
on ovalene C
(0) derived from measurements
on ovalene C
![]() which contains 2
hydrogens solo (Joblin 1992; Joblin et al. 1994). The 6.2
which contains 2
hydrogens solo (Joblin 1992; Joblin et al. 1994). The 6.2 ![]() m band width of coronene was measured
to be rather constant with temperature, a behaviour which was peculiar
in all the measurements reported by Joblin et al. (1995) and
could be due to the high symmetry of the molecule. We therefore
used for this band the width and position measured for methyl-coronene
CH
m band width of coronene was measured
to be rather constant with temperature, a behaviour which was peculiar
in all the measurements reported by Joblin et al. (1995) and
could be due to the high symmetry of the molecule. We therefore
used for this band the width and position measured for methyl-coronene
CH
![]() -C
-C
![]() H
H
![]() ,
a closely related
molecule with lower symmetry (Joblin 1992).
The implication of the choice of the coefficients
,
a closely related
molecule with lower symmetry (Joblin 1992).
The implication of the choice of the coefficients
![]() (0),
(0), ![]() ,
,
![]() ,
,
![]() on the calculated IR spectrum is further discussed in
Sect. 3.1.
Table 2 also includes the anharmonic shifts used to calculate the positions of the
hot bands (transitions
on the calculated IR spectrum is further discussed in
Sect. 3.1.
Table 2 also includes the anharmonic shifts used to calculate the positions of the
hot bands (transitions
![]() ,
with
,
with ![]() )
according to:
)
according to:
| Band position | Band width | Hot band shift | |||
| (cm-1) | (cm-1) | (cm-1) | |||
| Band |
|
|
|||
| 3.3 |
3076 (a) | -3.2 |
-14.69 (*) | 3.8 |
120 (d) |
| 6.2 |
1627 (b) | -3.8 |
1.00 (b) | 2.30 |
5 (e) |
| 7.7 |
1326 (a) | -2.4 |
0.56 (a) | 8.3 |
- |
| 8.6 |
1141 (a) | -8.4 |
0.66 (a) | 1.14 |
- |
| 11.3 |
896 (c) | -2.3 |
0.54 (a) | 1.24 |
5 (e) |
The IR emission of a PAH-like species population is considered here. This
population is defined by the generic formula
C
![]() and a continuous size distribution given by a power
law
and a continuous size distribution given by a power
law
![]() between
between
![]() and
and
![]() .
The formula
C
.
The formula
C
![]() corresponds to compact species
when p is an integer (Omont 1986). We used steps of 2
carbons which correspond in the calculations to a non-integer (non-physical) value of
corresponds to compact species
when p is an integer (Omont 1986). We used steps of 2
carbons which correspond in the calculations to a non-integer (non-physical) value of
![]() .
.
In the following, the
notation {C
![]() } is given for the PAH-like
species of formula C
} is given for the PAH-like
species of formula C
![]() and whose
photophysical properties are described above. When considering a size
distribution, the three parameters:
and whose
photophysical properties are described above. When considering a size
distribution, the three parameters:
![]() ,
,
![]() and
and ![]() are reported. For instance, values of
are reported. For instance, values of
![]() 20,
20,
![]() 178 and
178 and ![]() 2 were used by
Désert et al. (1990) in their model. Finally, we assumed that
1/3 of hydrogen atoms are solo following Schutte et al. (1993).
2 were used by
Désert et al. (1990) in their model. Finally, we assumed that
1/3 of hydrogen atoms are solo following Schutte et al. (1993).
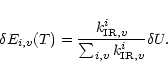
The internal energy of a given PAH is initialized at the value
![]() corresponding to the absorption of one UV photon. The
peak molecular temperature
corresponding to the absorption of one UV photon. The
peak molecular temperature
![]() is calculated from Eq. (3). The
molecule then cools down in its different i modes from different v levels
according to the emission rates given by Eq. (4). At each step
is calculated from Eq. (3). The
molecule then cools down in its different i modes from different v levels
according to the emission rates given by Eq. (4). At each step
![]() K, the internal energy changes by
K, the internal energy changes by ![]() and the fraction of
energy emitted in the transition
and the fraction of
energy emitted in the transition
![]() of the i mode is
given by:
of the i mode is
given by:
Copyright ESO 2002
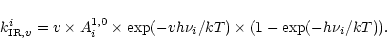
![\begin{displaymath}k_{{\rm IR}}^{i}=\sum_{v}k_{{\rm IR},v}^{i}=A^{1,0}_{i}\times\left[\exp(h\nu_{i}/kT)-1\right]^{-1}.
\end{displaymath}](/articles/aa/full/2002/23/aa10311/img45.gif)
![\begin{figure}
\par\includegraphics[width=8.8cm,clip]{MS10311f1.eps}\end{figure}](/articles/aa/full/2002/23/aa10311/img56.gif)