A&A 387, 244-257 (2002)
DOI: 10.1051/0004-6361:20020269
G. Gräfener1,2,3 - L. Koesterke1 - W.-R. Hamann1
1 - Institut für Physik, Astrophysik, Universität Potsdam, Am Neuen Palais 10, 14469
Potsdam, Germany
2 - Institute of Astronomy, ETH Zentrum SEC, Scheuchzer Str. 7, 8092
Zürich, Switzerland
3 - PMOD/WRC, 7260 Davos Dorf, Switzerland
Received 24 September 2001 / Accepted 20 February 2002
Abstract
We describe the treatment of iron group line-blanketing in non-LTE model atmospheres
for WR stars. As an example, a blanketed model for the early-type WC star WR 111 is
compared to its un-blanketed counterpart. Blanketing affects the ionization
structure and the emergent flux distribution of our models. The
radiation pressure, as computed within our models, falls short by only a factor of two to
provide the mechanical power of the WR wind.
Key words: stars: Wolf-Rayet - stars: atmospheres - stars: abundances - stars: early-type - stars: mass loss - stars: individual: WR 111
Non-LTE models for the expanding atmospheres of Wolf-Rayet (WR) stars became available more than a decade ago in the form of two codes developed independently by Hillier (1987a,b) and by the Kiel/Potsdam group (Hamann & Schmutz 1987). While the first model generations were restricted to pure-helium atmospheres, the more complex atoms of C, N and O were accounted for in later model versions (e.g. Hillier 1989; Koesterke & Hamann 1995). However, line blanketing by iron group elements was still neglected because of the extreme complexity of these multi-electron systems with their overwhelming number of spectral lines.
Utilizing a Monte Carlo technique, Schmutz (1991, 1997) showed that line-blanketing affects WR atmospheres fundamentally. By a large number of spectral lines, radiation is blocked in the far UV but escapes at longer wavelengths. This strongly influences the emergent energy distribution, the ionizing radiation field throughout the atmosphere, and the dynamics of WR winds.
Hillier & Miller (1998) were the first to include non-LTE line-blanketing in their WR models. These models have already been applied by several authors (Hillier & Miller 1999; Crowther et al. 2000; Dessart et al. 2000; Herald et al. 2001), primarily for the analysis of WC stars, which show the most complex spectra among the WR population. In the present paper, we now describe the implementation of iron group line-blanketing in the Potsdam/Kiel code for expanding stellar atmospheres, and demonstrate the effects by comparison of a blanketed WC star model with its un-blanketed counterpart.
The principal difficulty in dealing with iron is the complexity of the model atom. The iron
group data of Kurucz (1991) comprise about
![]() line transitions between several
thousands of energy levels. Therefore, a detailed non-LTE treatment, as being possible for a
few hundred levels and a few thousand lines of the CNO elements, is prohibitive for iron.
Instead we adopt the concept of super-levels, which was introduced by Anderson (1989, 1991)
and applied successfully by several authors (Dreizler & Werner 1993; Hubeny & Lanz 1995; Hillier & Miller 1998). In this approach,
the energy levels are represented by a much smaller number (of the order of 10 per ion) of
so-called "super-levels'' which then can be treated explicitly in non-LTE. When modeling
static atmospheres, line opacities may be re-arranged in frequency (cf. the technique of
opacity distribution functions, e.g. Carbon 1979). In expanding atmospheres, however,
neighboring frequencies are coupled by the Doppler effect. Therefore, in our radiation
transport all individual line transitions are calculated at their proper frequency.
line transitions between several
thousands of energy levels. Therefore, a detailed non-LTE treatment, as being possible for a
few hundred levels and a few thousand lines of the CNO elements, is prohibitive for iron.
Instead we adopt the concept of super-levels, which was introduced by Anderson (1989, 1991)
and applied successfully by several authors (Dreizler & Werner 1993; Hubeny & Lanz 1995; Hillier & Miller 1998). In this approach,
the energy levels are represented by a much smaller number (of the order of 10 per ion) of
so-called "super-levels'' which then can be treated explicitly in non-LTE. When modeling
static atmospheres, line opacities may be re-arranged in frequency (cf. the technique of
opacity distribution functions, e.g. Carbon 1979). In expanding atmospheres, however,
neighboring frequencies are coupled by the Doppler effect. Therefore, in our radiation
transport all individual line transitions are calculated at their proper frequency.
It is highly debated whether the driving of WR winds is achieved by the radiative acceleration alone. By our explicit treatment of all line opacities, the complex line-line interaction which leads to multiple photon scattering is fully accounted for. Our models thus allow for a realistic calculation of the radiation pressure.
Un-blanketed model calculations are not perfectly reproducing the observed spectra, especially for the WC subtypes. A large number of iron line transitions (Fe IV, Fe V and Fe VI) form a pseudo continuum in the UV, which dominates the observable energy distribution in that spectral region. Another problem is to reproduce the observed wide range of ionization stages. We will show that the line-blanketing models lead to a better agreement and hence more reliable spectral analyses.
In Sect. 2 we give an overview over the main assumptions and methods used in the atmosphere code. On this basis we describe in Sect. 3 the implementation of the super-level concept. In Sect. 4, the code is applied to the early-type WC star WR 111, and the effects of iron group line-blanketing on the model atmospheres are discussed.
The non-LTE spectrum formation is calculated for an expanding atmosphere under the standard assumptions of spherical symmetry, stationarity and homogeneity. The model calculations are in line with our previous work (Koesterke et al. 1992; Hamann et al. 1992; Koesterke & Hamann 1995; Leuenhagen & Hamann 1994; Leuenhagen et al. 1996; Hamann & Koesterke 1998). However, for the inclusion of iron group line-blanketing we had to modify our code extensively. In this section, we give a summarizing description of the method with special emphasize to those new features which concern the iron line-blanketing.
A model atmosphere is specified by the luminosity and radius of the stellar core at the inner
boundary, and by the chemical composition and the density- and velocity structure of the
envelope. For the stellar core the radius ![]() at Rosseland optical depth
at Rosseland optical depth
![]() and the stellar temperature
and the stellar temperature ![]() are prescribed.
are prescribed. ![]() is related to the
stellar luminosity
is related to the
stellar luminosity ![]() by Stefan-Boltzmann's law
by Stefan-Boltzmann's law
| Ion | Levels | Ion | Super-levels | Sub-levels | |
| He I | 17 | Fe III | 1 | ||
| He II | 16 | Fe IV | 18 | 30 122 | |
| He III | 1 | Fe V | 19 | 19 804 | |
| C I | 2 | Fe VI | 18 | 15 155 | |
| C II | 32 | Fe VII | 16 | 11 867 | |
| C III | 40 | Fe VIII | 10 | 8669 | |
| C IV | 54 | Fe IX | 11 | 12 366 | |
| C V | 1 | Fe X | 1 | ||
| O II | 3 | ||||
| O III | 33 | ||||
| O IV | 25 | ||||
| O V | 36 | ||||
| O VI | 15 | ||||
| O VII | 1 | ||||
| Si III | 10 | ||||
| Si IV | 7 | ||||
| Si V | 1 |
Density-inhomogeneities (clumping) are accounted for in the limit of small-scale clumps with a
density enhanced by a factor D = 1/fV over the mean density ![]() (see Schmutz 1995; Hillier 1996; Hamann & Koesterke 1998). The inter-clump medium is supposed to be void. The
radiation transport is calculated for the spatially averaged opacity, whereas the statistical
equations are solved for the enhanced density in the clumps.
(see Schmutz 1995; Hillier 1996; Hamann & Koesterke 1998). The inter-clump medium is supposed to be void. The
radiation transport is calculated for the spatially averaged opacity, whereas the statistical
equations are solved for the enhanced density in the clumps.
For models with the same stellar temperature ![]() ,
the strength of emission lines depends
mainly on the so-called transformed radius
,
the strength of emission lines depends
mainly on the so-called transformed radius ![]() ,
which is defined as
,
which is defined as
The chemical composition is given by mass fractions
![]() ,
,
![]() ,
,
![]() ,
,
![]() and
and
![]() of helium, carbon, oxygen, silicon and iron group elements. The
model atoms contain the ionization stages He I-He III, C I-C V, O II-O VII, Si III-Si V and Fe III-Fe X. Except for He I and Si III, the lowest
and highest ionization stages are restricted to a few auxiliary levels. A summarizing
description of the model atoms is given in Table 1.
of helium, carbon, oxygen, silicon and iron group elements. The
model atoms contain the ionization stages He I-He III, C I-C V, O II-O VII, Si III-Si V and Fe III-Fe X. Except for He I and Si III, the lowest
and highest ionization stages are restricted to a few auxiliary levels. A summarizing
description of the model atoms is given in Table 1.
Due to the iron group elements, almost the whole spectral range is crowded by lines. Therefore, we abandon the distinction between continuum- and spectral line transfer used in our previous code. Analogous to the work of Hillier & Miller (1998), the radiation transfer is now calculated on one comprehensive frequency grid, which covers the whole relevant frequency range with typically three points per Doppler width wherever line opacities are present, and a wider spacing in pure-continuum regions.
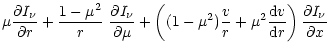
The equation of radiative transfer in a spherically-expanding atmosphere is formulated in the
co-moving frame of reference, neglecting aberration and advection terms (Mihalas et al. 1976a). The
angle dependent transfer equation then becomes a partial differential equation for the
intensity ![]() ,
,
In the present work, the numerical solution of Eq. (4) is achieved by a
short-characteristic method, described in detail in Koesterke et al. (2002). However, as the
angle-dependent equation is computationally expensive, and because of the drawback with the
Thomson-scattering term, we employ the "method of variable Eddington factors''
(Auer & Mihalas 1970). This means, the angle-dependent transfer equation is only solved from time to
time (typically every six ALI iteration cycles). The resulting intensities ![]() at each
radius and frequency grid point are integrated up over angles with weight factors
at each
radius and frequency grid point are integrated up over angles with weight factors ![]() ,
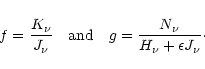
yielding the nth moments of the radiation field J, H, K and N for n = 0, 1, 2 and
3, respectively. Only the Eddington factors f and g are finally exploited from that step,
which are defined as
,
yielding the nth moments of the radiation field J, H, K and N for n = 0, 1, 2 and
3, respectively. Only the Eddington factors f and g are finally exploited from that step,
which are defined as
Based on these Eddington factors, the radiative transfer is solved in each ALI iteration cycle
by means of the moment equations. By integration of Eq. (4) over ![]() (weighted with
(weighted with ![]() and
and ![]() respectively), one obtains the zeroth and first moment
equation as
respectively), one obtains the zeroth and first moment
equation as
After the moments ![]() and
and ![]() are substituted in Eqs. (6) and (7) with the help of the Eddington factors (Eq. (5)), these are
solved by a differencing scheme as proposed by Mihalas et al. (1976b).
are substituted in Eqs. (6) and (7) with the help of the Eddington factors (Eq. (5)), these are
solved by a differencing scheme as proposed by Mihalas et al. (1976b).
In the ALI formalism, the consistent solution of the equations of statistical equilibrium and the radiative transfer equation is achieved iteratively by solving both sets of equations in turn. However, in order to obtain convergence it is necessary to "accelerate'' the iteration by incorporating some "approximate'' radiative transfer into the statistical equation, which at least accounts for the locally trapped radiation in optically thick situations.
In the present work we use the concept of Hamann (1985, 1986). However, our definition of the diagonal "approximate lambda operators'' must be modified and extended with respect to the iron-line opacities, as we will describe in the following.
As in Hamann (1986), the atomic population numbers ![]() are calculated at each depth
point from the equations of statistical equilibrium, which are of the form
are calculated at each depth
point from the equations of statistical equilibrium, which are of the form
 |
(8) |
This set of nonlinear equations is solved numerically by the application of a hybrid technique,
a combination of the Broyden and the Newton algorithm (Hamann 1987; Koesterke et al. 1992). For this
purpose the Jacobian matrix
![]() must be calculated
occasionally, and the derivatives
must be calculated
occasionally, and the derivatives
![]() must be provided for
all relevant transitions.
must be provided for
all relevant transitions.
The calculation of the
![]() and their derivatives is modified in
comparison to Hamann (1985). For line transitions we keep the core saturation approach but
utilize the "diagonal operator'' of Rybicki & Hummer (1991) for the core integration, additionally
accounting for the interaction with blending iron opacities. The continuum and iron
transition rates are also calculated using the diagonal operator but in the "standard''
approach, i.e. the full frequency integral is performed (see Sect. 3.3
for iron transitions).
and their derivatives is modified in
comparison to Hamann (1985). For line transitions we keep the core saturation approach but
utilize the "diagonal operator'' of Rybicki & Hummer (1991) for the core integration, additionally
accounting for the interaction with blending iron opacities. The continuum and iron
transition rates are also calculated using the diagonal operator but in the "standard''
approach, i.e. the full frequency integral is performed (see Sect. 3.3
for iron transitions).
The diagonal operator provides the local response of the radiation field on the population numbers as a by-product of the radiative transfer. By applying it to the discretized moment Eqs. (6) and (7), we obtain the response on the true source function, fully accounting for coherent scattering.
In discretized form ![]() is represented by a vector
is represented by a vector ![]() on the radial depth grid
at the corresponding frequency index k, and the first moment vector
on the radial depth grid
at the corresponding frequency index k, and the first moment vector ![]() is defined on
the radius interstices. After elimination of
is defined on
the radius interstices. After elimination of ![]() by substitution of
Eq. (7) into Eq. (6) one obtains a second order equation of the
form
by substitution of
Eq. (7) into Eq. (6) one obtains a second order equation of the
form
At this point it is possible to extract the diagonal
![]() ,
which describes the local response of the radiation field on the
source function, i.e.
,
which describes the local response of the radiation field on the
source function, i.e.
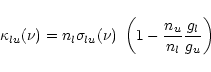
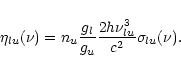
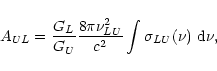
For a line transition between the energy levels l and u, the radiation field enters the
radiative rates via the scattering integral
The derivatives
![]() are calculated directly from
Eq. (12)
are calculated directly from
Eq. (12)
 |
(13) |
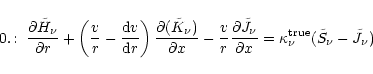
The temperature stratification has to be derived from the equation of radiative equilibrium in
the co-moving frame
A sufficient model accuracy is reached when the correction between consecutive ALI iterations drops below 1%. The convergence properties depend strongly on the start model. In practice it is often possible to choose start models which are already close to the solution. In such a case about 40 iterations are needed to obtain convergence. For a model which is started from LTE, this number can increase by a factor of 10. In the case of the line blanketed WC model in Sect. 4 (70 depth points, 396 levels, 36 210 frequencies) 24 iterations are needed from a "good'' start model, whereas 300 iterations are necessary for an LTE start. The computing time per ALI iteration cycle ranges from 150 to 350 s on a Compaq Alpha XP1000/667 workstation.
The numerical solution of the statistical equations is limited to model atoms with a few hundred energy levels. However, the complex electron configurations of the iron group elements would require thousands of energy levels for a detailed description. For this reason, a simplified treatment is necessary. In the present work we adopt the concept of super-levels, which has originally been proposed by Anderson (1989).
In this approximation a large number of atomic energy levels (termed "sub-levels'' in the following) is represented by a small number of "super-levels''. Each transition between two super-levels comprises a large number of atomic line transitions ("sub-lines''). In the radiation transport, all sub-lines must be treated at their proper frequency because of the frequency coupling in expanding atmospheres. So in contrast to static atmospheres, no sampling or re-ordering techniques can be applied. Instead, each super-line has a complicated "profile function'' which is a superposition of all sub-lines involved.
The preparation of the model atom and the transition cross sections in the present work is based on the work of Dreizler & Werner (1993). The complete iron group data of Kurucz (1991), with some 107 line transitions between several thousands of energy levels, are represented by model atoms with 10-20 super-levels per ionization stage.
In the following, we describe the construction of the model atom (Sect. 3.1), the representation of opacities and emissivities in the radiation transport (Sect. 3.2), and the corresponding transition probabilities in the statistical equations (Sect. 3.3).
| Element X | Z |
|
| Sc | 21 |
|
| Ti | 22 |
|
| V | 23 |
|
| Cr | 24 |
|
| Mn | 25 |
|
| Fe | 26 | 1.0 |
| Co | 27 |
|
| Ni | 28 |
|
![\begin{figure}
\par\includegraphics[width=8cm,clip]{h3177f1.ps}\end{figure}](/articles/aa/full/2002/19/aah3177/img95.gif) |
Figure 1:
Ionization stage V of the generic model atom. The sum of the statistical weights of theconsidered atomic energy levels is plotted in bins of
|
| Open with DEXTER | |
For the construction of the model atom, the atomic energy levels from the Kurucz data (Kurucz 1991) are divided into energy bands BL, each of which is represented by a super-level L. The relative occupation of the sub-levels whithin each energy band is assumed to be in LTE, corresponding to a temperature T. In the present section we do not specify this temperature and work out the expressions for the super-level energies and statistical weights for the general case (in Sect. 3.2 we will give a detailed discussion of this point).
Owing to the similarities in the electron configurations, it is even possible to represent the whole iron group by one generic model atom (Dreizler & Werner 1993; Haas et al. 1996). In this case, the energy levels of different elements i are weighted corresponding to their relative abundances ai(Table 2). The advantage of this approach is the computationally cheap consideration of all important iron group opacities. The disadvantage is the loss of accuracy concerning the modeling of the detailed atomic processes.
Under the assumption of LTE, the relative occupation of the sub-levels within an
energy band is
 |
(15) |
 |
(16) |
| EL(T) | = |  |
|
| = |  |
(17) |
For a sub-line between sub-levels l and u the opacity ![]() and emissivity
and emissivity ![]() are
given by
are
given by
 |
(21) |
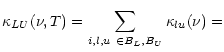
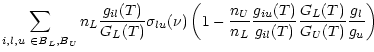
The opacities and emissivities for transitions between super-levels ("super-lines'') are
obtained by adding up the opacities and emissivities of the involved sub-lines. For given
super-level populations nL and nU the sub-level populations nl and nu are
calculated from Eq. (18), and we obtain
 |
(24) |
Note that the energies, statistical weights and cross sections for super-levels and super-lines
depend on the temperature T, which has not yet been specified. Due to the large number of
spectral lines accounted for (![]() 107), a relatively large amount of computing time is
needed for the calculation of the
107), a relatively large amount of computing time is
needed for the calculation of the
![]() .
Therefore, we calculate the
.
Therefore, we calculate the
![]() ,
EL and GL in advance to the atmosphere calculations for fixed excitation temperatures.
By this, we also avoid to handle the super-level energies, statistical weights and composite
cross sections as being dependent on temperature and hence on radius. In our subsequent
notation we will omit the explicit temperature dependences in these expressions.
,
EL and GL in advance to the atmosphere calculations for fixed excitation temperatures.
By this, we also avoid to handle the super-level energies, statistical weights and composite
cross sections as being dependent on temperature and hence on radius. In our subsequent
notation we will omit the explicit temperature dependences in these expressions.
The excitation temperatures are chosen as a typical ionization temperature for each
ion. Starting from values obtained from the Saha equation for typical densities, they are
iterated in the present work to match the local electron temperature ![]() for the main
ionization stages of the model presented in Sect. 4. The exact choice of the
excitation temperatures turned out not to be critical.
for the main
ionization stages of the model presented in Sect. 4. The exact choice of the
excitation temperatures turned out not to be critical.
With T set to a fixed excitation temperature, the direct application of
Eqs. (22) and (23) is not possible anymore, because in the
LTE-limit the line source function
![]() does not match the Planck
function
does not match the Planck
function
![]() ,
which would lead to severe problems at large depth. We
circumvent these problems by inserting the local electron temperature
,
which would lead to severe problems at large depth. We
circumvent these problems by inserting the local electron temperature ![]() into the
exponential terms in these equations, i.e. the EL, GL and
into the
exponential terms in these equations, i.e. the EL, GL and
![]() are evaluated
for the excitation temperature T, but
are evaluated
for the excitation temperature T, but
![]() and
and ![]() remain compatible to
remain compatible to
![]()
Hence our super-level treatment implies the following approximations: (1) relative population
numbers within each super-level according to Boltzmann's formula (LTE), (2) evaluation of these
relative population numbers with an approximate temperature, (3) neglect of lines between
sub-levels within the same super-level. Clearly, the higher the number of super-levels, i.e.
the smaller their energy bandwidth, the less is the error. Note that the approximations affect
the way how the atomic cross sections are combined, but do not introduce any inconsistencies.
![\begin{figure}
\par\includegraphics[width=8.8cm,clip]{h3177f2.ps}\end{figure}](/articles/aa/full/2002/19/aah3177/img125.gif) |
Figure 2:
Super-line cross section
|
| Open with DEXTER | |
In analogy to the lines, the continuum cross sections of the iron group elements are also added
up to a composed cross section for each super level. If available, data from the Opacity
Project (Seaton et al. 1992; Cunto & Mendoza 1992) are used. Otherwise the continua are treated in hydrogenic
approximation under the assumption of an effective principal quantum number
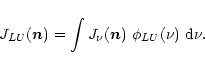
The radiative rate coefficients are calculated consistently to the opacities and emissivities
in Eqs. (26) and (27) by dividing the terms under the integral by
![]() in oder to convert energies into photon numbers. For spontaneous emission processes we
get from Eq. (27)
in oder to convert energies into photon numbers. For spontaneous emission processes we
get from Eq. (27)
For that purpose, we define effective Einstein coefficients AUL, mean intensities
![]() ,
and their derivatives
,
and their derivatives
![]() .
The
rate integrals (Eqs. (30), (31), and (32)) are
simplified by substituting
.
The
rate integrals (Eqs. (30), (31), and (32)) are
simplified by substituting ![]() by the mean frequency
by the mean frequency ![]() (Eq. (25)) in all
slowly varying terms (i.e. except in
(Eq. (25)) in all
slowly varying terms (i.e. except in ![]() and
and
![]() ). Because the cross
sections have a limited bandwidth, in most cases with a pronounced maximum around
). Because the cross
sections have a limited bandwidth, in most cases with a pronounced maximum around ![]() ,
this substitution does not affect the rate coefficients considerably. The approximate rate
coefficients are
,
this substitution does not affect the rate coefficients considerably. The approximate rate
coefficients are
 |
(33) |
 |
(34) |
Collisional cross sections are calculated by application of the generalized formula of van Regemorter (1962) to the effective Einstein coefficients AUL (Eq. (35)).
WR stars usually show a whole "forest'' of iron lines in the UV shortward of
![]()
![]() (see e.g. Herald et al. 2001). One of the best studied objects among
these stars is the WC 5 star WR 111. It has already been analyzed in detail by
Hillier & Miller (1999) utilizing their line-blanketed models. Therefore it shall also serve here as
the prototype for a first application of our code, examining the effects of line-blanketing.
(see e.g. Herald et al. 2001). One of the best studied objects among
these stars is the WC 5 star WR 111. It has already been analyzed in detail by
Hillier & Miller (1999) utilizing their line-blanketed models. Therefore it shall also serve here as
the prototype for a first application of our code, examining the effects of line-blanketing.
In the present section we present a model for WR 111 with solar iron abundance and compare it to a similar model with zero iron abundance. The model calculations are described in Sect. 4.1, and the results are discussed with regard to the emergent flux distribution (Sect. 4.2), the ionization stratification (Sect. 4.3), and the wind dynamics (Sect. 4.4).
![\begin{figure}
\par\includegraphics[width=15.7cm,clip]{h3177f3.ps}\end{figure}](/articles/aa/full/2002/19/aah3177/img150.gif) |
Figure 3:
Spectral fit for WR 111. The observation (thin line) is shown together
with the synthetic spectrum (thick line). The model parameters are compiled in
Table 3. Prominent spectral lines are identified. The observed flux has been
divided by the reddened model continuum for normalization. A correction for interstellar
Ly |
| Open with DEXTER | |
![\begin{figure}
\par\parbox[b]{0.66\textwidth}{\epsfxsize=0.63\textwidth \epsffile{h3177f4.ps}}
\parbox[b]{0.33\textwidth}{
}
\end{figure}](/articles/aa/full/2002/19/aah3177/img152.gif) |
Figure 4:
Comparison of the observed spectrum of WR 111 (dashed black line) and the model flux.
A distance modulus of 11.0 mag and interstellar reddening with
|
| Open with DEXTER | |
![\begin{figure}
\par\parbox[b]{0.66\textwidth}{\epsfxsize=0.63\textwidth \epsffile{h3177f5.ps}}
\parbox[b]{0.33\textwidth}{
}
\end{figure}](/articles/aa/full/2002/19/aah3177/img155.gif) |
Figure 5:
Energy distribution in the flux maximum.
The model flux in the CMF (grey) is compared to the model continuum (black), and the
de-reddened observation of WR 111 (black, dashed). Below |
| Open with DEXTER | |
|
|
|
|
|
|
|
|
|
|
|
|
|
|
|
| D | 10 |
|
|
|
|
|
|
| 0.45 | |
| 0.04 | |
|
|
|
|
|
|
| M - m |
|
| EB-V |
|
|
|
Observational data for WR 111 are retrieved from the following sources. The UV data are from the IUE satellite, retrieved from the INES database (http://ines.vilspa.esa.es). Optical spectra come from the atlas of Torres & Massey (1987). In addition, optical narrow-band colors (b, v) from Lundström & Stenholm (1984) are considered. Infrared continuum fluxes are given by Eenens & Williams (1992), obtained from broad-band photometry and corrected for the contribution of emission lines. The line-blanketed model spectrum is compared to the observations in Fig. 3 (lines), Fig. 4 (flux distribution in the UV and optical) and Fig. 6 (IR and optical photometry).
For the spectral analysis the mass fractions of silicon and iron are set to solar values and a
distance modulus of 11.0 mag is adopted, which corresponds to a distance of 1.58 kpc
(see discussion in Hillier & Miller 1999). The Doppler broadening velocity is set to
![]() which reproduces well the blue shifted absorptions of P-Cygni type line profiles. The
density contrast D (clumping) is estimated by fitting the line wings of highly excited ions
(He II and C IV). The value of D=10, which reduces the derived mass loss rates by a
factor of
which reproduces well the blue shifted absorptions of P-Cygni type line profiles. The
density contrast D (clumping) is estimated by fitting the line wings of highly excited ions
(He II and C IV). The value of D=10, which reduces the derived mass loss rates by a
factor of ![]() ,
is commonly accepted for early-type WC stars
(Hillier 1996; Hamann & Koesterke 1998; Hillier & Miller 1999).
,
is commonly accepted for early-type WC stars
(Hillier 1996; Hamann & Koesterke 1998; Hillier & Miller 1999).
The C III/C IV ionization structure is determined by means of spectral lines of C III (e.g.
1620, 1923, 2010, 2297, 4650, 5696 and 6750 Å) versus C IV (e.g. 2405, 2525, 2595, 2699
and 5812 Å). These lines are reproduced well, except for C III 2297 Å (which
is mainly fed by dielectronic recombination) and the classification line C III 5696 Å.
Simultaneously, the ratio
![]() is derived from the neighboring lines
He II/C IV 5412/5470 Å, the He II lines at 1640, 2734 and 3204 Å, and the He II
Pickering series.
is derived from the neighboring lines
He II/C IV 5412/5470 Å, the He II lines at 1640, 2734 and 3204 Å, and the He II
Pickering series.
For the determination of the oxygen mass fraction ![]() ,
ionization stages O III to O V
(O III 3120, 3270, 3961 Å, the O III/O IV/C IV complex around 3700 Å, O III/O VI at
5270 Å, O III/O V at 5590 Å, O IV 3070 and 3410 Å, and O V at 3146 and 5114 Å)
are used. Most of these lines fit very well, except O III 3120 and 3961 Å. One of these two
lines, O III 3120 Å, is a Bowen emission line (Bowen 1935), i.e. it shares a common
upper level with O III 303.6 Å, and is therefore pumped by interaction with the He II
resonance line at 303.8 Å. As demonstrated by Schmutz (1997), this effect is sensitive to
the value of the He II 303.8 profile function at the frequency of the O III 303.6 blend. The
difficulties with O III 3120 Å may therefore arise from the simplified treatment of line
broadening by pure Doppler profiles.
,
ionization stages O III to O V
(O III 3120, 3270, 3961 Å, the O III/O IV/C IV complex around 3700 Å, O III/O VI at
5270 Å, O III/O V at 5590 Å, O IV 3070 and 3410 Å, and O V at 3146 and 5114 Å)
are used. Most of these lines fit very well, except O III 3120 and 3961 Å. One of these two
lines, O III 3120 Å, is a Bowen emission line (Bowen 1935), i.e. it shares a common
upper level with O III 303.6 Å, and is therefore pumped by interaction with the He II
resonance line at 303.8 Å. As demonstrated by Schmutz (1997), this effect is sensitive to
the value of the He II 303.8 profile function at the frequency of the O III 303.6 blend. The
difficulties with O III 3120 Å may therefore arise from the simplified treatment of line
broadening by pure Doppler profiles.
The O VI lines at 3811 and 5270 Å are not reproduced simultaneously with C III. A similar discrepancy is already known for the O VI resonance line in O-star atmospheres. For O-stars, it can be resolved by the inclusion of an additional X-ray emissivity from shock heated material (Pauldrach et al. 1994). Preliminary model calculations show evidence, that the inclusion of an X-ray emission according to Raymond & Smith (1977) has significant influence on the O VI lines in WC stars. If already marginally visible in the emergent spectrum, these lines can be strengthened by a factor of about two.
The derived model parameters are listed in Table 3. Compared to the work of
Hillier & Miller we obtain similar values for the stellar temperature ![]() (85 kK vs.
90 kK), the terminal wind velocity
(85 kK vs.
90 kK), the terminal wind velocity ![]() (2200 km s-1 vs. 2300 km s-1), the clumping factor
D=10, and the carbon mass fraction
(2200 km s-1 vs. 2300 km s-1), the clumping factor
D=10, and the carbon mass fraction
![]() ,
whereas we find a considerably lower
oxygen mass fraction (
,
whereas we find a considerably lower
oxygen mass fraction (
![]() vs. 0.15), and a higher luminosity (
vs. 0.15), and a higher luminosity (
![]() vs.
vs.
![]() ).
).
For a comparison of the derived mass loss rates (
![]() vs.
vs.
![]() )
it is necessary to consider the different luminosities of both models.
From Eq. (3) follows that the spectroscopic mass loss rates scale as
)
it is necessary to consider the different luminosities of both models.
From Eq. (3) follows that the spectroscopic mass loss rates scale as
![]() ,
i.e. our value of
,
i.e. our value of
![]() would scale
down to a considerably lower value of
would scale
down to a considerably lower value of
![]() for a luminosity of
for a luminosity of
![]() and
and
![]() .
.
![\begin{figure}
\par\includegraphics[width=8.8cm,clip]{h3177f6.ps}
\end{figure}](/articles/aa/full/2002/19/aah3177/img180.gif) |
Figure 6:
Comparison of the model continuum to optical and infrared photometry (grey blocks). A
distance modulus of 11.0 mag and interstellar reddening with
|
| Open with DEXTER | |
As shown in Fig. 4 the emergent flux of our model reproduces very well the
observed energy distribution in the optical and UV spectral range. In the infrared
(Fig. 6) the measured continuum fluxes of Eenens & Williams (1992) lie about
0.1 dex above the model flux. Because Hillier & Miller use a lower reddening parameter, they
encounter an even higher discrepancy in the infrared (![]()
![]() ), and resolve
it through the application of a non-standard extinction law (Cardelli et al. 1988).
), and resolve
it through the application of a non-standard extinction law (Cardelli et al. 1988).
As recognized first by Koenigsberger & Auer (1985), the "iron forest'' of emission and absorption lines of
Fe IV, Fe V and Fe VI forms a pseudo continuum below ![]()
![]() (see
Fig. 4). The blanketed model spectra therefore show a steeper apparent
continuum slope in the UV. Consequently, a higher reddening parameter - with respect to
un-blanketed models - must be adopted to reproduce the observed flux distribution. As a result
the derived stellar luminosity is increased. On the other hand the flux in the far UV is
blocked by iron lines, and is redistributed to the UV (see Fig. 5), which
leads to lower derived luminosities. In total, recent studies (Crowther et al. 2000; Dessart et al. 2000) show a
trend to derive higher luminosities for WC stars when line-blanketed models are applied.
(see
Fig. 4). The blanketed model spectra therefore show a steeper apparent
continuum slope in the UV. Consequently, a higher reddening parameter - with respect to
un-blanketed models - must be adopted to reproduce the observed flux distribution. As a result
the derived stellar luminosity is increased. On the other hand the flux in the far UV is
blocked by iron lines, and is redistributed to the UV (see Fig. 5), which
leads to lower derived luminosities. In total, recent studies (Crowther et al. 2000; Dessart et al. 2000) show a
trend to derive higher luminosities for WC stars when line-blanketed models are applied.
In the present work we derive values of
![]() and
EB-V=0.325 mag
for WR 111 using the standard extinction law of Seaton (1979). Hillier & Miller derive a
lower luminosity of
and
EB-V=0.325 mag
for WR 111 using the standard extinction law of Seaton (1979). Hillier & Miller derive a
lower luminosity of
![]() with
EB-V = 0.30 mag, and Koesterke & Hamann (1995)
deduce a luminosity of
with
EB-V = 0.30 mag, and Koesterke & Hamann (1995)
deduce a luminosity of
![]() with
EB-V = 0.25 mag based on
un-blanketed models. Obviously, the derived luminosity depends on the treatment of iron group
line-blanketing, as it affects the emergent flux distribution considerably. In addition,
uncertainties arise from the interstellar extinction law. In the UV below
with
EB-V = 0.25 mag based on
un-blanketed models. Obviously, the derived luminosity depends on the treatment of iron group
line-blanketing, as it affects the emergent flux distribution considerably. In addition,
uncertainties arise from the interstellar extinction law. In the UV below ![]()
![]() the extinction law of Cardelli et al. (1988) applied by Hillier & Miller shows
substantial differences compared with Seaton (1979).
the extinction law of Cardelli et al. (1988) applied by Hillier & Miller shows
substantial differences compared with Seaton (1979).
The ionizing fluxes from our model compare very well to the blanketed model of
Hillier & Miller (as listed in Dessart et al. 2000) after a scaling by 0.15 dex due to the
difference in luminosity is performed. For the number of Lyman continuum photons we obtain a
value of
![]() compared to
compared to
![]() from
Hillier & Miller, and for the number of He I photons we get a slightly higher value of
from
Hillier & Miller, and for the number of He I photons we get a slightly higher value of
![]() compared to
compared to
![]() .
The comparison to our
un-blanketed model shows that line blanketing diminishes the number of He I photons by
0.26 dex (compared to
.
The comparison to our
un-blanketed model shows that line blanketing diminishes the number of He I photons by
0.26 dex (compared to
![]() for the un-blanketed model), whereas the
number of Lyman continuum photons is nearly unaffected (
for the un-blanketed model), whereas the
number of Lyman continuum photons is nearly unaffected (
![]() vs.
vs.
![]() ). The small discrepancy in the number of He I photons compared
to Hillier & Miller might be explained by the different oxygen abundances.
). The small discrepancy in the number of He I photons compared
to Hillier & Miller might be explained by the different oxygen abundances.
![\begin{figure}
\par\parbox[b]{11cm}{\epsfxsize=0.63\textwidth \epsffile{h3177f7.ps}}\hfill%
\parbox[b]{6cm}{
}
\end{figure}](/articles/aa/full/2002/19/aah3177/img192.gif) |
Figure 7: The populations of the ground states of the included ions are plotted over the atomic density as a depth index. The line-blanketed model for WR 111 (solid black) is compared to its un-blanketed counterpart (dashed grey). In the outer part of the envelope the recombination from C IV to C III is considerably enhanced. |
| Open with DEXTER | |
In Fig. 7 the ionization stratification of the blanketed model is compared to
its un-blanketed counterpart. The most striking effect of line-blanketing is the enhanced
recombination from C IV to C III in the outer part of the wind, where the
population of the C III ground state is increased from ![]() 10-3 up to
10-3 up to ![]() 1.
The emergent C III line emissions are strengthened by a factor of
1.
The emergent C III line emissions are strengthened by a factor of ![]() 2 (with strong
scatter) compared to the un-blanketed model. The other ions are also affected, but the
corresponding changes are of minor importance for the spectral appearance of the models.
2 (with strong
scatter) compared to the un-blanketed model. The other ions are also affected, but the
corresponding changes are of minor importance for the spectral appearance of the models.
Because the line emission of WR stars is dominated by recombination processes, the emission line intensity is basically a measure for the wind density and therefore also for the mass loss rate. For this reason the enhanced recombination leads to a reduction of the derived mass loss rates.
In the outer part of the wind the electron temperature is only marginally changed (cf. Fig. 8). The back warming effect, which results from the increase of the Rosseland mean opacity, appears in the optically thick part of the envelope. In these layers the temperature is increased by about 20% without effect on the model spectrum. The changes in ionization result from very complex radiative interactions between the different ions. Therefore the various effects can not be clearly separated. Nevertheless, a closer inspection allows some interpretations.
The ionization from C III to C IV is strongly influenced by shading effects. At the
relevant depth the radiation field below ![]() 320 Å is effectively blocked by a large
number of iron group lines. Therefore the ionization of C III (ionization edge at
258 Å) is strongly reduced. Test calculations show that the ionization stratification of
carbon changes significantly if only iron line-blanketing is accounted for and the rest of the
iron group elements is omitted. Probably this effect is responsible for the higher mass loss
rate derived by Hillier & Miller. Because these authors do not account for the whole iron group
they obtain a weaker recombination which is compensated by a higher wind density.
320 Å is effectively blocked by a large
number of iron group lines. Therefore the ionization of C III (ionization edge at
258 Å) is strongly reduced. Test calculations show that the ionization stratification of
carbon changes significantly if only iron line-blanketing is accounted for and the rest of the
iron group elements is omitted. Probably this effect is responsible for the higher mass loss
rate derived by Hillier & Miller. Because these authors do not account for the whole iron group
they obtain a weaker recombination which is compensated by a higher wind density.
![\begin{figure}
\par\includegraphics[width=8cm,clip]{h3177f8.ps} %\end{figure}](/articles/aa/full/2002/19/aah3177/img193.gif) |
Figure 8: Temperature structure for the model including line-blanketing (solid line) and the un-blanketed model (dashed line). The temperature in the optically thick part of the blanketed model is increased by the back-warming effect of the additional opacities. |
| Open with DEXTER | |
Obviously the inclusion of the complete iron group is of some importance, but the simplified treatment as one generic element is a questionable approximation. Especially, different ionization and excitation conditions may result when the detailed atomic models are accounted for separately. The splitting of the iron group into different model atoms will therefore be a subject of our future work.
The main ionization stages of iron in the outer envelope are Fe V and Fe VI with ionization
edges at 165 Å and 128 Å. In the regions where He II or C IV with edges at
228 Å and 192 Å are the leading ions, the ionization of iron is only possible from
highly excited energy levels. Actually this is the case because of the metastable nature of the
low lying iron levels (cf. Sect. 3.1). From Fig. 1 it can
be seen that for Fe V the levels up to ![]() 1/3 of the ionization energy are of same
parity, and are therefore supporting the ionization of Fe V.
1/3 of the ionization energy are of same
parity, and are therefore supporting the ionization of Fe V.
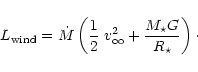
For a radiation driven wind, the average number of scatterings before a photon escapes from the
atmosphere is indicated by the wind efficiency
![]() .
In
former model calculations for WC stars values of
.
In
former model calculations for WC stars values of
![]() are derived
(Koesterke & Hamann 1995; Gräfener et al. 1998). Even though multiple photon scattering might be efficient in spectral
regions with a very high line density, these high values led to the question if the mass loss
of WR stars can be driven by radiation pressure alone.
are derived
(Koesterke & Hamann 1995; Gräfener et al. 1998). Even though multiple photon scattering might be efficient in spectral
regions with a very high line density, these high values led to the question if the mass loss
of WR stars can be driven by radiation pressure alone.
For the current WR models this situation has changed, because lower mass loss rates are derived
by accounting for clumping, and higher luminosities are predicted by line-blanketed models.
Both effects lead to lower values for the wind efficiency ![]() .
In the present work we
obtain a value of
.
In the present work we
obtain a value of
![]() for WR 111. This value even lies below the wind efficiencies
calculated by Springmann & Puls (1998) in their Monte-Carlo simulations. Therefore, the mass loss of
WR 111 seems to be easily explicable by radiative driving.
for WR 111. This value even lies below the wind efficiencies
calculated by Springmann & Puls (1998) in their Monte-Carlo simulations. Therefore, the mass loss of
WR 111 seems to be easily explicable by radiative driving.
In our radiation transport calculations, the radiative acceleration
 |
(43) |
 |
(44) |
![\begin{figure}
\par\includegraphics[width=8.8cm,clip]{h3177f9.ps}\end{figure}](/articles/aa/full/2002/19/aah3177/img204.gif) |
Figure 9:
Acceleration in units of the local gravity, as function of radius. The wind acceleration
|
| Open with DEXTER | |
Using the concept of super-levels, the line-blanketing by ![]() 107 spectral lines of iron
group elements is successfully implemented into our non-LTE model atmospheres for WR stars.
Due to the more realistic model physics, the spectral fit quality is improved with respect to
former un-blanketed model calculations.
107 spectral lines of iron
group elements is successfully implemented into our non-LTE model atmospheres for WR stars.
Due to the more realistic model physics, the spectral fit quality is improved with respect to
former un-blanketed model calculations.
The iron group opacities significantly affect the emergent flux distribution and the ionization structure of the model atmosphere. The blanketing effects on the emergent flux distribution lead to an increase of the derived stellar luminosity. Due to changes in the ionization structure a lower mass loss rate is obtained from the spectral analysis with blanketed models. Furthermore, the derived mass loss rate becomes even lower when accounting for clumping.
With the lower mass loss rate and the higher luminosity we get a low value for the "observed''
wind efficiency (![]() ). Thanks to the exact treatment of a very large number of spectral
lines (i.e. fully accounting for multiple scattering effects), we obtain a radiative
acceleration for the WR 111 model which supplies about 40% of the "observed'' mechanical
wind luminosity. Attributing the remaining discrepancy to the incompleteness of the opacities
accounted for, we conclude that radiation pressure may be the main driving mechanism for WR
winds.
). Thanks to the exact treatment of a very large number of spectral
lines (i.e. fully accounting for multiple scattering effects), we obtain a radiative
acceleration for the WR 111 model which supplies about 40% of the "observed'' mechanical
wind luminosity. Attributing the remaining discrepancy to the incompleteness of the opacities
accounted for, we conclude that radiation pressure may be the main driving mechanism for WR
winds.
Acknowledgements
This work was supported by the Deutsche Agentur für Raumfahrtangelegenheiten under grants DARA 50 OR 9605 7 and DARA OR 0008, and by the Swiss National Science Foundation.
![\begin{displaymath}%
R_{\rm t} = R_\star \left[\frac{v_\infty}{2500 ~ {\rm km}~{...
...10^{-4} ~ {M_\odot}~{\rm yr^{-1}}}\right]^{2/3}
\right. \cdot
\end{displaymath}](/articles/aa/full/2002/19/aah3177/img30.gif)