A&A 387, 271-284 (2002)
DOI: 10.1051/0004-6361:20020381
Radiative accelerations in stars: The effect of Zeeman splitting
G. Alecian1 - M. J. Stift2
1 - DAEC/LUTH (Observatoire de Paris - CNRS),
Observatoire de Meudon, 92195 Meudon Cedex, France
2 -
Institut für Astronomie (IfA), Universität Wien,
Türkenschanzstrasse 17, 1180 Wien, Austria
Received 21 December 2001 / Accepted 8 March 2002
Abstract
The influence of Zeeman splitting on radiative accelerations
of chemical elements in stellar atmospheres permeated by
magnetic fields with strengths of up to a few Tesla has for
the first time been investigated in detail taking into account
magneto-optical effects and line blending. The work is based
on the newly developed object-oriented and parallel code CARAT
(which is presented in some detail), on extensive atomic data
taken from the VALD database and on a 12 000 K,
 Kurucz atmosphere with solar abundances. The calculations show
that magnetically induced spectral line desaturation can lead
to unexpectedly large amplifications of accelerations - relative
to the zero-field case - in a number of atomic species. These
amplifications are found to be strongly dependent both on field
strength and on field orientation, reaching a pronounced maximum
near the inclination of
Kurucz atmosphere with solar abundances. The calculations show
that magnetically induced spectral line desaturation can lead
to unexpectedly large amplifications of accelerations - relative
to the zero-field case - in a number of atomic species. These
amplifications are found to be strongly dependent both on field
strength and on field orientation, reaching a pronounced maximum
near the inclination of  between field vector and
vertical with values sometimes in excess of 1.5 dex. Horizontal
accelerations, a consequence of polarised radiative transfer,
turn out to remain fairly small and will probably not have any
important effect on the diffusion velocity vector.
This first study on a large scale of how radiative accelerations
are affected by Zeeman splitting is completed by a discussion
of the importance of complete atomic line lists, in particular
line lists with correct Landé factors; it must also
be accepted that magneto-optical effects can by no means be
neglected. Finally, it appears that the "canonical'' picture
of abundance inhomogeneities may have to be revised: instead
of being tied to regions with predominantly vertical or
horizontal magnetic fields, abundance patches could show
up as contours about the curves tracing the field vector
inclination of
between field vector and
vertical with values sometimes in excess of 1.5 dex. Horizontal
accelerations, a consequence of polarised radiative transfer,
turn out to remain fairly small and will probably not have any
important effect on the diffusion velocity vector.
This first study on a large scale of how radiative accelerations
are affected by Zeeman splitting is completed by a discussion
of the importance of complete atomic line lists, in particular
line lists with correct Landé factors; it must also
be accepted that magneto-optical effects can by no means be
neglected. Finally, it appears that the "canonical'' picture
of abundance inhomogeneities may have to be revised: instead
of being tied to regions with predominantly vertical or
horizontal magnetic fields, abundance patches could show
up as contours about the curves tracing the field vector
inclination of  .
.
Key words: diffusion - stars: abundances - stars: chemically
peculiar - stars: magnetic fields - polarization
The atmospheres of the chemically peculiar stars on the upper
main sequence, the so-called CP stars, are often permeated
by strong magnetic fields (some 10 mT to 3.5 T) and
characterised by apparently large over-abundances of certain
metals. At present, astrophysicists favour diffusion processes
as the source of abundance anomalies, a scenario first
elaborated by Michaud (1970). This idea has subsequently
been followed up by a number of authors, enumerated in this
introduction, to whom we refer the reader for a detailed
discussion of the physics involved in radiative diffusion and
the complex buildup of element stratification in stars (a review
being outside the scope of this paper). Let us note that while
considerable progress has been made during the last decade
in the modelling of diffusion deep inside the stars -
thanks to the availability of large new atomic and opacity
databases for high degrees of ionisation - diffusion processes
in stellar atmospheres have received very little attention.
Now that observational evidence has accumulated that seems to
establish beyond doubt the presence of variations in chemical
abundances over the stellar surface (e.g. Strasser et al.
2001) and that gives strong hints at chemical
stratification in the outer layers of CP stars (Bagnulo et al.
2001), there is renewed interest in the modelling of
radiative diffusion in stellar atmospheres. A new approach
to the problem of radiative diffusion in the outer layers of
a star has been made possible by the tremendous increase in readily
available computing power - harnessed by new parallel codes -
combined with extensive atomic transition data well suited to
detailed radiative transfer calculations and (polarised)
spectral line synthesis, like the VALD database (Piskunov et al.
1995). Such new generation tools have been used for
the modelling of diffusion in horizontal branch stars and in
CP stars by Hui-Bon-Hoa et al. (2000, 2002).
One of the most challenging aspects of the study of CP stars
is the modelling of abundance inhomogeneities in their
magnetic atmospheres. As mentioned above, the presence of
variations in chemical abundances over the stellar surface
appears to be an established fact and Doppler Imaging results
(e.g. Kuschnig et al. 1999) seem to suggest that
these are somehow related to the strength and orientation of the
magnetic field. Such conclusions should certainly be interpreted
with the necessary caution but it is interesting to investigate
whether there is a convincing physical explanation for these
observations, and to produce observational predictions.
Vauclair et al. (1979) have shown that - when the
horizontal magnetic field component is strong enough to
freeze the diffusion of silicon ions - silicon should be
supported by the photons absorbed in its neutral state.
This was confirmed in the quantitative study of Alecian &
Vauclair (1981) who showed that silicon spots (or rings)
are expected at places where magnetic lines are nearly parallel
to the stellar surface. Gallium, in contrast, rather accumulates
near places where the magnetic lines are nearly vertical, as
found by Alecian & Artru (1987). Michaud et al.
(1981) suggested that many other metals and rare earths
behave in a similar way. A detailed study of aluminium is due to
Hui-Bon-Hoa et al. (1996).
All the investigations enumerated so far have been made under
the assumption that radiative accelerations are not affected by
the magnetic field. Alecian & Vauclair (1981) for
example have estimated that the role of Zeeman splitting could
be neglected in the case of silicon lines and at field strengths
less than about 1 Tesla. Zeeman splitting thus seemed to be
of secondary importance and only the effect of the magnetic field
on the diffusion coefficients (i.e. on the movements of the
ions across magnetic lines, see Vauclair et al. 1979)
were being considered.
To our knowledge, only Babel & Michaud (1991)
(hereafter referred to as BM)
have attempted to elucidate the behaviour of radiative
accelerations in stellar atmospheres permeated by strong
magnetic fields. Their analytical work however offers only
limited insight since it is restricted to accelerations at
the stellar surface in the case of a simple Zeeman triplet
in a Milne-Eddington atmosphere, anomalous dispersion terms
not being included. Unfortunately, also the accompanying
study of the Sr II
 line does not take
into account magneto-optical effects - for the importance
of the latter see Sect. 6.1. In addition, from
the work of BM it is by no means clear how radiative
accelerations change with Zeeman splitting in strongly
blended spectra.
line does not take
into account magneto-optical effects - for the importance
of the latter see Sect. 6.1. In addition, from
the work of BM it is by no means clear how radiative
accelerations change with Zeeman splitting in strongly
blended spectra.
Keeping the incompleteness and the simplified physics of
this investigation in mind, we have addressed
many of the open questions, and we want to present in
this paper an in-depth reassessment of the role of Zeeman
splitting on the radiative accelerations of the different
chemical elements. Our results are based on Kurucz model
atmospheres (Kurucz 1993), on new large atomic
databases, in particular VALD (Piskunov et al. 1995),
and on a new LTE diffusion code CARAT (Code pour les
Accélérations Radiatives dans les
ATmosphères) that incorporates the best affordable
input physics and that can execute on massively parallel
multiprocessor machines.
2 Polarised radiative transfer
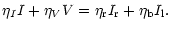
The equation for radiative transfer of polarised light
can be written:
 |
|
|
(1) |
where z is the vertical position in the stellar atmosphere
(positive outwards), K the absorption matrix (line
plus continuum), j the total emission vector, and
 the source function.
I is the Stokes vector
the source function.
I is the Stokes vector
 (transpose) where I represents the intensity, Q and U
characterise the linear polarisation, and V the circular
polarisation (for a gentle introduction to polarised radiative
transfer see Rees 1987). Stokes vector and
absorption matrix are functions of frequency
(transpose) where I represents the intensity, Q and U
characterise the linear polarisation, and V the circular
polarisation (for a gentle introduction to polarised radiative
transfer see Rees 1987). Stokes vector and
absorption matrix are functions of frequency  .
.
Here
 stands for the continuum opacity,
 for the Planck function,
 denotes the line centre opacity for zero damping and zero
magnetic field,
denotes the line centre opacity for zero damping and zero
magnetic field,  is the unit
  matrix. The
line absorption matrix
matrix. The
line absorption matrix
depends on strength, direction  and azimuth
  of the magnetic field. The line absorption terms become
and the Faraday terms
where the line absorption profiles for the  and for
the blue or red shifted
and for
the blue or red shifted  components - the shifts
are directly proportional to the magnetic field strength
- are denoted by
components - the shifts
are directly proportional to the magnetic field strength
- are denoted by
 respectively, and
where the
respectively, and
where the
 are the corresponding
anomalous dispersion profiles.
are the corresponding
anomalous dispersion profiles.
3 Radiative accelerations in a magnetic atmosphere
The total radiative acceleration of an ion A(+i), in a given
atmospheric layer, is obtained by determining the total
amount of momentum gained per second by absorption of photons.
To compute this total amount of momentum, one generally
integrates over frequency the photoabsorption cross-sections
of all atomic transitions of A(+i) multiplied by the local
radiation flux. Actually, the situation is complicated by
the fact that acceleration due to photoionisation (see for
instance Alecian 1994; Gonzalez et al. 1995)
must be redistributed to ion A(i+1) and must take into account
the momentum taken away by the ejected electron (Massacrier
1996). But since at present we are interested solely
in studying the effect of Zeeman splitting of lines, we
hereafter restrict ourselves to the momentum acquired through
bound-bound transitions, i.e. the radiative accelerations due
to absorption in spectral lines.
The radiative acceleration due to lines in the non-magnetic case
can be calculated considering (in the integral over frequencies)
only the net photon flux, and using the following well-known
scalar expression:
 |
|
|
(11) |
In the case of a magnetic field, the spatial symmetry
around the z-axis is lost and the acceleration vector
is now given by
 |
|
|
(12) |
where
- ni is the total number density
 of ions A+i, nik the number density of ions in
initial lower level k,
of ions A+i, nik the number density of ions in
initial lower level k,
-
 is the mass (kg) of the ion,
-
 is the absorption cross-section
 for the transition
 ,
,
 is the net energy flux
-
 denotes the inner product of the
vector
denotes the inner product of the
vector
 with the Stokes vector I.
It has to be emphasised that the angles
and
in the vector  do not depend on the direction
of the magnetic field vector relative to the observer but
relative to the direction of the pencil of radiation. Let us
also note that inclusion of the full Stokes vector can lead
to an acceleration vector that is no longer purely vertical.
do not depend on the direction
of the magnetic field vector relative to the observer but
relative to the direction of the pencil of radiation. Let us
also note that inclusion of the full Stokes vector can lead
to an acceleration vector that is no longer purely vertical.
In order to calculate realistic radiative accelerations of
chemical elements in stellar atmospheres permeated by strong
magnetic fields, it is necessary to treat line blending and
Zeeman splitting in full detail, and to solve the polarised
radiative transfer equation with an accurate formal solver,
e.g. the Zeeman-Feautrier solver of Auer et al. (1977).
Line blending can be quite heavy at short wavelengths in most
CP stars, so any approximate treatment is bound to fail. In
a similar vein, the polarised radiative transfer in the outer
layers of these stars cannot adequately be described by the
diffusion approximation.
 |
Figure 1:
Mg II
 :
run with wavelength
and with logarithmic standard optical depth :
run with wavelength
and with logarithmic standard optical depth
 of
of
 - as defined in Sects. 2 and 3 and
in
- as defined in Sects. 2 and 3 and
in
 .
For the sake of clarity, only the blue half of the line is
displayed. Bottom: zero magnetic field, Top:
horizontal field of 2 T. The pencil of light in the direction .
For the sake of clarity, only the blue half of the line is
displayed. Bottom: zero magnetic field, Top:
horizontal field of 2 T. The pencil of light in the direction
 sees a nearly transverse magnetic field vector
(
sees a nearly transverse magnetic field vector
( ). Stark broadening has been calculated according
to Gonzalez et al. (1995) but with a coefficient of ). Stark broadening has been calculated according
to Gonzalez et al. (1995) but with a coefficient of
 (Artru, private communication).
 |
| Open with DEXTER |
Calculation of the frequency integrals in the formulae (11) and (12) given in the previous section is
best done employing the trapezoidal rule. In fact, the
integrand - essentially the product of flux times line
opacity - can vary significantly over wavelength intervals
of the order of a couple of mÅ. Such behaviour is
demonstrated in Fig. 1 - keep in mind that
the figure displays the logarithm
of the integrand - and precludes the use of higher-order
integration schemes. Good accuracy can only be achieved
with fairly high wavelength resolution; it turns out that
the spectral range
900 - 10 000 Å has to be sampled
at least every 10 mÅ, but it is advisable to go down
to a 5 mÅ step size.
Thus all of the more than
 Zeeman components contributing
to the opacity have to be sampled at the
Zeeman components contributing
to the opacity have to be sampled at the
 quadrature
points in wavelength. Subsequently, the wavelength integrals
have to be integrated over all spatial directions, which in the
general case of a magnetic field vector arbitrarily inclined
towards the vertical implies a 2-D integration with typically
24 quadrature points. Only in the case of a longitudinal field
can the problem be reduced to a 1-D integration (4 points should
be sufficient).
quadrature
points in wavelength. Subsequently, the wavelength integrals
have to be integrated over all spatial directions, which in the
general case of a magnetic field vector arbitrarily inclined
towards the vertical implies a 2-D integration with typically
24 quadrature points. Only in the case of a longitudinal field
can the problem be reduced to a 1-D integration (4 points should
be sufficient).
Solving the polarised transfer equation
 times (with
about 100 points in optical depth) in addition to sampling the
opacity of
Zeeman components at
wavelength
points is very time-consuming and outside the reach of even the
fastest single-processor machines, if acceptable turnaround
times are to be attained. As an illustration of the computational
requirements, a single run with a 24 point 2D-integration requires
some 64 hours mono-processor time on an Sgi Origin 3800 computer
equipped with the R14000 chip. This corresponds to about 97 hours
on a 1 GHz AMD or Intel processor according to our benchmarks
(secondary cache size plays some role). Thus we have to employ
(massively) parallel computing in order to calculate realistic
radiative accelerations in magnetic atmospheres, based on the
best input physics available.
times (with
about 100 points in optical depth) in addition to sampling the
opacity of
Zeeman components at
wavelength
points is very time-consuming and outside the reach of even the
fastest single-processor machines, if acceptable turnaround
times are to be attained. As an illustration of the computational
requirements, a single run with a 24 point 2D-integration requires
some 64 hours mono-processor time on an Sgi Origin 3800 computer
equipped with the R14000 chip. This corresponds to about 97 hours
on a 1 GHz AMD or Intel processor according to our benchmarks
(secondary cache size plays some role). Thus we have to employ
(massively) parallel computing in order to calculate realistic
radiative accelerations in magnetic atmospheres, based on the
best input physics available.
There was no code that would meet the physical, numerical and
computational requirements outlined above, so a new code had to
be developed. CARAT is based on the object-oriented and
parallel polarised spectral line synthesis code COSSAM
(Codice per la sintesi spettrale nelle atmosfere magnetiche) a
description of which is provided by Stift (2000) and
by Wade et al. (2001). Written entirely in Ada95,
the only standardised (ISO/IEC 8652:1995) object-oriented
language with concurrent constructs, CARAT and
COSSAM are based on truly reusable software components
which incorporate software engineering concepts such as abstract
data types, encapsulation and information hiding, generics,
inheritance and programming by extension (see Stift 1996,
1998a for more details on Ada95 in (astro)physics).
About 68% of the software components used in CARAT, representing
more than 4000 lines of code (4 kLOCs) have been taken verbatim
from COSSAM. Thanks to its thread-parallel approach, Ada95
does not require the use of Message Passing Interfaces - as in
Fortran - in order to exploit the "embarrassingly parallel''
nature of the spectral line synthesis problem. We refer to Stift
(1998b) for a detailed discussion of concurrency and
light-weight synchronisation with Ada95 in this astrophysical
context.
For the solution of the polarised radiative transfer problem
we have chosen the Zeeman Feautrier method of Auer et al.
(1977) instead of the more popular and somewhat
faster DELO method (Rees et al. 1989). The reason
for this lies in the legendary stability of the Feautrier
method, in the fact that it is second order accurate - in
contrast to DELO's first order accuracy, see Stift
(1999) - and that it automatically recovers the
diffusion approximation at great depths (Mihalas 1978).
The latter is
particularly important for radiative accelerations which
depend on the net Stokes flux. Magneto-optical terms are
normally included in the formal solution but there is a
runtime option to suppress them for test purposes.
Tables of continuous opacities
 as a function of
wavelength and the given standard optical depth grid are
extracted from the Atlas 9 (Kurucz 1993)
output files. CARAT interpolates in this table at
every 5 mÅ step. The total line opacity
as a function of
wavelength and the given standard optical depth grid are
extracted from the Atlas 9 (Kurucz 1993)
output files. CARAT interpolates in this table at
every 5 mÅ step. The total line opacity
 is
determined by full opacity sampling of the
is
determined by full opacity sampling of the
 ,
the
,
the
 ,
and
components separately.
,
and
components separately.
Spatial integration of the frequency integrated product
of Stokes flux times radiative cross section is carried
out in 2 steps. The frequency integral is first integrated
over all azimuthal angles around the z-axis, employing the
trapezoidal rule; as in the case of frequency integration,
the ill-behaved nature of the integrand precludes the use
of higher-order integration schemes. Subsequently, a
Gaussian quadrature is carried out over
 ,
usually based on 4 quadrature points. Extensive tests
have shown that a total of 4 quadrature points in
,
usually based on 4 quadrature points. Extensive tests
have shown that a total of 4 quadrature points in  and of 6 in azimuth, i.e. a total of 24 points, are sufficient
for fairly accurate radiative accelerations, i.e.
substantially better than 1%.
and of 6 in azimuth, i.e. a total of 24 points, are sufficient
for fairly accurate radiative accelerations, i.e.
substantially better than 1%.
Some of the input physics in CARAT can be traced
back to "Analyse 65'', the ALGOL 60 code by Baschek
et al. (1966) and to its evolved FORTRAN translation
ADRS 3 (Chmielewski 1979). The atomic transitions are
taken from the VALD database (Piskunov et al. 1995). The
atomic partition functions are normally calculated with the
Kurucz (1993) routine rewritten in Ada95 but one can
also choose the partition functions by Traving et al.
(1966), Irwin (1981) or Cowley (1998).
CARAT works under the assumption of LTE in a
plane-parallel atmosphere; in the Saha equation the lowering
of the ionisation potential as a function of temperature and
electron density is taken into account. Generally, radiation
damping and van der Waals broadening constants are taken from
VALD; classical radiation damping and Unsöld van der Waals
broadening respectively are assumed if these constants are not
provided by VALD. Concerning Stark broadening there are 2
options: either Stark broadening is taken form VALD and set to
zero whenever not available, or Stark broadening is calculated
for all transitions using the formula discussed by Gonzalez
et al. (1995) but with a coefficient of
(Artru, private communication) instead of the original
 .
It is clear that not only is there the necessity
of including state-of-the-art accurate hydrogen line
opacities, but that reliable hydrogen line blanketed
continuous radiative fluxes can only be obtained by a
correct treatment of the Balmer discontinuity. We have
chosen to interpolate in the tables of hydrogen profiles
by Stehlé & Hutcheon (1999) and to treat the
higher Balmer series members according to the recipe given
in Hubeny et al. (1994), based on the occupation
probability formalism discussed in Hummer & Mihalas
(1988), Däppen et al. (1987) and
Seaton (1990). Metallic line profiles are calculated
by the rational approximation to the Voigt and Faraday
functions given in Landolt-Börnstein (1982).
.
It is clear that not only is there the necessity
of including state-of-the-art accurate hydrogen line
opacities, but that reliable hydrogen line blanketed
continuous radiative fluxes can only be obtained by a
correct treatment of the Balmer discontinuity. We have
chosen to interpolate in the tables of hydrogen profiles
by Stehlé & Hutcheon (1999) and to treat the
higher Balmer series members according to the recipe given
in Hubeny et al. (1994), based on the occupation
probability formalism discussed in Hummer & Mihalas
(1988), Däppen et al. (1987) and
Seaton (1990). Metallic line profiles are calculated
by the rational approximation to the Voigt and Faraday
functions given in Landolt-Börnstein (1982).
6 Zeeman patterns and VALD
For many, but by no means for all lines, VALD lists
Landé factors in addition to the J-values of the
respective lower and upper energy levels, which makes it
possible to calculate Zeeman splittings outside LS coupling.
Relative component strengths are derived with the help of
the formulae given in Sobelman (1979). Complications
in splittings and relative intensities due to the partial
Paschen-Back effect are not taken into account.
 |
Figure 2:
Radiative accelerations due to the Mg II
lines at
 and
and
 (no
blending with lines of other elements considered) in
a 2 T magnetic field, relative to the zero field case.
Bottom:
Maximum magnetic amplification of acceleration
(over all optical
depths) as a function of the angle between the vertical
and the magnetic field vector (in degrees). Results are
shown for the correct sextuplet and quadruplet (solid
line), the same without magneto-optical effects included
(short dash), and for classical triplets (dot - short
dash). Top:
The corresponding location in the atmosphere where
maximum magnetic amplification occurs.
(no
blending with lines of other elements considered) in
a 2 T magnetic field, relative to the zero field case.
Bottom:
Maximum magnetic amplification of acceleration
(over all optical
depths) as a function of the angle between the vertical
and the magnetic field vector (in degrees). Results are
shown for the correct sextuplet and quadruplet (solid
line), the same without magneto-optical effects included
(short dash), and for classical triplets (dot - short
dash). Top:
The corresponding location in the atmosphere where
maximum magnetic amplification occurs. |
| Open with DEXTER |
A problem arises with those lines for which VALD does not
provide Landé factors. Whereas in the case of Fe I
through Fe III for which Zeeman data are complete to
99.996% one could simply assume classical Zeeman triplets
without affecting the final results, there are a number of
elements - among them Mg, Al, Si and Zn - where VALD does
not list any Landé factors at all, not even those of
the strongest lines. It has been known for a long time
(see Babcock 1949) that magnetic intensification
due to desaturation caused by Zeeman-splitting varies
considerably between simple triplets and complex anomalous
Zeeman patterns. As a consequence, radiative accelerations
calculated with classical Zeeman triplets only may be
seriously in error, as is evident from Fig. 2
where we find overestimates by a striking 100%. As a
consequence, one must get Landé factors from various
listings of atomic energy levels (at least for the
resonance lines), a most tedious but essential step in
the quest for accurate radiative accelerations, which
cannot however be extended to tens of thousands of lines.
The solution for the latter case consists in the use of
the spectroscopic term classifications provided by VALD
for the determination of Landé factors under the
assumption of LS-coupling. This is far less demanding,
but since it is well known that LS-coupling does not hold
universally - see Stift (1977) for a few
illustrations - the resulting Zeeman patterns of
individual lines might be seriously in error. Still,
there is the well-founded hope that statistically the
result will not go too far astray, especially when the
Landé factors of the strongest lines are taken from
accurate energy level tables.
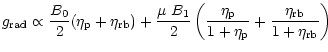
6.1 Magneto-optical effects
It has already been pointed out by Landolfi et al.
(1989) and reemphasised by Wade (2000)
that the inclusion of magneto-optical effects is
critical for the correct interpretation of Stokes
profiles in CP stars. In the Mg II
and
resonance
lines, at field strengths of up to 2 T, the
-components overlap with the -components.
Cyclical coupling in the polarised radiative transfer
equation of Q, U and V as a result of anomalous
dispersion, and coupling of Stokes I with the Stokes
parameters Q, U and V due to absorption should
play an important role in these extremely strong lines.
We expect accelerations to be considerably affected.
In order to investigate this further, we have carried
out detailed calculations for the Mg II resonance
lines in a 2 T magnetic field under 3 different
assumptions, viz.
- 1.
- taking the sextuplet and quadruplet patterns
(i.e. the correct Zeeman splitting);
- 2.
- the same with magneto-optical effects omitted;
- 3.
- assuming both lines to be classical triplets.
Figure 2 displays the respective radiative
accelerations relative to the zero field case at various
inclinations between the magnetic field vector and the
vertical. We note that the accelerations as a function
of angle invariably exhibit a maximum near 60 - regardless of the assumption - but that these maxima
differ by large amounts. At
the magnetic
amplification factor based on the correct Zeeman patterns
takes a value near 20; under the simplifying assumption
of the lines being Zeeman triplets this value doubles.
The exclusion of magneto-optical effects introduces even
more severe errors, artificially increasing the
amplification factor to a value of 50. Let us also point
out another systematic effect which results from the
omission of the Faraday terms. Figure 2 (top)
reveals that maximum amplification, enhanced by a
substantial 0.4 dex over the correct value, occurs in
significantly deeper layers.
- regardless of the assumption - but that these maxima
differ by large amounts. At
the magnetic
amplification factor based on the correct Zeeman patterns
takes a value near 20; under the simplifying assumption
of the lines being Zeeman triplets this value doubles.
The exclusion of magneto-optical effects introduces even
more severe errors, artificially increasing the
amplification factor to a value of 50. Let us also point
out another systematic effect which results from the
omission of the Faraday terms. Figure 2 (top)
reveals that maximum amplification, enhanced by a
substantial 0.4 dex over the correct value, occurs in
significantly deeper layers.
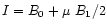
There is nothing strange in the fact that the inclusion
of anomalous dispersion terms leads to a reduction in
acceleration. In fact, the decrease in flux and
concomitant increase in equivalent width due to
magneto-optical effects is well established (see
Landolfi et al. 1989). Multiplication of the
cross section - which remains unchanged - with a
reduced flux quite naturally leads to a drop in
acceleration. Only the extent to which this can happen
in very strong lines, with a ratio of line centre
opacity to continuous opacity of 105 and more as
in the case of the Mg II resonance lines, may
appear somewhat surprising, but can easily be
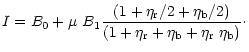
explained. Taking the solution for a Milne-Eddington
atmosphere (see e.g. Rees 1987), we have
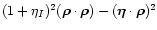
![$\displaystyle %
I = B_0 + \mu B_1 [(1 + \eta_I) ((1 + \eta_I)^2 +
\vec{\rho} \cdot \vec{\rho})] / \Delta$](/articles/aa/full/2002/19/aa2226/img97.gif) |
|
|
(13) |
where
In the
Mg II resonance line
a detailed analysis reveals that the spectacular
decrease in acceleration due to magneto-optical
effects stems from the fact that both in the
outer parts of this quadruplet line and near the
centre, the term
 dominates the term
 by 4 to 6 orders of magnitude. The dominating term
brings the residual flux obtained without anomalous
dispersion in the (component-free) line centre down
to almost the low levels encountered between the -
and the -components. Similarly, it leads to a
substantial drop in flux in the outer wings of the
-components. The stronger the line, the
more important this effect becomes, as can be seen
in Fig. 3. Strong lines
behave in an exceptionally interesting way, discussed
to some length in Sect. 8; the full
details of this behaviour remain yet to be documented.
by 4 to 6 orders of magnitude. The dominating term
brings the residual flux obtained without anomalous
dispersion in the (component-free) line centre down
to almost the low levels encountered between the -
and the -components. Similarly, it leads to a
substantial drop in flux in the outer wings of the
-components. The stronger the line, the
more important this effect becomes, as can be seen
in Fig. 3. Strong lines
behave in an exceptionally interesting way, discussed
to some length in Sect. 8; the full
details of this behaviour remain yet to be documented.
 |
Figure 3:
Mg II
:
run with
 (reckoned from the line centre) at standard optical depth
 of the normalised
flux in Stokes I, with (full line) and without
(dot - long dash) anomalous dispersion terms considered.
In addition, the plot shows the shape of
of the normalised
flux in Stokes I, with (full line) and without
(dot - long dash) anomalous dispersion terms considered.
In addition, the plot shows the shape of  (dotted line) and the relative sizes of the vertical
accelerations, with (long dash) and without (dot - short dash)
magneto-optical effects. The angle between the magnetic field
vector and the ray in the direction
(dotted line) and the relative sizes of the vertical
accelerations, with (long dash) and without (dot - short dash)
magneto-optical effects. The angle between the magnetic field
vector and the ray in the direction
 is about
 ,
the magnetic field strength 2 T. The left panel
pertains to the true strength of the line, the right panel to
the line with 100 times lower oscillator strength. ,
the magnetic field strength 2 T. The left panel
pertains to the true strength of the line, the right panel to
the line with 100 times lower oscillator strength. |
| Open with DEXTER |
Our calculations convincingly demonstrate that it is of
paramount importance, especially in such strong lines,
to employ the correct Zeeman pattern and to include
magneto-optical effects in the formal solution of the
polarised radiative transfer equation. The latter can be
easily done at virtually no extra cost, employing the
Zeeman-Feautrier solver, but the former constitutes at
present a major problem. Indeed, atomic databases such
as VALD do not yet provide the necessary Zeeman data
for all elements and we would like to encourage the VALD
people to direct efforts in this direction.
Thanks to extensive systematic computations of radiative
accelerations in stellar atmospheres permeated by strong
magnetic fields, which we have carried out with CARAT,
we are now able to estimate the effect of Zeeman splitting
on all ions for which line data are available in VALD.
Hydrogen and helium excepted, where radiative accelerations
are not relevant in CP star atmospheres, we have data for
329 ions (ionisation degrees smaller than 5) of the 90
elements from Li to U. We have chosen a Kurucz Atlas9 model
with
 K and
which,
although it does not represent a realistic CP star atmosphere,
is sufficiently well suited for our present investigation
which centres on the difference between accelerations
derived from Zeeman split spectra and accelerations due to
lines unaffected by magnetic fields. The temperature range
encountered in this model determines the wavelength interval
for which significant photon flux is available: we have
carried out our calculations from 900 Å to 10 000 Å,
including all those lines from VALD for which the central
opacities at any depth point reach at least 10-3 of the
continuum opacity at this location. In the present calculations
this leads to the inclusion of 140 087 spectral lines,
split into 739 099
,
739 099
and 764 366
components respectively. No VALD tools have been employed.
K and
which,
although it does not represent a realistic CP star atmosphere,
is sufficiently well suited for our present investigation
which centres on the difference between accelerations
derived from Zeeman split spectra and accelerations due to
lines unaffected by magnetic fields. The temperature range
encountered in this model determines the wavelength interval
for which significant photon flux is available: we have
carried out our calculations from 900 Å to 10 000 Å,
including all those lines from VALD for which the central
opacities at any depth point reach at least 10-3 of the
continuum opacity at this location. In the present calculations
this leads to the inclusion of 140 087 spectral lines,
split into 739 099
,
739 099
and 764 366
components respectively. No VALD tools have been employed.
In order to study the radiative diffusion of elements, the
b-b radiative accelerations of all ions of a given element
must be combined with the accelerations due to photoionisation
(not computed here). Generally this is done through some
weighted mean of the
 and involves the relative
ion populations, the collision rates with protons, and
the ionisation and recombination rates for each ion (Montmerle
& Michaud 1976; Alecian & Vauclair 1983;
Gonzalez et al. 1995).
Theses calculations are outside the scope of this work since
we are only interested in the role of the Zeeman splitting.
For our purposes we shall therefore use the following simple
approximation to the total radiative acceleration of an element
and involves the relative
ion populations, the collision rates with protons, and
the ionisation and recombination rates for each ion (Montmerle
& Michaud 1976; Alecian & Vauclair 1983;
Gonzalez et al. 1995).
Theses calculations are outside the scope of this work since
we are only interested in the role of the Zeeman splitting.
For our purposes we shall therefore use the following simple
approximation to the total radiative acceleration of an element
 |
|
|
(17) |
where ni stands for the population and
for
the radiative acceleration in ionisation stage i. The
sum extends over all ionisation stages provided in the
Kurucz partition function routine.
Our simple formula has, among others, the advantage of
reducing the amount of numerical results to analyse.
A mere 90 accelerations have to be considered instead
of 329. Moreover, this approximation is helpful for
the purpose of having a first estimate of how an element
behaves: when
 is larger than gravity, the element
is pushed up by the radiation field. The magnetic field
enters our results solely through Zeeman splitting, and
that is what we are presently interested in.
However, for realistic diffusion studies, a future version
of CARAT will of course have to include effects like
redistribution of momentum among ions of the same element,
photoionisation, and the dependence of the diffusion
coefficients on the magnetic field.
is larger than gravity, the element
is pushed up by the radiation field. The magnetic field
enters our results solely through Zeeman splitting, and
that is what we are presently interested in.
However, for realistic diffusion studies, a future version
of CARAT will of course have to include effects like
redistribution of momentum among ions of the same element,
photoionisation, and the dependence of the diffusion
coefficients on the magnetic field.
Figure 4 shows
 (in cgs units)
for all elements
in the case of zero magnetic field and solar chemical
composition. Note that elements for which
(in cgs units)
for all elements
in the case of zero magnetic field and solar chemical
composition. Note that elements for which
 is always smaller than 10 cm
 (e.g. Li),
or for which no line has been extracted from VALD (see
above), do not appear in Fig. 4. In general,
abundant metals like CNO and the iron peak elements
display rather small accelerations (less than gravity)
because of strong saturation of their lines. Let us
emphasise that we have considered homogeneous solar
abundances and that these accelerations can change
considerably if diffusion proceeds for some time and
stratification of elements appears.
(e.g. Li),
or for which no line has been extracted from VALD (see
above), do not appear in Fig. 4. In general,
abundant metals like CNO and the iron peak elements
display rather small accelerations (less than gravity)
because of strong saturation of their lines. Let us
emphasise that we have considered homogeneous solar
abundances and that these accelerations can change
considerably if diffusion proceeds for some time and
stratification of elements appears.
![\begin{figure}
\par\includegraphics[width=16.8cm]{alecianf4.eps}\end{figure}](/articles/aa/full/2002/19/aa2226/Timg116.gif) |
Figure 4:
Zero magnetic field radiative accelerations
of the chemical elements in a Kurucz ATLAS9
K,
model
atmosphere with solar composition. Accelerations
are in cgs units to conform with Kurucz.
Logarithmic accelerations are plotted vs. logarithmic
standard optical depth at 5000 Å. The 10 panels are
sorted by atomic numbers. |
| Open with DEXTER |
For the reasons outlined above we have limited
ourselves to the use of Eq. (13), so unfortunately
no comparison is possible between the zero-field total
radiative accelerations presented in Fig. 4,
based on CARAT, and those obtained in LTE by
Hui-Bon-Hoa et al. (2002). We believe that the
accelerations of ions calculated with Eq. (11) are as
accurate as those of Hui-Bon-Hoa et al. (2002)
because of the state-of-the-art physics, numerics and
radiative transfer employed in COSSAM, on which CARAT
is based (see Wade et al. 2001). A partial
comparison has been made with results from an older
code used by Hui-Bon-Hoa et al. (1996), which
has yielded satisfactory agreement in the case of the
Al resonance line.
It must be noted that the accuracy of the accelerations
depends on the quality and the completeness of the atomic
data. We deem it highly probable that for several elements,
(among them the rare earths and the heaviest elements),
not all b-b transitions which contribute significantly
to the respective accelerations are listed in VALD or in
any other publicly accessible atomic database.
Still, in the present work this presents no real problem
since we are interested in differential effects only.
The zero-field accelerations shown in Fig. 4
are to be considered reference values - sufficiently
accurate up to the iron peak elements - against which we
compare the magnetic results to be presented below. We want
to warn that no direct quantitative conclusions about chemical
peculiarities in CP stars can be drawn from our results.
The effect of Zeeman splitting on the radiative
accelerations has been calculated for 3 different
field strengths, viz. 1, 2, and 4 Tesla, and a
number of inclinations between the magnetic field
vector and the surface normal. As it turns out,
not only Mg II reaches maximum acceleration
near an inclination of
but this behaviour
is characteristic of all ionisation stages of all
elements. These findings are at variance with the
results for a Milne-Eddington atmosphere derived by
BM who found maximum acceleration at  for
all 7 Zeeman patterns investigated. However, a
possible relation to the
for
all 7 Zeeman patterns investigated. However, a
possible relation to the  found by BM for
radiation propagating along the z-axis cannot be
excluded. Given the physical simplifications
underlying the Milne-Eddington solution, we do not
deem it useful to further discuss theses discrepancies.
found by BM for
radiation propagating along the z-axis cannot be
excluded. Given the physical simplifications
underlying the Milne-Eddington solution, we do not
deem it useful to further discuss theses discrepancies.
In Fig. 5 we plot the logarithmic
amplification (at 60)
 for all elements as a function of standard optical depth.
For the sake of clarity, only those elements are displayed
where the increase in
exceeds 30%
(
for all elements as a function of standard optical depth.
For the sake of clarity, only those elements are displayed
where the increase in
exceeds 30%
(
 dex) at any depth point in the
atmosphere. The respective curves are labeled with the
name of the corresponding element and the labels are
placed at the location of the maximum.
dex) at any depth point in the
atmosphere. The respective curves are labeled with the
name of the corresponding element and the labels are
placed at the location of the maximum.
![\begin{figure}
\par\includegraphics[width=14cm]{alecianf5.eps} \end{figure}](/articles/aa/full/2002/19/aa2226/Timg120.gif) |
Figure 5:
Amplification of the radiative accelerations
of the chemical elements due to Zeeman splitting as
a function of optical depth and of magnetic field
strength. Logarithmic amplifications
,
defined relative to the accelerations shown in
Fig. 4, are displayed for field strengths
of 1, 2, and 4 T at a constant
angle
between magnetic field vector and vertical. Curves
are plotted only when
dex at
any depth point. |
| Open with DEXTER |
Among the elements, Mg and Ca exhibit a truly spectacular
increase of
with magnetic field strength, with
amplification factors at 4 T in excess of 40 and 10
respectively. At a more moderate 1 T field strength, the
effect of magnetic splitting is less dramatic, but the
amplification for Ca, Fe, Ni, and Zn still attains values
of 2 and more in layers with
 .
In many cases, such as Mg, the amplification
.
In many cases, such as Mg, the amplification  depends almost entirely on a few strong resonance lines.
Keeping in mind that Zeeman splitting goes with the square
of the wavelength, it is not surprising that the
favourable combination of wavelength and extreme strength
of the Mg II resonance lines near 2800 Å leads
to a particularly effective desaturation and ensuing
increase in radiative acceleration.
depends almost entirely on a few strong resonance lines.
Keeping in mind that Zeeman splitting goes with the square
of the wavelength, it is not surprising that the
favourable combination of wavelength and extreme strength
of the Mg II resonance lines near 2800 Å leads
to a particularly effective desaturation and ensuing
increase in radiative acceleration.
After all, it is not overly suprising to find amplification
factors of certain elements that exceed by more than
1 order of magnitude those determined by BM. In fact, the
behaviour with respect to magneto-optical effects of the
Mg II
 resonance line, displayed
in Fig. 3, lets one expect similar large changes
in flux due to Zeeman splitting. Accelerations in very
strong lines subject to Zeeman splitting will be discussed
later in the next section.
resonance line, displayed
in Fig. 3, lets one expect similar large changes
in flux due to Zeeman splitting. Accelerations in very
strong lines subject to Zeeman splitting will be discussed
later in the next section.
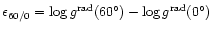
In the light of these results, we once more have to
emphasise how important it is to employ accurate atomic
data, not only oscillator strengths, but also Landé
factors, especially for the resonance lines. Radiative
accelerations of the lighter elements in a stellar
atmosphere permeated by strong magnetic fields will
therefore be seriously in error if they are based on
VALD data that are not supplemented by Landé factors
as pointed out above in Sect. 6.
Note that our calculations for Si, which yield an increase
in acceleration of less than 30% for fields below 2 T,
are in satisfactory accord with the predictions by Alecian
& Vauclair (1981), based on a qualitative estimate
of Zeeman desaturation.
The acceleration of a species is essentially given by the
product of photon flux times the cross section of the lines
of this species. In principle, accelerations could either
decrease, increase or remain unchanged with magnetic field
strength, depending on the extent to which the drop in flux
is counter-balanced by a different distribution with
frequency of cross sections. It thus appears surprising that
among the 90 elements for which we have calculated radiative
accelerations, we have encountered only one case, viz. Ag,
where Zeeman splitting leads to a significant decrease in
.
Our findings are compatible with the view that for most
elements, a few strong lines rather than the ensemble of
all lines dominate the total acceleration. If instead the
latter resulted from almost equal contributions of a
multitude of lines of comparable strength, more or less
evenly distributed over the whole spectrum, one would, on
statistical grounds, expect more cases of acceleration
decreasing with magnetic splitting.
In the case of Ag, strong lines are absent and blending
appears to be serious. Detailed calculations including just
lines of Ag and hydrogen reveal the usual increase in
acceleration with field strength in accord with our
interpretation.
We have pointed out previously that the inclusion of the
full Stokes parameters can lead to an acceleration vector
that is no longer purely vertical. The deviation from
the vertical turns out to be rather modest in those layers
where the vertical acceleration
 exceeds gravity,
just a few degrees. Interestingly, the horizontal
acceleration
does not always have the same
sign for all optical depth points.
exceeds gravity,
just a few degrees. Interestingly, the horizontal
acceleration
does not always have the same
sign for all optical depth points.
We do not think at present that horizontal accelerations
will have any important effect on the diffusion velocity
vector. Actually, even in the case of strictly vertical
acceleration, the diffusion velocity vector can have
a horizontal component of the same order of magnitude
as the vertical component, because charged particles
tend to follow the inclined field lines (see Alecian
& Vauclair 1981; Michaud et al. 1981).
As a note of caution we would like to add that, even
in this case, observable effects of horizontal diffusion
are most unlikely since the geometric scales involved
are far larger than those of vertical diffusion
(Alecian 1986).
8 Polarised radiative transfer and radiative
acceleration in strong lines
The logarithmic amplifications of Mg and Ca revealed in
Fig. 5 reach a surprising
 at
a field strength of 2 T. There follow Fe, Zn and Ni where
at
a field strength of 2 T. There follow Fe, Zn and Ni where
 ,
but for the remaining 85
elements even a meagre
,
but for the remaining 85
elements even a meagre
 is rarely attained.
What are the physical reasons for these huge differences in
amplification among the various elements? Can we be sure
that these results are not merely artefacts of our numerical
scheme?
is rarely attained.
What are the physical reasons for these huge differences in
amplification among the various elements? Can we be sure
that these results are not merely artefacts of our numerical
scheme?
The Mg resonance lines at
and
 are among the strongest 10 of the 140 087 lines used in our
calculations. When Zeeman splitting of these lines causes
desaturation and ensuing change in the outgoing flux, even a
minor change can lead to a significant increase in acceleration
because
are among the strongest 10 of the 140 087 lines used in our
calculations. When Zeeman splitting of these lines causes
desaturation and ensuing change in the outgoing flux, even a
minor change can lead to a significant increase in acceleration
because
 has to be multiplied by the huge value
of
(up to a few 107).
has to be multiplied by the huge value
of
(up to a few 107).
Egidio Landi Degl'Innocenti (private communication) has pointed
out to us the difficulties that can arise when dealing with
very strong lines. We reproduce his arguments almost verbatim.
Consider the force which is exerted on an element of matter that
is close to the surface and suppose that this force is due only
to the radiation that is propagating upwards. Suppose also that
the magnetic field is vertical. The
and  become
The intensity can be decomposed in right and left hand circular
polarisation
| I |
= |
 |
(20) |
| V |
= |
 |
(21) |
The acceleration is proportional to
and summing up one finds the obvious result
 |
|
|
(24) |
But in extremely strong lines, the terms that cancel out analytically
in the sum are very much larger than the other two that contribute
to the sum. We have
 |
|
|
(25) |
 |
|
|
(26) |
because the component
 overlaps with the continuum in left
hand circular polarisation, whereas it overlaps with the line profile
in right hand circular polarisation.
overlaps with the continuum in left
hand circular polarisation, whereas it overlaps with the line profile
in right hand circular polarisation.
 |
Figure 6:
Stokes I profile of a Zeeman triplet in
a Milne-Eddington atmosphere with a source function
 .
The line profiles are assumed to be Gaussians with 12 mÅ
half width, the splitting is 24 mÅ. Ratios of central
line opacities over continuum opacity are
106, 102 and 10,
respectively (full, dashed, dot-dashed lines). .
The line profiles are assumed to be Gaussians with 12 mÅ
half width, the splitting is 24 mÅ. Ratios of central
line opacities over continuum opacity are
106, 102 and 10,
respectively (full, dashed, dot-dashed lines). |
| Open with DEXTER |
In practice this means that, since we cannot take advantage of this
analytical cancellation, accelerations in strong lines are just tiny
differences between the very large numbers
 and
and  .
Which implies among others that we have to
carry out all our calculations in double precision, but also that
any simple analysis and visualisation - based on just the Stokes
I parameter - of the acceleration as a function of frequency and
depth becomes impossible.
.
Which implies among others that we have to
carry out all our calculations in double precision, but also that
any simple analysis and visualisation - based on just the Stokes
I parameter - of the acceleration as a function of frequency and
depth becomes impossible.
In the course of the verification of the correct functioning of
the CARAT code, we were confronted with seemingly strange behaviour
of the flux in very strong lines. Taking the well-known solution
for a Milne-Eddington atmosphere (Rees 1987),
a classical Zeeman triplet and a longitudinal magnetic field,
one derives the following expression for the emerging Stokes I
 |
|
|
(27) |
Under these conditions, the intensity of a moderately strong line
reaches its minimum value of
 at the
respective positions of the -components, with an increase
in flux at the centre of the line (dot-dashed line in
Fig. 6). This familiar picture changes for a stronger
line (dashed) where the flux at the centre decreases below the
value encountered at the respective positions of the
-components, and finally in a line of comparable strength
to that of the Mg II resonance lines, we have I = B0 at
the line centre where
at the
respective positions of the -components, with an increase
in flux at the centre of the line (dot-dashed line in
Fig. 6). This familiar picture changes for a stronger
line (dashed) where the flux at the centre decreases below the
value encountered at the respective positions of the
-components, and finally in a line of comparable strength
to that of the Mg II resonance lines, we have I = B0 at
the line centre where
 (full line). Somewhat
counter-intuitively one now finds a deep central depression;
proceeding outwards, the flux increases until it reaches a
plateau with
at the position of the
-component before attaining the continuum value much
further out.
(full line). Somewhat
counter-intuitively one now finds a deep central depression;
proceeding outwards, the flux increases until it reaches a
plateau with
at the position of the
-component before attaining the continuum value much
further out.
 |
Figure 7:
Mg II
:
run with wavelength
and with logarithmic standard optical depth
of the flux in Stokes I, normalised to the continuum value
at each depth. For the sake of clarity, only the
blue half of the line is displayed. The magnetic field
of strength 2 T is horizontal, the pencil of light in the
direction
 sees a nearly transverse magnetic
field vector (
sees a nearly transverse magnetic
field vector ( ). ). |
| Open with DEXTER |
That such behaviour is not restricted to Milne-Eddington
atmospheres is illustrated in Fig. 7.
The plot of flux in Stokes I vs.
wavelength and depth is characterised by what we may call,
in analogy to oceanography, an "abyssal plain''; again,
plateaus can be recognised, starting just outside the
positions of the -components.
It is possible to derive an analytical expression for the
acceleration in the case of a transversal magnetic field
and a Milne-Eddington atmosphere,
 |
|
|
(28) |
with
 .
A Zeeman split line
will experience considerably less acceleration in its
centre than the unsplit line, but this is slightly
over-compensated by the acceleration in the -components.
The numerical solution shows that this is indeed the case in
the outermost layers, but reveals that throughout the rest of
the atmosphere there is no such sharp drop in acceleration
near the line centre (Fig. 8).
In view of the results displayed in Fig. 6, it comes
as no surprise that the "ridges'' in the amplification surface
which are due to the -components drift towards the wings
of the line, whereas those due to the -components drift
towards the centre, both disappearing at the location of
the "abyssal plain'' where there is no amplification. Only
in the deepest layers where the line opacity decreases,
do we find again the "ridges'' with a much reduced amplitude.
.
A Zeeman split line
will experience considerably less acceleration in its
centre than the unsplit line, but this is slightly
over-compensated by the acceleration in the -components.
The numerical solution shows that this is indeed the case in
the outermost layers, but reveals that throughout the rest of
the atmosphere there is no such sharp drop in acceleration
near the line centre (Fig. 8).
In view of the results displayed in Fig. 6, it comes
as no surprise that the "ridges'' in the amplification surface
which are due to the -components drift towards the wings
of the line, whereas those due to the -components drift
towards the centre, both disappearing at the location of
the "abyssal plain'' where there is no amplification. Only
in the deepest layers where the line opacity decreases,
do we find again the "ridges'' with a much reduced amplitude.
 |
Figure 8:
Mg II
:
run with wavelength
and with logarithmic standard optical depth
of the acceleration per Hertz in a 2 T horizontal field,
relative to the zero field case. For the sake of clarity, only
the blue half of the line is displayed. The acceleration
has been multiplied - for each layer - by a factor
proportional to the index of this layer, in order to
visually enhance the "ridges'' at the bottom of the
atmosphere which otherwise would be hard to detect.
The pencil of light is in the same direction as in
Fig. 7. |
| Open with DEXTER |
 |
Figure 9:
Mg II
:
amplification
(top panel) in a 2 T magnetic field inclined by
with
respect to the vertical and zero-field acceleration (bottom
panel). The full lines give the results for the correct
atomic data, the dash-dotted lines correspond to radiation
damping artifically increased by a factor of 34. A decrease
in abundance by 1 dex leads to the dashed line, a decrease
in oscillator strength by a factor of 100 to the dotted line. |
| Open with DEXTER |
A systematic search yields 10 lines with a ratio of central line
opacity over continuum opacity (at any depth point in the
atmosphere)
 .
There are
another 40 lines with
.
There are
another 40 lines with
 ,
171 lines with
,
171 lines with
 ,
and
584 lines with
,
and
584 lines with
 ,
representing the elements C, N, O, Mg, Al, Si, P, S, Ca, Cr,
Mn, Fe, Ni, Cu, Zn.
,
representing the elements C, N, O, Mg, Al, Si, P, S, Ca, Cr,
Mn, Fe, Ni, Cu, Zn.
It may seem disturbing that, although the very strongest
line in our list is that of Si II
 ,
the acceleration of Si exhibits only modest amplifications.
One has however to keep in mind that the
Si II
line is subject to 5 times
smaller Zeeman splitting and to 34 times higher radiation
damping than the Mg resonance lines. In order to quantify
the effect of damping, we have artificially multiplied the
radiation damping constant of the
Mg II
line by a factor of 34.
Figure 9 demonstrates that the zero-field
acceleration now becomes larger - the full line corresponds
to the original line data, the dash-dotted line to the
artificially high damping - but that amplification drops to
dramatically low values.
,
the acceleration of Si exhibits only modest amplifications.
One has however to keep in mind that the
Si II
line is subject to 5 times
smaller Zeeman splitting and to 34 times higher radiation
damping than the Mg resonance lines. In order to quantify
the effect of damping, we have artificially multiplied the
radiation damping constant of the
Mg II
line by a factor of 34.
Figure 9 demonstrates that the zero-field
acceleration now becomes larger - the full line corresponds
to the original line data, the dash-dotted line to the
artificially high damping - but that amplification drops to
dramatically low values.
A similar experiment can be carried out in view of explaining
the behaviour of Ca. The Ca H and K lines are more than 2 orders of magnitude weaker than the strongest Mg and Si
lines, but Ca is still subject to very large amplifications.
Artificially lowering the strength of the
Mg II
line by a factor of 100,
we find that amplification remains large (dotted line in
Fig. 9); it is also hardly affected
when the abundance is decreased by 1 dex (dashed line).
Thanks to the development of the new object-oriented and
thread-parallel diffusion code CARAT - written entirely in
Ada95 - it has now become possible to calculate reasonably
accurate radiative acceleration vectors in stellar atmospheres
permeated by strong magnetic fields, running the code on
powerful symmetric multiprocessing machines. Taking the atomic
line data from VALD (Piskunov et al. 1995), hydrogen line
opacities from the tables of Stehlé & Hutcheon (1999)
and treating the higher Balmer series members according to
the recipe given in Hubeny et al. (1994), CARAT deals
with line blending and Zeeman splitting in full detail,
employing the Zeeman Fautrier polarised formal solver which
recovers the diffusion approximation at great depths.
![\begin{figure}
\par\includegraphics[width=17cm]{alecianf10.eps} %
\end{figure}](/articles/aa/full/2002/19/aa2226/Timg162.gif) |
Figure 10:
Amplification ratio
 (upper panel),
and
(upper panel),
and
 (lower panel),
computed for a 2 T magnetic field strength. We have plotted
only curves with
(lower panel),
computed for a 2 T magnetic field strength. We have plotted
only curves with
 dex at any depth
in the upper panel, with dex at any depth
in the upper panel, with
 dex in the
lower panel. dex in the
lower panel. |
| Open with DEXTER |
Our extensive and detailed computations convincingly demonstrate
that the effect of Zeeman splitting on radiative accelerations
can be much larger than what had been estimated previously.
Whereas BM claim that even in the
most favourable case (complex Zeeman pattern and horizontal
field), the amplification factor is limited to a value of 2.3,
we have found amplification factors ranging from about 8 to 50 at a field strength of 4 T in elements like Mg, Ca, Fe, Zn.
Even for magnetic fields of 1 T strength, the amplification
factor can reach a value of 4. We therefore conclude that in
general, Zeeman splitting cannot be neglected in diffusion
studies of magnetic stars, that it may well be the main cause
of strong abundance inhomogeneities, and that any conclusions
based on unreliable magnetic geometries and on calculations
including just a few lines must be considered premature.
Our results are also in striking contradiction with the weak
angular dependence of the vertical accelerations and with the
small (10%) difference between respective accelerations for
horizontal and vertical magnetic field found by BM.
In the upper panel of Fig. 10
the maximum acceleration at a field strength of 2 T can be
seen to exceed the minimum value (for vertical field) by
factors of up to 10. Differences of 60% and more between
 and
and
 are encountered for Mg, Ca, Fe, Zn, Ni, Al, and Ga as shown in the bottom panel.
The large amplification factors
and the strong
sensitivity of amplification to the field angle suggests
to us that the correlation between the magnetic geometry
and the abundance inhomogeneities on the surface of magnetic
CP stars may differ significantly from the "canonical'' picture.
The latter supposes that patches of over- or under-abundances
are tied to those regions where the magnetic field lines are
preferentially vertical or horizontal. It would now seem
that abundance enhancements can occur at other places than
the magnetic poles or the magnetic equator; for certain
elements they could conceivably show up as contours about
the curves tracing the field vector inclination of about
to the vertical. In the context of a multipole
surface field structure (see Bagnulo & Landolfi 1999)
abundance maps would become very complicated indeed.
The study of radiative diffusion in the atmospheres of
CP stars permeated by strong magnetic fields has finally
reached the next stage. Instead of having to restrict
ourselves to a few lines, neglecting Zeeman splitting
and employing approximate solutions to the radiative transfer
equation, we can at last rely on (and afford) reasonably
complete atomic transition data - including Landé factors
- together with the correct treatment of magnetic blends and
the use of an accurate polarised radiative transfer. CARAT, an
object-oriented and parallel new code, meets these requirements
and after the incorporation of further physical processes such
as photoionisation and momentum redistribution among ions
we expect it to be an efficient tool in the exploration of
diffusion processes in magnetic CP stars and ultimately in the
modelling of the buildup of abundance inhomogeneities.
Acknowledgements
MJS acknowledges support by the Austrian Science
Fund (FWF), project P12101-AST "Solar and Stellar Magnetic
Polarisation'' and a Visiting Professorship at the
Observatoire de Paris-Meudon (DAEC) and Université Paris 7
(DAEC/LUTH). The calculations have been
carried out on the Sgi Origin 2000 and Origin 3800 of
the CINES in Montpellier. We are heavily indebted to Egidio
Landi Degl'Innocenti for masterly (and patient) explanations
of the workings of polarisation.
-
Alecian, G. 1986, in Upper Main Sequence
Stars With Anomalous Abundances, IAU Colloq. 90,
ed. C. R. Cowley, M. M. Dworetsky, & C. Megessier
(D. Reidel, Dordrecht), 381
In the text
- Alecian, G. 1994, A&A, 289, 885
In the text
NASA ADS
- Alecian, G., & Artru, M.-C. 1987, A&A, 186, 223
In the text
NASA ADS
- Alecian, G., & LeBlanc, F. 2000, MNRAS, 319, 677
NASA ADS
- Alecian, G., & Vauclair, S. 1981, A&A, 101, 16
In the text
NASA ADS
- Alecian, G., & Vauclair, S. 1983, Fund. Cosmic Phys., 8, 369
In the text
NASA ADS
- Auer, L. H., Heasley, J. N., & House, L. L.
1977, ApJ, 216, 531
In the text
NASA ADS
- Babcock, H. W. 1949, ApJ, 110, 126
In the text
NASA ADS
- Babel, J., & Michaud, G. 1991, A&A, 241, 493 (BM)
In the text
NASA ADS
- Bagnulo, S., & Landolfi, M. 1999, A&A, 346, 158
In the text
NASA ADS
- Bagnulo, S., Wade, G. A., Donati, J.-F., et al.
2001, A&A, 369, 889
In the text
NASA ADS
- Baschek, B., Holweger, H., & Traving, G.
1966, Abh. Hamburger Sternwarte, Band VIII, 26
In the text
- Chmielewski, Y. 1979, Publ. Obs. de Genève,
Série B, Fasc. 7
In the text
- Cowley, C. R. 1998,
In the text
ftp://astro.lsa.umich.edu/pub/get/cowley/partition/bolpfn.f
- Däppen, W., Anderson, L., &
Mihalas, D. 1987, ApJ, 319, 195
In the text
NASA ADS
- Gonzalez, J.-F., LeBlanc, F., Artru, M.-C., &
Michaud, G. 1995, A&A, 297, 223
In the text
NASA ADS
- Hubeny, I., Hummer, D. G., & Lanz, T. 1994,
A&A, 282, 151
In the text
NASA ADS
- Hui-Bon-Hoa, A., Alecian, G., & Artru, M.-C.
1996, A&A, 313, 624
In the text
NASA ADS
- Hui-Bon-Hoa, A., LeBlanc, F., &
Hauschildt, P. H. 2000, ApJ, 535, L43
In the text
NASA ADS
- Hui-Bon-Hoa, A., LeBlanc, F., Hauschildt, P. H.,
& Baron, E. 2002, A&A, 381, 197
In the text
NASA ADS
- Hummer, D. G., & Mihalas, D. 1988,
ApJ, 331, 794
In the text
NASA ADS
- Irwin, A. W. 1981, ApJS, 45, 621
In the text
NASA ADS
- Kurucz, R. 1993, CDROM Model Distribution,
Smithsonian Astrophys. Obs.
In the text
- Kuschnig, R., Ryabchikova, T. A., Piskunov, N. E.,
Weiss, W. W., & Gelbmann, M. J. 1999, A&A, 348, 924
In the text
NASA ADS
- Landolfi, M., Landi degl'Innocenti, M.,
& Landi degl'Innocenti, E. 1989, A&A, 216, 113
In the text
NASA ADS
- Landolt-Börnstein 1982, Zahlenwerte und
Funktionen aus Naturwissenschaften und Technik, Neue Serie,
Gruppe VI: Astronomie, Astrophysik und Weltraumforschung,
Band 2, Teilband b, ed. K. Schaifers, & H. H. Voigt, 107
In the text
- Massacrier, G. 1996, A&A, 309, 979
In the text
NASA ADS
- Michaud, G. 1970, ApJ, 160, 641
In the text
NASA ADS
- Michaud, G., Megessier, C., & Charland, Y.
1981, A&A, 103, 244
In the text
NASA ADS
- Mihalas, D. 1978, Stellar atmospheres, 2nd
edition (W.H. Freeman, San Francisco)
In the text
- Montmerle, T., & Michaud, G. 1970, ApJS, 31, 489
In the text
- Piskunov, N. E., Kupka, F., Ryabchikova, T. A.,
Weiss, W. W., & Jeffery, C. S. 1995, A&AS, 112, 525
In the text
NASA ADS
- Rees, D. E. 1987, in Numerical Radiative Transfer,
ed. W. Kalkofen (Cambridge Univ. Press, Cambridge), 213
In the text
- Rees, D. E., Murphy, G. A., & Durrant, C. J.
1989, ApJ, 339, 1093
In the text
NASA ADS
- Seaton, M. J. 1990, J. Phys. B, 23, 3255
In the text
NASA ADS
- Sobelman, I. I. 1979, Atomic Spectra and
Radiative Transitions (Springer, Berlin), 193
In the text
- Stehlé, C., & Hutcheon, R. 1999,
A&AS, 140, 93
In the text
NASA ADS
- Stift, M. J. 1977, Ap&SS, 46, 465
In the text
NASA ADS
- Stift, M. J. 1996, in Model Atmospheres
and Spectrum Synthesis, ed. S. J. Adelman, F. Kupka, &
W. W. Weiss, ASP Conf. Ser., 108, 217
In the text
- Stift, M. J. 1998a, Comp. Phys., 12, 150
In the text
NASA ADS
- Stift, M. J. 1998b, in Reliable Software
Technologies - Ada Europe '98, ed. L. Asplund,
Lect. Notes Comp. Sci., 1411, 128
In the text
- Stift, M. J. 1999, in Solar Polarization,
ed. K. N. Nagendra, & J. O. Stenflo (Kluwer, Dordrecht), 241
In the text
- Stift, M. J. 2000, A Peculiar Newsletter, 33
In the text
- Strasser, S., Landstreet, J. D., & Mathys, G. 2001,
A&A, 378, 153
In the text
NASA ADS
- Traving, G., Baschek, B., & Holweger, H. 1966,
Abh. Hamburger Sternwarte, Band VIII, 1
In the text
- Vauclair, S., Hardorp, J., & Peterson, D. M.
1979, ApJ, 227, 526
In the text
NASA ADS
- Wade, G. A. 2000, in Magnetic Fields of
Chemically Peculiar and Related Stars, ed.
Yu. V. Glagolevskij, & I. I. Romanyuk, Special Astrophysical
Observatory of Russian AS, 132
In the text
- Wade, G. A., Bagnulo, S., Kochukhov, O. P.,
et al. 2001,
A&A, 374, 265
In the text
NASA ADS
Copyright ESO 2002
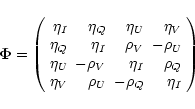
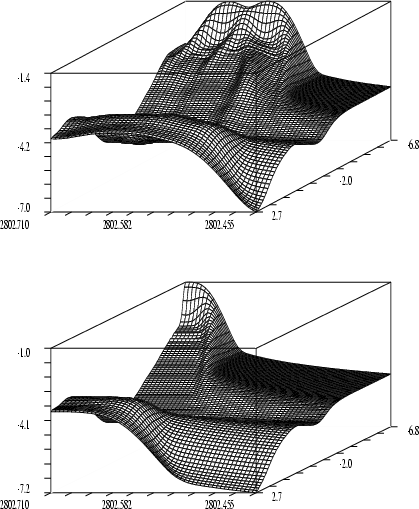
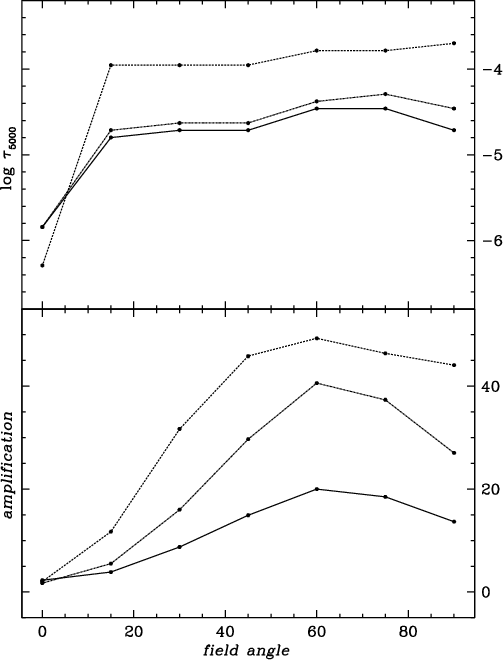
![\begin{figure}
\par\includegraphics[width=16.8cm]{alecianf4.eps}\end{figure}](/articles/aa/full/2002/19/aa2226/img116.gif)
![\begin{figure}
\par\includegraphics[width=14cm]{alecianf5.eps} \end{figure}](/articles/aa/full/2002/19/aa2226/img120.gif)

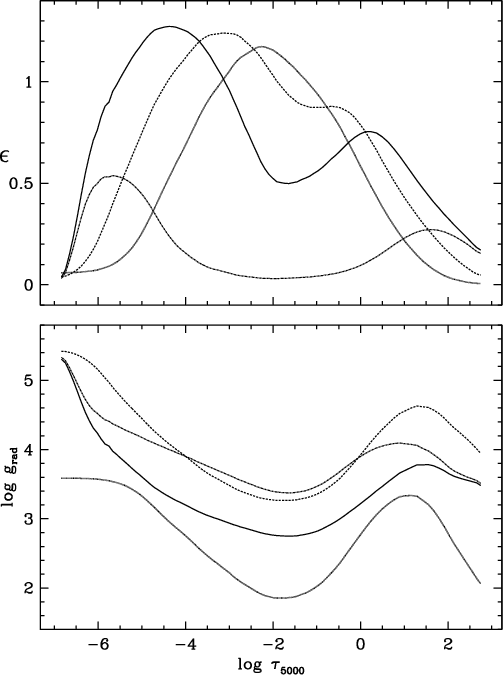
![\begin{figure}
\par\includegraphics[width=17cm]{alecianf10.eps} %
\end{figure}](/articles/aa/full/2002/19/aa2226/img162.gif)