We used a simple model to derive upper limits for the amount of circumstellar
material in the form of grains. In the absence of indications on the dust
composition provided by an accurate infrared spectrum of the dust, we
assumed that the dust is composed of interstellar grains
as described by Draine & Lee (1984). From the optical constants
for this material (a mixture of silicates and graphite with a ratio of
![]() 1.1 by particle number), one computes the mean absorption coefficients
1.1 by particle number), one computes the mean absorption coefficients
![]() of spherical particles as a function of the wavelength and the
particle size using calculations based on the Mie theory (Bohren & Huffman 1983).
Using the standard collisional size distribution, i.e.
n(a) = A a-3.5 (Mathis et al. 1977),
where the constant A ensures
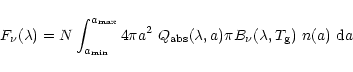
the proper normalization of the distribution, the flux radiated
by a set of N particles at temperature
of spherical particles as a function of the wavelength and the
particle size using calculations based on the Mie theory (Bohren & Huffman 1983).
Using the standard collisional size distribution, i.e.
n(a) = A a-3.5 (Mathis et al. 1977),
where the constant A ensures
the proper normalization of the distribution, the flux radiated
by a set of N particles at temperature ![]() can be written as
can be written as
 |
(1) |
The range of circumpulsar mass limits allowed in the above model by our ISO data and the IRAS/Scanpi data, and for B1534+12 and B1257+12 by the published sub-mm and mm data are shown in Fig. 2.
![\begin{figure}
\par\includegraphics[width=6.7cm,clip]{MS2015f2_B1534.eps}\includ...
...2_J0108.eps}\par\includegraphics[width=9cm,clip]{MS2015f2_B1257.eps}\end{figure}](/articles/aa/full/2002/19/aa2015/img24.gif) |
Figure 2: Allowed range of upper limits of circumpulsar masses for dust temperature between 10 K and 1500 K; continuous line: our model; dashed line: the Foster & Fisher model (1996). |
Each point in the plots of Fig. 2 represents an upper limit on the mass for a given temperature, the range of temperatures being chosen between 10 K (typical lower temperature of interstellar cold dust) and 1500 K (sublimation temperature of silicate dust). For each temperature, a probability density (coded by a grey-level on the left bars in the plots, the color of the points being reported on the bar) is computed by combining the partial probability density functions for each data point. A data point with a true value is assumed to follow a Gaussian partial probability density function with a standard deviation deduced from the error on each data point. A data point which corresponds to a lower limit is assumed to follow a half Gaussian-like partial probability density function for values greater than the data point value and an uniform probability density function for lower values. Most probable values for the temperatures are shown in the plots as the brightest points. The error bars overplotted correspond for each temperature point to 1/1000 of the maximum density of probability. Although the detections obtained in the IRAS beam at the position of pulsars are probably chance coincidences (van Buren & Tereby 1993), their influence on the most probable temperature of the grains is clearly seen in Fig. 2. The extrema of dust mass upper limits corresponding to temperatures 10 K and 1500 K are shown in Table 3.
We have also tested the global dust heating model used by Foster & Fischer (1996)
which assumes that a fraction of the pulsar's spin-down
luminosity is heating a dust disc and gives a relation between the total dust mass in the disc
and the temperature. This
dependance is shown in Fig. 2 as a dashed line overplotted. The pulsars' spin-down
luminosities are shown in Table 1; for each pulsar,
the parameter f expressing the fraction of spin-down
luminosity converted into dust thermal energy is taken as 1 percent (Foster & Fischer 1996).
Figure 2 shows that there is a temperature
![]() corresponding to the same upper limit
of circumpulsar mass in the two models, if we allow f to increase slightly above 1 percent.
These temperatures
corresponding to the same upper limit
of circumpulsar mass in the two models, if we allow f to increase slightly above 1 percent.
These temperatures
![]() are shown in Table 3
together with the corresponding upper limits of circumpulsar masses
are shown in Table 3
together with the corresponding upper limits of circumpulsar masses
![]() in solar mass units.
in solar mass units.
| Pulsar |
|
|
|
|
|
| (kg) | (kg) | (K) | (kg) | ||
| B1534+12 | <1027 | <1020 | 10 | <1027 | <
|
| J2322+2057 | <1030 | <1020 | 30 | <1026 | <
|
| J2019+2425 | <2 1030 | <1020 | 30 | <1026 | <
|
| B0149-16 | <1030 | <1020 | 30 | <1025 | <
|
| B1604-00 | <1030 | <1020 | 30 | <1025 | <
|
| J0108-1431 | <1028 | <
|
30 | <1023 | <
|
| B1257+12 | <1024 | <1019 | 60 | <1023 | <
|
We note that the latter upper limit of circumpulsar
mass for PSR B1534+12 is
30 times smaller than the upper limit of
![]()
![]() obtained by Phillips & Chandler (1994) in the sub-mm
and mm ranges, using the Beckwith et al. (1990) results on
circumstellar discs around T Tauri stars. Greaves & Holland (2000) using
their upper limits of flux at 850
obtained by Phillips & Chandler (1994) in the sub-mm
and mm ranges, using the Beckwith et al. (1990) results on
circumstellar discs around T Tauri stars. Greaves & Holland (2000) using
their upper limits of flux at 850 ![]() m for
B1534+12 and B1257+12, and the Foster & Fisher (1996) model
with grain size 100
m for
B1534+12 and B1257+12, and the Foster & Fisher (1996) model
with grain size 100 ![]() m and a spin-down luminosity set at
m and a spin-down luminosity set at
![]() erg/s
for both pulsars,
deduced upper limits to disc masses typically
lower than 10 Earth masses i.e. <
erg/s
for both pulsars,
deduced upper limits to disc masses typically
lower than 10 Earth masses i.e. <
![]() .
.
Copyright ESO 2002
![\begin{figure}
\par\includegraphics[width=6.2cm,clip]{MS2015f1.eps}\end{figure}](/articles/aa/full/2002/19/aa2015/img23.gif)