A&A 387, 117-128 (2002)
DOI: 10.1051/0004-6361:20020418
Study of the Per OB2 star forming complex
II. Structure and kinematics
A. N. Belikov 1 -
N. V. Kharchenko 2 -
A. E. Piskunov 1 -
E. Schilbach 3 -
R.-D. Scholz 4
1 - Institute of Astronomy of the Russian Acad. Sci., 48 Pyatnitskaya Str., Moscow 109017, Russia
2 -
Main Astronomical Observatory, 27 Academica Zabolotnogo Str., 03680 Kiev, Ukraine
3 -
Astronomisches Rechen-Institut, Mönchhofstraße 12-14, 69120 Heidelberg, Germany
4 -
Astrophysikalisches Institut Potsdam, An der Sternwarte 16, 14482 Potsdam, Germany
Received 3 October 2001 / Accepted 4 March 2002
Abstract
The study of a sky area with a 20 degree diameter
centered on the nearby association Per OB2 has been carried out on
the basis of the "Compiled Catalogue of Astronomical Data in the
Per OB2 Field'' presented in a previous paper. The catalogue contains
about 30 000 stars with accurate proper motions in the Hipparcos
system as well as magnitudes supplemented with spectral classes and
other relevant data. We applied the reduced proper motion technique
to estimate individual distances for almost all catalogue stars. The
distributions of reddening and interstellar extinction were
determined on the basis of the spectral classification of stars in
the area. Proper motions were corrected for differential rotation of
the Galactic disk and parallactic motion effects and used for the evaluation
of association membership. The analysis of a uniform subset
of main sequence (MS) stars earlier than A7 - which is complete within
500 pc - has clearly revealed the association as an area of enhanced
density with an angular size of about  .
In comparison to the
previous results on Per OB2, we show that the presently determined
area extends the association from its classical position towards the
California nebula and the Auriga dark cloud. There are 1025 MS proper
motion members residing in this region. The distance to the
association centre derived from a kinematic calibration is found to
be about 300 pc i.e., in perfect agreement with the Hipparcos data.
The shape of the association is almost spherical, and its diameter
found from stellar counts is about 40 pc. An examination of internal
systematic motions from proper motion data has shown that there is
no evidence of an expansion or a rotation of the association around
the line of sight. The average tangential and spatial velocity
vectors of Per OB2 with respect to the LSR are determined as
.
In comparison to the
previous results on Per OB2, we show that the presently determined
area extends the association from its classical position towards the
California nebula and the Auriga dark cloud. There are 1025 MS proper
motion members residing in this region. The distance to the
association centre derived from a kinematic calibration is found to
be about 300 pc i.e., in perfect agreement with the Hipparcos data.
The shape of the association is almost spherical, and its diameter
found from stellar counts is about 40 pc. An examination of internal
systematic motions from proper motion data has shown that there is
no evidence of an expansion or a rotation of the association around
the line of sight. The average tangential and spatial velocity
vectors of Per OB2 with respect to the LSR are determined as
 km s-1 and
 km s-1.
Key words: stars: distances -
ISM: dust, extinction - stars: Hertzsprung-Russell (HR) and C-M diagrams -
Galaxy: open clusters and associations: individual: Per OB2
For about 50 years, stellar associations have been recognised to be
the best representatives of regions with ongoing or just completed
star formation. Many efforts were undertaken to obtain basic
structural, kinematic and population parameters of these aggregates
both in the Milky Way and in external galaxies (see Blaauw
1964 and Efremov 1989 for references to early works, or
Sakhibov & Smirnov 2000 for an example of the systematic
study of extragalactic association populations).
The major problem in the study of nearby associations is the large
area they occupy and the low apparent surface density which makes
it difficult to separate members from rich fore/background
field stars. Therefore, the most reliable method for the separation
of the association from field stars is the kinematic selection based on
proper motions. Compared to star clusters usually occupying rather
limited sky regions, associations require proper motion surveys over
fields covering a few hundred square degrees. In the pre-Hipparcos
era this constrained the studies to bright stars having spectral
classification. Therefore, the number of detected members did not
exceed a few tens of stars. As a result, in spite of major efforts,
detailed knowledge about the size, structure, kinematics, and population
statistics was not obtained, especially for nearby OB associations.
![\begin{figure}
\par\includegraphics[angle=-90,width=11.6cm,clip]{MS1966f1.ps} \end{figure}](/articles/aa/full/2002/19/aa1966/Timg15.gif) |
Figure 1:
A map of the area covered by the CC (shown by the large
circle). Dots are stars from the Tycho2
catalogue, plus signs are Blaauw' (1952), and crosses are
Hipparcos' (de Zeeuw et al. 1999) members of the Per OB2 association. The thin solid curve shows the CO-emission contours
from Ungerechts & Thaddeus (1987) survey. The small square
is the field covered by the proper motion survey of Scholz et al. (1999) in the vicinity of IC 348. The grey symbols with
numbers mark: 1 - the young cluster IC 348, 2 - the open cluster
NGC 1342, 3 - the position of the embedded cluster NGC 1333, 4 - the
Pleiades open cluster, and 5 - California emission nebula
NGC 1499. |
| Open with DEXTER |
After the completion of the Hipparcos mission, the astronomical
community was provided with a tool perfectly suited for the
investigation of nearby associations. There are two catalogues
(Hipparcos and Tycho-1) compiled directly from the results of the
Hipparcos mission as well as several others related to them: ACT RC,
TRC and Tycho-2 which make use of earlier epoch data from the
Astrographic Catalogue. These data are the
realisation of a single and homogeneous astrometric and photometric
system over the whole sky, which can hardly be achieved with ground
based observations.
The work of de Zeeuw et al. (1999) presents the Hipparcos
census of 12 nearby associations located less than 650 pc from the Sun.
The membership determination for these stellar groups is based on the
kinematic convergent point and the "spaghetti'' criteria. The new
data and selection methods provide an improved membership
determination which corrects and updates the pre-Hipparcos lists of
B-, A-type members of these groups. Typically, 100 members per association
were found by Zeeuw et al. (1999). This should be compared
with a few tens of stars per association known before Hipparcos.
Based on the highly accurate Hipparcos data (parallaxes and proper
motions), the distances of the association were improved, and
spatial motions were computed.
The study of de Zeeuw et al. (1999) is of fundamental
importance for forthcoming investigations of nearby associations,
but it does not exhaust the full potential of the catalogues related
to Hipparcos. The Hipparcos catalogue itself is complete only for
bright stars and does not provide sufficient statistics for a
systematic study of populations in nearby associations which requires
a completeness at V>10 mag. The Tycho-2 catalogue contains about
twenty times more stars and is complete down to about four magnitudes
fainter than the Hipparcos catalogue. On the northern sky there is a
recently published deeper catalogue FONAC (Kislyuk et al. 1999)
for stars listed in the Astrographic Catalogue. For the nearest
associations, Tycho-2 and FONAC provide a completeness of F and G stars
and can be used for the study of Pre-MS branches in their CMDs and
LFs which are of a key importance in understanding the history of
star formation and of the IMFs in these aggregates.
Per OB2 is one of the nearest OB associations that has been
attracting the attention of many investigators (see de Zeeuw et
al. 1999 for references). At a Galactic latitude of
 ,
the association is projected on a relatively poor
stellar background which is an advantage for the membership
determination. On the other hand, its kinematics do not differ considerably
from the kinematics of field stars. This leads to uncertainties in the
overall membership determination based on proper motions. For example, out of 17
classical pre-Hipparcos members, Hipparcos confirmed only about half
of them (de Zeeuw et al. 1999). This underlines the importance
of a systematic study of the selection of association members with a
higher reliability.
,
the association is projected on a relatively poor
stellar background which is an advantage for the membership
determination. On the other hand, its kinematics do not differ considerably
from the kinematics of field stars. This leads to uncertainties in the
overall membership determination based on proper motions. For example, out of 17
classical pre-Hipparcos members, Hipparcos confirmed only about half
of them (de Zeeuw et al. 1999). This underlines the importance
of a systematic study of the selection of association members with a
higher reliability.
For this purpose, we compiled a catalogue (Belikov et al. 2002,
referred hereafter as Paper I) containing the Per OB2 region with a diameter
of 20 degrees centered at
 (
(
 ,
see Fig. 1).
The Compiled Catalogue (CC) is based on published astronomical data including
Hipparcos, Tycho-2, and FONAC. It contains about 30 000 stars,
and is complete down
to V=11.6 mag. Heterogeneous data are reduced into homogeneous systems:
e.g., the coordinates and proper motions are in the Hipparcos system,
the photometry is in the Johnson system.
,
see Fig. 1).
The Compiled Catalogue (CC) is based on published astronomical data including
Hipparcos, Tycho-2, and FONAC. It contains about 30 000 stars,
and is complete down
to V=11.6 mag. Heterogeneous data are reduced into homogeneous systems:
e.g., the coordinates and proper motions are in the Hipparcos system,
the photometry is in the Johnson system.
The region covered by the CC has a complex structure: it includes
dark and dense clouds, young stellar groups and OB stars. Dust clouds
distributed both within the association and between the association
and the Sun (see e.g. Cernis 1993) screen
different parts of the area studied. In Fig. 1 we show
a map of the wider neighbourhood of the studied region for stars
brighter than V = 11.6 mag.
In the present study we aim to:
- 1.
- select a complete sample of Per OB2 members based
on accurate proper motions corrected for systematic
effects (differential Galactic rotation and parallactic motion);
- 2.
- study interstellar extinction in the area of the association
based on accurate photometry and spectral classification
data;
- 3.
- determine the structural parameters of Per OB2 (distance and
size) and of its internal (expansion and/or rotation) and mean
motion.
This paper has the following structure: in Sect. 2 we
describe a procedure for the construction of a kinematically
calibrated distance scale and its properties. Section 3 is
devoted to the study of the distribution of interstellar extinction
in the neighbourhood of Per OB2. In Sect. 4 we discuss
the adopted algorithm of the membership determination and the
resulting samples. Spatial structure and kinematics of the association
are derived in Sects. 5 and 6.
In Sect. 7 we discuss and summarise the results.
2 The reduced proper motion calibration with
absolute magnitude and distance
As the analysis in Paper I shows, the proper motion members of the
Per OB2 association are distributed over the whole area covered by
the CC. At the average distance of 300 pc adopted for the association
(see Paper I and references therein), this leads to a total diameter of
the association of at least 100 pc. Since both lengths are of the
same order, a spatial (3-dimensional) approach to the study of the
region seems to be mandatory.
Unfortunately, individual distances can be derived only for
a small fraction of CC stars by
conventional methods (e.g., from Hipparcos parallaxes or from a
spectral class - absolute magnitude calibration).
Therefore, we decided to use the reduced proper motion technique for
the distance evaluation
(see e.g. Jones 1972; Chiu 1980).
For each star, we computed the "reduced proper motion'' HV from
its magnitude V and proper motion  as
as
where
is in arcsec/yr.
In order to calibrate the HV-based distance scale, we derived
relations between the absolute magnitudes of dwarf
stars![[*]](/icons/foot_motif.gif) of
different spectral classes and the corresponding mean reduced proper
motions. For dwarf stars with known spectral classes the average
values
of
different spectral classes and the corresponding mean reduced proper
motions. For dwarf stars with known spectral classes the average
values
 have been computed for each spectral group,
with typically a few dozens of stars in each group, and compared with
the absolute magnitudes
have been computed for each spectral group,
with typically a few dozens of stars in each group, and compared with
the absolute magnitudes
 from the tables of
Schmidt-Kaler (1982). We have found that within the CC both values
are in perfect correlation:
from the tables of
Schmidt-Kaler (1982). We have found that within the CC both values
are in perfect correlation:
 |
(1) |
We compared Schmidt-Kaler's absolute magnitudes and colours
for luminosity class V with the Hipparcos (Hipp) spectral
calibration of Houk et al. (1997), and found that both scales
are in good agreement. The corresponding least-squares solutions for absolute
magnitudes
and for intrinsic colours
of B8-G8 dwarfs do not show any significant difference. We
conclude that the Schmidt-Kaler calibration is in agreement with the
Hipparcos scale. However, for later
spectral types the calibrations differ significantly, and the
corresponding distances could be considerably biased.
Taking into account Eq. (1), we can compute
MVHV for each star. The corresponding distance scale can be
obtained from
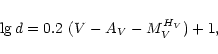 |
(2) |
and should be close to the Hipparcos system. For stars with known
MK-classification, the comparison of MK- and HV-calibrated
distances gives a kind of "internal'' error of the calibration which
depends mainly on kinematic inaccuracies (e.g., proper motion
errors, neglecting of the random orientation of individual velocity
vectors). For d<600 pc, we found that the relative
distance differences
(dMK-dHV)/dMK are randomly
distributed with an average of  % and a standard deviation
of 22%. The "external'' accuracy can be evaluated from the
comparison with Hipparcos parallaxes. For a sample of 102 MS
stars within 500 pc and with
% and a standard deviation
of 22%. The "external'' accuracy can be evaluated from the
comparison with Hipparcos parallaxes. For a sample of 102 MS
stars within 500 pc and with
 mas,
mas,
 mas/y,
 ,
,
 we obtained the mean difference
 of
of  % with a standard
deviation of 52%. In this case, the differences are caused by both
parallax and kinematic errors. Therefore, we concluded that our
kinematic calibration is accurate within 20 to 50%.
% with a standard
deviation of 52%. In this case, the differences are caused by both
parallax and kinematic errors. Therefore, we concluded that our
kinematic calibration is accurate within 20 to 50%.
![\begin{figure}
\par\includegraphics[width=8.8cm,clip]{MS1966f2.ps} \end{figure}](/articles/aa/full/2002/19/aa1966/Timg34.gif) |
Figure 2:
Model distribution of HV-calibrated distances (filled
histogram) for rectangular initial profiles (
 pc)
located at different average distances (
pc)
located at different average distances ( )
where n is
normalised number of stars within a distance range. Upper panel: )
where n is
normalised number of stars within a distance range. Upper panel:
 pc. The hatched histogram corresponds to the profile with pc. The hatched histogram corresponds to the profile with
 pc, located at the same distance. Middle panel:
 pc, bottom panel: pc, bottom panel:
 pc. pc. |
| Open with DEXTER |
In order to better understand the properties of the adopted distance
indicator d, we have constructed a model of the studied population
based on the Monte Carlo method. The model describes a
stellar group of finite size  ,
with a center located at the
distance
from the Sun and predicts an observed distribution of
stars as a function of d.
,
with a center located at the
distance
from the Sun and predicts an observed distribution of
stars as a function of d.
We assumed that the stars are of the same age and they are
distributed along an appropriate isochrone (
 )
with the
Salpeter initial mass function (IMF). The spatial distribution of the
stars is approximated by a rectangular profile. The group has an
average spatial motion with respect to the Local Standard of Rest
(LSR) which is similar to that of the Per OB2 complex. We also
assumed that the stars show a
random internal motion with a dispersion of 1 km s-1.
The observed photometric and proper motion errors, typical
for the CC, were adopted for the model sample, too.
)
with the
Salpeter initial mass function (IMF). The spatial distribution of the
stars is approximated by a rectangular profile. The group has an
average spatial motion with respect to the Local Standard of Rest
(LSR) which is similar to that of the Per OB2 complex. We also
assumed that the stars show a
random internal motion with a dispersion of 1 km s-1.
The observed photometric and proper motion errors, typical
for the CC, were adopted for the model sample, too.
In Fig. 2 we show the model distribution of HV-calibrated
distances d for
stellar groups with a size of
pc, located at
different distances (
 pc). Two conclusion can be
drawn: at larger distances the width of the distribution
increases, and the maximum of the distribution systematically moves
to smaller distances compared to the averaged distance assumed for
the group (similar to the Lutz-Kelker bias in the determination of
averaged distances from parallax measurements). The upper panel
compares the distributions of two groups of different sizes:
pc). Two conclusion can be
drawn: at larger distances the width of the distribution
increases, and the maximum of the distribution systematically moves
to smaller distances compared to the averaged distance assumed for
the group (similar to the Lutz-Kelker bias in the determination of
averaged distances from parallax measurements). The upper panel
compares the distributions of two groups of different sizes:  0.1 and 50 pc. As both groups produce
d-distributions of the same width, we can conclude that the
finite size of a group cannot be regarded as the primary reason
for the distribution widening. The basic factors distorting the
distance distributions are internal motion and errors in the
kinematic data. Indeed, an internal velocity dispersion of 1 km s-1leads to a proper motion dispersion of 1 mas/yr at a distance of
about 200 pc which, in turn, corresponds to a typical proper motion
error of brighter stars in the CC.
0.1 and 50 pc. As both groups produce
d-distributions of the same width, we can conclude that the
finite size of a group cannot be regarded as the primary reason
for the distribution widening. The basic factors distorting the
distance distributions are internal motion and errors in the
kinematic data. Indeed, an internal velocity dispersion of 1 km s-1leads to a proper motion dispersion of 1 mas/yr at a distance of
about 200 pc which, in turn, corresponds to a typical proper motion
error of brighter stars in the CC.
In order to use the HV-calibrated distances for the determination
of the average distance to the association, we must introduce a correction
for the bias described above.
From model calculations we found that the average
distance to the association
can be derived from a relation
 |
(3) |
where
 is position of the maximum of the observed
distribution and k is a factor ranging within 0.82
is position of the maximum of the observed
distribution and k is a factor ranging within 0.82  0.88.
This relation is valid for a distance of
0.88.
This relation is valid for a distance of
 pc and
for an association depth of
pc and
for an association depth of
 pc.
pc.
3 Interstellar extinction toward the Per OB2 complex
As in any other star forming region, extinction in the Per OB2 area
varies in the face-on plane as well as along the line of sight (see
e.g. Cernis 1993 and Ungerechts &
Thaddeus 1987). In this section we develop the appropriate
tool for the reddening study, discuss the spatial distribution of the
interstellar extinction towards the Per OB2 complex and provide the
extinction corrections for the majority of stars of the CC.
According to the type of data available for the evaluation of the interstellar
extinction, we divided stars from the CC into three groups:
- 1.
- 619 stars with known spectra and luminosity classes;
- 2.
- 5968 stars with known spectra but missing luminosity
classes;
- 3.
- 19925 stars without information on spectra and luminosity classes
but with proper motions available.
For all these stars B,V-magnitudes are available in the CC. To obtain the
extinction parameters for stars
of group 1, we used the following relations:
The intrinsic colours (B-V)0 and absolute magnitudes MV were
taken from the tables of Schmidt-Kaler (1982). For the
values of R0 and q which are functions of temperature and
luminosity class we used data given by Straizys (1977).
As a result, the reddening E(B-V),
extinction AV, and distance modulus V0-MV were obtained for
527 stars. For the remaining stars, no consistent solutions were
found. Therefore, they were moved to group 3.
The missing luminosity classes for the stars in group 2 were
derived by use of the reduced proper motion-colour diagram
(
HV, (B-V)) where the domains of the main sequence and giant stars
were identified by stars with known luminosity classes (group 1).
Then, AV, E(B-V), RV and
(m-M)0 were computed by the same procedure as described above.
For 4850 stars,
the solution was accepted, the remaining stars were moved to group 3.
![\begin{figure}
\par\includegraphics[width=8.8cm,clip]{MS1966f3.ps} \end{figure}](/articles/aa/full/2002/19/aa1966/Timg46.gif) |
Figure 3:
The extinction map of the Per OB2 region based on
the data of 2929 stars from groups 1 and 2.
The extinction value is shown by gray
colour according to the scale at the bottom of the figure. Solid
curves represent the CO-emission contours from the survey by
Ungerechts & Thaddeus (1987). The plus sign marks the
position of the young cluster IC 348. |
| Open with DEXTER |
For the determination of the reddening and extinction for stars from
group 3, we made use of a map of the spatial distribution of
the extinction in the region covered by the CC. The extinction map
was constructed from the data of stars selected from
groups 1 and 2.
First, we excluded stars with poor photometry
where
 is the rms-error of the colour. We
restricted the sample to main sequence stars since the intrinsic
colour calibration for red giants is too uncertain.
In Fig. 3 we show the extinction pattern based
on 2929 reference stars selected from groups 1 and 2. A remarkable
correlation of optical extinction and CO-emission intensity is
obvious.
is the rms-error of the colour. We
restricted the sample to main sequence stars since the intrinsic
colour calibration for red giants is too uncertain.
In Fig. 3 we show the extinction pattern based
on 2929 reference stars selected from groups 1 and 2. A remarkable
correlation of optical extinction and CO-emission intensity is
obvious.
Individual extinction values AV for stars of group 3
were computed from Eq. (2) solved by an iterative procedure.
The initial approximation of the distance dwas calculated with AV=0. Then, the value of AV was derived as
the average of the AV-values of the 5 nearest reference stars used for
the construction of the extinction map.
The iteration was stopped when the difference between successive dvalues was less than 1 per cent, or when the number of iterations
exceeded 20. In the latter case, this star was not considered
further.
![\begin{figure}
\par\includegraphics[width=8.8cm,clip]{MS1966f4.eps}\end{figure}](/articles/aa/full/2002/19/aa1966/Timg49.gif) |
Figure 4:
Distribution of the CC stars with
the reddening E(B-V) (hatched) and interstellar
extinction AV (filled). |
| Open with DEXTER |
The distributions of 26380 CC stars versus reddening E(B-V) and
extinction AV are shown in Fig. 4. According to this
plot, the typical reddening for the studied area is not very strong
with
 mag, although the maximum
reaches 1 mag. The typical extinction of
mag, although the maximum
reaches 1 mag. The typical extinction of
 mag in the Per OB2 direction accumulated at a
distance of 0.5 kpc, is higher than the average value a0 = 1.6mag/kpc usually assumed for the Galactic plane.
The estimated E(B-V) and AV values have been added to
the actual CC version currently stored at the CDS.
mag in the Per OB2 direction accumulated at a
distance of 0.5 kpc, is higher than the average value a0 = 1.6mag/kpc usually assumed for the Galactic plane.
The estimated E(B-V) and AV values have been added to
the actual CC version currently stored at the CDS.
Although almost all CC stars got distance and reddening values, only
the results for main sequence stars with spectral classes earlier
than G8 can be regarded as sufficiently reliable. These stars are
flagged in the CC and used in our following study.
We compared the computed values of AV for 174 stars of groups 1, 2
and 33 stars of group 3 with published data
(Seyfert et al. 1960; Cernis 1990; Cernis 1993).
Average differences between the values derived in this paper and
published absorption values are
 mag for groups 1, 2
and
mag for groups 1, 2
and
 mag for the remaining stars, which indicates that a
systematic bias is practically absent. The corresponding standard
deviations of the differences are 0.19 mag and 0.25 mag. Since
the typical value of AV is 1.0 mag (see Fig. 4),
we conclude that our extinction values are accurate within 20% for
the stars of groups 1, 2 and within 25% for the remaining CC stars.
mag for the remaining stars, which indicates that a
systematic bias is practically absent. The corresponding standard
deviations of the differences are 0.19 mag and 0.25 mag. Since
the typical value of AV is 1.0 mag (see Fig. 4),
we conclude that our extinction values are accurate within 20% for
the stars of groups 1, 2 and within 25% for the remaining CC stars.
4 Association membership
In Paper I, we used proper motions to compute probabilities of the
belonging of stars to the Per OB2 association. Now, with individual
distances for each CC star, we can check or even improve the
membership determination.
Member selection based on kinematic criteria makes use of the fact, that
stars belonging to a moving group (a cluster, an association, etc.)
have practically the same spatial velocities. For a proper
implementation of the kinematic approach, we must, therefore,
take into account the influence of systematic motions on stellar kinematics.
The most prominent biases are the differential rotation of the
Galactic disk and the Solar spatial motion. Stars of the CC
occupy an area of the sky with a diameter of about 20 degrees, and
the depth of the CC sample along the line of sight exceeds 500 pc.
Thus, for stars located in the centre or at the borders of the
region, respectively, the velocities due to parallactic motion or
differential rotation differ by  3-4 mas/yr in angular and
3-4 km s-1 in linear scales. The mean
motion of the association as well as the peculiar internal motions
are of the same order of magnitude, too. Therefore, independent of
the kinematic parameter (proper motion, tangential, radial or spatial
velocity) used for the calculation of membership probability, it has
to be corrected for the effect of systematic motions.
3-4 mas/yr in angular and
3-4 km s-1 in linear scales. The mean
motion of the association as well as the peculiar internal motions
are of the same order of magnitude, too. Therefore, independent of
the kinematic parameter (proper motion, tangential, radial or spatial
velocity) used for the calculation of membership probability, it has
to be corrected for the effect of systematic motions.
In order to take into account both biases, we used data based on
Hipparcos.
The corrections were computed in a rectangular coordinate system
(X,Y,Z) centered on the Sun where the corresponding space velocity vector
is (U,V,W). The X and U axes point towards the Galactic anticenter
 ,
Y and V are directed towards Galactic
rotation
,
Y and V are directed towards Galactic
rotation
 ,
and Zand W towards the North Galactic Pole
,
and Zand W towards the North Galactic Pole
 .
The Solar velocity with respect to the LSR in this
system was adopted according to Dehnen & Binney (1998) as
.
The Solar velocity with respect to the LSR in this
system was adopted according to Dehnen & Binney (1998) as
 0.36, +5.23
0.62,
+7.17
0.38) km s-1. Values of Oort constants were taken from Feast
& Whitelock (1997):
0.36, +5.23
0.62,
+7.17
0.38) km s-1. Values of Oort constants were taken from Feast
& Whitelock (1997):
 ,
and
,
and
 km s-1/kpc.
The corresponding corrections of the proper motion  and radial
velocity
and radial
velocity
 were computed from the following equations:
where  .
The corrections of tangential velocities were
derived from
.
The corrections of tangential velocities were
derived from
 with
with
 |
(5) |
Vl,b is a component of tangential velocity in l or bdirection in units of km s-1 whereas proper motions
 and
distance d are given in units of mas/yr and kpc, respectively.
The first three relations in
(4) refer to the effect of differential rotation, the
remaining three deal with the effect of parallactic motion.
The derived corrections were subtracted from the
observations. Due to the proximity of the association, the
corrections of the second order can be safely neglected (they are
only significant for distances exceeding 1 kpc).
and
distance d are given in units of mas/yr and kpc, respectively.
The first three relations in
(4) refer to the effect of differential rotation, the
remaining three deal with the effect of parallactic motion.
The derived corrections were subtracted from the
observations. Due to the proximity of the association, the
corrections of the second order can be safely neglected (they are
only significant for distances exceeding 1 kpc).
From the proper motions corrected for systematic motions, we re-computed
HV-values. Only for 1% of the CC stars, HV-values changed by
more than 0.2 mag.
We conclude that the calibration error arising due to neglecting
systematic motions is comparable with the calibration accuracy (see
Eq. (1)).
Although Per OB2 is not clearly separated from field stars in
proper motion space, we were able to detect two association
populations (A and C) in Paper I and calculate membership
probabilities based on proper motions, respectively  and
and  .
We attributed the difference in average proper motions of the groups
to their different location within the association, i.e., population
C represents the part of the association near to the Sun, whereas
population A consists of the rest of association members.
.
We attributed the difference in average proper motions of the groups
to their different location within the association, i.e., population
C represents the part of the association near to the Sun, whereas
population A consists of the rest of association members.
With individual distances of the stars available, we can compute
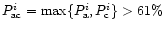
membership probabilities  based on tangential velocities,
describing the association as a whole. According to Eq. (2) of
Paper I, we computed
for a star i as
based on tangential velocities,
describing the association as a whole. According to Eq. (2) of
Paper I, we computed
for a star i as
![\begin{displaymath}%
P_{\rm t}^i=\exp \left \{-\left [\left (\frac{V^i_l- \overl...
...V}_b}{2~\varepsilon^i_{V_b}}\right )^2 \right ]
\right \}\cdot
\end{displaymath}](/articles/aa/full/2002/19/aa1966/img77.gif) |
(6) |
Here Vil and Vib are the components of the
tangential velocity of a star i computed from proper motions
corrected for differential rotation and parallactic motion in
accordance with Eqs. (4) and (5);
 and
and
 are the
corresponding mean errors. The averaged tangential velocities
are the
corresponding mean errors. The averaged tangential velocities
 and
and
 were found in a
series of iterative steps. As an initial approximation,
and
were computed for a
sample with the combined proper motion probability
were found in a
series of iterative steps. As an initial approximation,
and
were computed for a
sample with the combined proper motion probability
 .
Taking into account the corresponding
membership probabilities
as well as structural and kinematic
aspects considered in Sects. 5 and 6,
the initial sample was then refined and the next approximation of
and
was computed. The
iterations were repeated until the distribution parameters converged.
The final value of the parameter vector was found after six
iterations as
.
Taking into account the corresponding
membership probabilities
as well as structural and kinematic
aspects considered in Sects. 5 and 6,
the initial sample was then refined and the next approximation of
and
was computed. The
iterations were repeated until the distribution parameters converged.
The final value of the parameter vector was found after six
iterations as
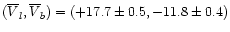 km s-1.
In the case of an association whose size is comparable to its
distance from the Sun, the proper motions of nearest and farthest
association members could show significant differences. Therefore, a
membership probability derived from the proper motion distribution
can lead to underselection of actual members. It is exactly where we
were confronted trying the membership determination from proper
motions in the Per OB2 area (see Paper I). A membership selection
based on tangential velocities will yield a more complete sample,
although, with a higher admixture from distant background stars: due
to the small peculiar velocity (
and
)
of the association and due to increasing
errors of the tangential velocities (
and
)
with distances, background stars have "a
good chance'' to get larger membership probabilities
in
Eq. (6). On the other hand, these stars can be
excluded from the association sample by using spatial
membership criteria and/or from their location on the CMDs.
Note that a membership sample based on the
proper motion criterion may miss a considerable number of association members
but it is also not free of a contamination by field stars, although,
the proportion of distant background stars is smaller.
Considering CMD criteria, we found 2065 red giants among 6172 stars
brighter than V=13 mag which had been classified as probable members
via Eq. (6). In order to estimate the fraction of field stars
among the remaining 4107 main sequence stars, we analysed the distributions
of their tangential velocities. For the separation of two-dimensional
distribution functions, we adopted a technique based
on the method of maximum likelihood (Kharchenko & Schilbach 1995).
As a result,
the sample was divided into two co-moving groups with different
dispersions of tangential velocities, where the group with a larger dispersion
was identified to be field stars (920 stars or 22%). Applying
the same approach to the total sample of 6172 stars, we obtained
a fraction of about 40% of co-moving field stars.
From the comparison of the results on the membership determination
with the membership list of de Zeeuw et al. (1999), we found
that out of 38 stars in common 10 (24) are probable
(
 )
and 8 (14) are possible (
)
and 8 (14) are possible (
 )
members, whereas
20 (1) are field (
)
members, whereas
20 (1) are field (
 )
stars. In parenthesis we show the
corresponding number of proper motion members found in Paper I.
This comparison supports the result of the interloper analysis
by de Zeeuw et al. (1999) who found that about 40% of their Per OB2
proper motion members might be co-moving field stars.
All 6 late-type members ((B-V)>1 mag) identified by de Zeeuw et
al. (1999) turned out to be field stars. Again, this result is
consistent with suggestion of de Zeeuw et al. (1999) that their
late-type members are possible interlopers.
Out of 17 classical Per OB2 members of
Blaauw (1952) we find that 5 are probable, 8 are possible
members, and 4 are field stars.
)
stars. In parenthesis we show the
corresponding number of proper motion members found in Paper I.
This comparison supports the result of the interloper analysis
by de Zeeuw et al. (1999) who found that about 40% of their Per OB2
proper motion members might be co-moving field stars.
All 6 late-type members ((B-V)>1 mag) identified by de Zeeuw et
al. (1999) turned out to be field stars. Again, this result is
consistent with suggestion of de Zeeuw et al. (1999) that their
late-type members are possible interlopers.
Out of 17 classical Per OB2 members of
Blaauw (1952) we find that 5 are probable, 8 are possible
members, and 4 are field stars.
5 Spatial structure of the region
In order to avoid biases related to the incompleteness of the data as
well as to the low precision of the distance and reddening scales for
red giants, we consider in this section a sample restricted to main
sequence stars earlier than spectral class A7 and brighter than
V=11.6 mag (the completeness limit of the CC). The sample, which is
called hereafter MS500, provides completeness for stars earlier than
A7 within about 500 pc, i.e., within the distance where the
association is expected to be located, and includes 4305 stars
out of 26337 CC stars with HV-calibrated distances. According to
Eq. (6), 891 stars from MS500 are probable members of
the Per OB2 association.
![\begin{figure}
\includegraphics[width=8.8cm,clip]{MS1966f5.ps}\end{figure}](/articles/aa/full/2002/19/aa1966/Timg87.gif) |
Figure 5:
The distribution of MS500 probable members (
 )
of the Per OB2 complex in the (l,b)-plane. The grey colour scale
shown at the bottom of the plot indicates different levels of surface
density. The solid curve outlines the CO-emitting regions related to
dust clouds from the survey of Ungerechts &
Thaddeus (1987). The California nebula area is outlined by a
dashed curve. The plus sign denotes the position of IC 348. The
rectangular area indicated by a thin line contains the association.
The Per OB2a and Per OB2b areas are separated with a line according
to Eq. (7) and are marked with letters. )
of the Per OB2 complex in the (l,b)-plane. The grey colour scale
shown at the bottom of the plot indicates different levels of surface
density. The solid curve outlines the CO-emitting regions related to
dust clouds from the survey of Ungerechts &
Thaddeus (1987). The California nebula area is outlined by a
dashed curve. The plus sign denotes the position of IC 348. The
rectangular area indicated by a thin line contains the association.
The Per OB2a and Per OB2b areas are separated with a line according
to Eq. (7) and are marked with letters. |
| Open with DEXTER |
In Fig. 5 we show the density distribution of Per OB2
probable members in the face-on plane. The main feature
of Fig. 5 is a strong correlation of the apparent
density pattern with the distribution of dust clouds. It seems as if
the association has a genetic relation to a "cavity'' separating the
Auriga (in the North) from the Taurus and Perseus (in the South)
clouds. The surface density of the members ranges from 3 to 8
stars/deg2 within this cavity whereas it is typically less than
4 stars/deg2 in the outer regions. Two peripheral areas at
(l,b) =
 and at
 )
with an enhanced density are random concentrations of field stars, as
can be concluded from their CMDs. The southern part (
)
with an enhanced density are random concentrations of field stars, as
can be concluded from their CMDs. The southern part (
 )
of the central concentration denoted as Per OB2a
coincides with the classical position of the association (cf.
Fig. 1). The northern part (Per OB2b) is bending
around the California nebula which possibly hides a part of the
association. Below, we discuss both regions in detail.
)
of the central concentration denoted as Per OB2a
coincides with the classical position of the association (cf.
Fig. 1). The northern part (Per OB2b) is bending
around the California nebula which possibly hides a part of the
association. Below, we discuss both regions in detail.
Although probable association members from MS500 show a clear
concentration in the central part of the CC area, many of them are
widely distributed across the studied field. It is reasonable to
propose that the latter are background stars contaminating the
sample. We can prove this assumption from the distribution of
individual HV-calibrated distances.
![\begin{figure}
\par\includegraphics[width=8.8cm,clip]{MS1966f6.eps} \end{figure}](/articles/aa/full/2002/19/aa1966/Timg91.gif) |
Figure 6:
Observed distribution of MS500 stars with
HV-calibrated distances. Filled histogram - probable members
(
 )
of Per OB2, hatched histogram - the remaining
MS500 stars ( )
of Per OB2, hatched histogram - the remaining
MS500 stars (
 ). The curve shows the model distribution of the MS
stars earlier than A7, which mimics MS500 field stars. The dotted
vertical line shows the completeness limit for A7V stars. ). The curve shows the model distribution of the MS
stars earlier than A7, which mimics MS500 field stars. The dotted
vertical line shows the completeness limit for A7V stars. |
| Open with DEXTER |
In Fig. 6 we show the distribution of MS500 stars with
distance. The distribution of field stars
rapidly increases up to a distance of about 120 pc, then the growth
rate slows down, and beyond 300 pc the distribution begins to decrease
even within the assumed completeness zone. After about 600 pc the
distribution shows a long tail. The distribution of probable members
is narrower due to the lack of foreground stars, and displays again a
tail of distant stars.
The above details can be understood either in terms of the geometry
of the region or in terms of the calibration procedure used for
distances. For comparison, a predicted distribution of main sequence
stars earlier than A7 and brighter than V = 11.6 is shown. It was
computed in accordance with a model of galactic counts (see
Kharchenko & Schilbach 1996) for this region.
The sharp increase of the distribution at small distances simply reflects
the increase of the observed spatial volume. The drop of the
distribution after its maximum is a property of the magnitude limited
sample of the field star population. It occurs when the fainter
limit of absolute magnitudes of the stars forming the sample at a given distance
passes the turning point of the field luminosity function
dividing flat and steep portions of the LF (
 mag for the local
LF). Then the increase of the observed space is unable to compensate for the
rapidly decreasing fraction of sufficiently luminous stars, and the
distribution begins to decline. The position of the
maximum in Fig. 6 depends on the limiting magnitudes of the
sample in apparent and absolute scales (11.6 and 2.3 mag in our case).
mag for the local
LF). Then the increase of the observed space is unable to compensate for the
rapidly decreasing fraction of sufficiently luminous stars, and the
distribution begins to decline. The position of the
maximum in Fig. 6 depends on the limiting magnitudes of the
sample in apparent and absolute scales (11.6 and 2.3 mag in our case).
The distribution of probable members peaks at about 270 pc. After the
correction using Eq. (3), this corresponds to
a distance to the association centre of
 pc.
This is in a good agreement with previous results of de Zeeuw et al. (1999) who estimated the Per OB2 association distance to be
within 282-318 pc from the Sun.
pc.
This is in a good agreement with previous results of de Zeeuw et al. (1999) who estimated the Per OB2 association distance to be
within 282-318 pc from the Sun.
The distribution of probable members does also show a long tail at
larger distances. In contrast to the distribution of field MS500
stars, this bias is less caused by the limited magnitude of the
sample but results from errors in the data used (see
Sect. 2) and admixture of background stars. From the
comparison with the distribution of probable members selected from
their proper motions, we found that the bias to larger distances is
less pronounced for proper motion members. This additionally supports
the assumption on the
admixture of distant background stars. If compared to model
calculations described in Sect. 2, the observed
distribution implies a depth of the association of less than 100 pc.
This is in agreement with a size of about
for the highest
concentration (i.e., a core of the association) of probable members
within Per OB2ab (see Fig. 5) which corresponds to
about 40 pc at a distance of 320 pc.
![\begin{figure}
\par\includegraphics[width=8.8cm,clip]{MS1966f7.ps} \end{figure}](/articles/aa/full/2002/19/aa1966/Timg94.gif) |
Figure 7:
The surface density of probable association
members in the (X',Y')-plane (panel a)) and (X',Z')-plane (panel b)).
See text for explanation. The density levels are indicated with the
gray colour scale in the upper right corner of the figure. The solid
lines show the axis pointed to the center of Per OB2a, the dashed lines to
the center of Per OB2b. IC 348 is marked by a plus. |
| Open with DEXTER |
In order to study the spatial distribution of stars in the Per OB2
direction, we define a proper coordinate system of the association
(X',Y',Z') related to the geometry of the region. The system is
centred on the Sun and the X'-axis is directed to the centre of the
CC area at
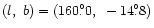 .
The Y'-axis
points towards
.
The Y'-axis
points towards
 ,
and the Z'-axis is directed
towards
,
and the Z'-axis is directed
towards
 .
In order to produce an unbiased
spatial picture, the coordinates of stars were calculated from
distances, re-scaled with Eq. (3). For
convenience, we call the (X',Y')-plane the "local equatorial
projection'' and the (X',Z')-plane the "local meridional
projection''. The distributions of the surface density of Per OB2
probable members in these two planes are shown in
Fig. 7. The position of IC 348 in the
(X',Y',Z')coordinates is based on the distance of 261 pc determined by
Scholz et al. (1999) from Hipparcos data.
.
In order to produce an unbiased
spatial picture, the coordinates of stars were calculated from
distances, re-scaled with Eq. (3). For
convenience, we call the (X',Y')-plane the "local equatorial
projection'' and the (X',Z')-plane the "local meridional
projection''. The distributions of the surface density of Per OB2
probable members in these two planes are shown in
Fig. 7. The position of IC 348 in the
(X',Y',Z')coordinates is based on the distance of 261 pc determined by
Scholz et al. (1999) from Hipparcos data.
In both planes, the regions of enhanced surface density occupy areas
of approximately the same size, i.e. demonstrate a
quasi-spherical shape. But their location within the CC field is non
symmetric. Areas of higher density are shifted to positive Y'and Z' i.e. to the "CO-cavity'' (cf. Fig. 5).
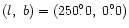
The solid and dashed lines in Fig. 7 indicate the
directions to Per OB2a and Per OB2b centered at
 and
and
 ,
respectively. As shown in Fig. 7 no separate centers
could be resolved from the "local equatorial projection''. An additional
concentration at Per OB2a axis at X'=330 pc is (according to
the "meridional projection'') a random superposition of regions of
smaller density distributed across the CC area. In
contrast, in the "meridional projection'' both regions could be
separated. We can identify Per OB2b in panel (b) as "northern''
concentration located at
,
respectively. As shown in Fig. 7 no separate centers
could be resolved from the "local equatorial projection''. An additional
concentration at Per OB2a axis at X'=330 pc is (according to
the "meridional projection'') a random superposition of regions of
smaller density distributed across the CC area. In
contrast, in the "meridional projection'' both regions could be
separated. We can identify Per OB2b in panel (b) as "northern''
concentration located at
 pc, and Per OB2a as a
region of enhanced stellar density at
pc, and Per OB2a as a
region of enhanced stellar density at
 pc. Then the
average distance to the association is 300 pc. This distance
estimation based on spatial distribution of probable association members
coincides well with results derived above from the one-dimensional distribution
of distances.
Figure 7 also shows that the core of the association is of the
order of 50 pc in a diameter (for surface densities
pc. Then the
average distance to the association is 300 pc. This distance
estimation based on spatial distribution of probable association members
coincides well with results derived above from the one-dimensional distribution
of distances.
Figure 7 also shows that the core of the association is of the
order of 50 pc in a diameter (for surface densities  greater than
0.1 stars/pc2), which is in agreement with data derived from
the density distribution in the face-on plane (Fig. 5).
greater than
0.1 stars/pc2), which is in agreement with data derived from
the density distribution in the face-on plane (Fig. 5).
Figures 5 and 7 show that the hypothetical
populations A and C introduced in Paper I on the basis of the
analysis of proper motions and parallaxes can be identified with the
Per OB2a and Per OB2b groups, respectively. From their spatial
kinematics, both groups belong to the same association.
Note that half a dozen de Zeeuw et al. (1999) B-type members of the association are located in the Per OB2b
area, also. To prove whether Per OB2a and Per OB2b consist of populations
with similar properties, we have considered the colour-magnitude
diagrams for both areas.
In order to avoid sampling-dependent biases, we used a sample based
primarily on spatial constraints for the construction of CMDs. We
selected stars located in a rectangular area limited by the
coordinates
 (see Fig. 5) considered to be the
association region. We assumed that stars with
(see Fig. 5) considered to be the
association region. We assumed that stars with
 |
(7) |
belong to the Per OB2a area, otherwise to Per OB2b. Further, we
restricted the sample to stars with
 ,
,
 mag,
mag,
 mas/yr, and d < 800 pc. For comparison,
we also constructed a CMD for probable field stars located outside
the association area and got membership probabilities
mas/yr, and d < 800 pc. For comparison,
we also constructed a CMD for probable field stars located outside
the association area and got membership probabilities
 .
The resulting diagrams are shown in Fig. 8.
.
The resulting diagrams are shown in Fig. 8.
![\begin{figure}
\par\includegraphics[angle=270,width=8.8cm,clip]{MS1966f8.ps}\end{figure}](/articles/aa/full/2002/19/aa1966/Timg109.gif) |
Figure 8:
Colour magnitude diagrams of Per OB2a (panel a), Per OB2b
(panel b) and outer (panel c) regions of the CC. Large filled
circles mark the probable members of the association (
),
small open circles - the possible members ( ), and dots -
the probable field stars ( ), and dots -
the probable field stars (
 ). Curves are ZAMS of
Schmidt-Kaler (1982) reddened by average extinction values
(AV=1 mag, and
E(B-V)=0.3 mag), for stars located at 200, 400,
and 600 pc (from right to left). ). Curves are ZAMS of
Schmidt-Kaler (1982) reddened by average extinction values
(AV=1 mag, and
E(B-V)=0.3 mag), for stars located at 200, 400,
and 600 pc (from right to left). |
| Open with DEXTER |
According to Fig. 8, both association regions show
a remarkable similarity in their CMD properties. Both Per OB2a and
Per OB2b samples demonstrate clear main sequences and the same
degree of contamination by field red giants (stars with (B-V) > 1mag). The only difference between both diagrams is the presence of
five very bright (V < 6 mag) stars in Per OB2a, the evident reason
why it was identified as an association in the first place. As the
positions of the empirical ZAMS show, both groups are located at a
distance between 200 and 400 pc which is in agreement with previous
findings. Both diagrams are in strong contrast (if one does not take
into account red giants) with the field star CMD which show a
vertical sequence at
 mag of main sequence stars at
different distances. Thus, we conclude that the Per OB2a and
Per OB2b regions represent the same population both from kinematic
and CMD points of view. Consequently, the Per OB2 association is a
spatially more extended group, in contrast to the classical results
considering the association to be mainly located in the Per OB2a area.
mag of main sequence stars at
different distances. Thus, we conclude that the Per OB2a and
Per OB2b regions represent the same population both from kinematic
and CMD points of view. Consequently, the Per OB2 association is a
spatially more extended group, in contrast to the classical results
considering the association to be mainly located in the Per OB2a area.
6 Kinematics of the region
Once the area occupied by the association is outlined and its members
are selected, the study of its spatial motions (both motion of the
association as a whole, and internal systematic motions like rotation
or expansion/contraction) becomes possible.
The hypothesis on expansive motions in OB-associations was introduced
in the early work of Ambarzumian (1949). Later this problem
was studied in detail by Blaauw. The expansion of Per OB2 was
examined by Blaauw (1952), Delhaye & Blaauw (1953),
and Lesch (1969) from proper motions and radial velocities of
the brightest members of the association and they found some evidence
of its expansion. According to their results, the kinematic age of
the association inferred from the measured expansion rate is about
1.3 Myr.
In order to get an unbiased picture of the complex internal motions,
the kinematic data were corrected for the Solar motion and
differential rotation of the Galactic disk as described in
Sect. 4. Only stars with accurate proper motions
(
 mas/yr) were used for the evaluation of
systematic motions. Among probable association members, we selected
main sequence stars brighter than V=11.6 mag and with distances
between 200 and 400 pc. Totally, 276 stars were found in the CC to
fit the criteria. These stars are shown by dots in
Fig. 9. A subsample of 57 stars located in the
Per OB2ab area and called hereafter the Kinematic Association Sample
(KAS) is marked by open circles in Fig. 9.
mas/yr) were used for the evaluation of
systematic motions. Among probable association members, we selected
main sequence stars brighter than V=11.6 mag and with distances
between 200 and 400 pc. Totally, 276 stars were found in the CC to
fit the criteria. These stars are shown by dots in
Fig. 9. A subsample of 57 stars located in the
Per OB2ab area and called hereafter the Kinematic Association Sample
(KAS) is marked by open circles in Fig. 9.
In the case of a significant internal radial motion, it
should be revealed from
 - and
- and
 -diagrams
(panels (a) and (d) in Fig. 9), whereas the rotation of
the association around the line of sight would be indicated in
-diagrams
(panels (a) and (d) in Fig. 9), whereas the rotation of
the association around the line of sight would be indicated in
 - and
- and
 -planes (panels (b) and (c)). No
significant evidence of systematic internal motions in the
association can be inferred from Fig. 9.
-planes (panels (b) and (c)). No
significant evidence of systematic internal motions in the
association can be inferred from Fig. 9.
This conclusion is supported by a linear least square solution
of individual motions of KAS stars yielding:
Here
 and
and
 are proper motions corrected for the
Solar motion and differential rotation of the Galactic disk. The
angular coefficients in the equations are not significant. We
conclude that within the accuracy of the present data, no systematic
internal motions are detectable in the Per OB2 association.
are proper motions corrected for the
Solar motion and differential rotation of the Galactic disk. The
angular coefficients in the equations are not significant. We
conclude that within the accuracy of the present data, no systematic
internal motions are detectable in the Per OB2 association.
![\begin{figure}
\par\includegraphics[angle=270,width=8.8cm,clip]{MS1966f9.ps}\end{figure}](/articles/aa/full/2002/19/aa1966/Timg122.gif) |
Figure 9:
Corrected proper motions of probable members of Per OB2
versus Galactic coordinates. Dots - stars from the complete field
of the CC, circles - stars from the central (association) area (= KAS). |
| Open with DEXTER |
Probably, the previous results indicating an expansion of the Per OB2
are biased due to insufficiently accurate proper motions and
membership selection and/or correction of velocities for the
differential rotation of the Galactic disk and Solar motion.
This assumption is supported by extensive simulations by
Brown et al. (1997) who pointed at the importance of all these factors
in the determination of internal motions and kinematic ages of
associations. These authors also concluded that even for nearby associations,
the Hipparcos accuracy is not sufficient to derive these parameters properly.
Using the KAS stars, we derived various estimators of the motion of
the association. The averaged proper motion, not corrected for the
systematic effects, was obtained as
 mas/yr. This
agrees well with the results derived by de Zeeuw et al. (1999)
for Per OB2:
mas/yr. This
agrees well with the results derived by de Zeeuw et al. (1999)
for Per OB2:
 mas/yr. The averaged
tangential velocity of the association with respect to the LSR
computed from proper motions corrected for the parallactic motion of
the Sun is
mas/yr. The averaged
tangential velocity of the association with respect to the LSR
computed from proper motions corrected for the parallactic motion of
the Sun is
 km s-1. For nine KAS stars, radial
velocities are available in the CC. The averaged radial motion of
these stars is
km s-1. For nine KAS stars, radial
velocities are available in the CC. The averaged radial motion of
these stars is
 km s-1. The spatial
velocity components (U,V,W) of the Per OB2 association with respect
to the LSR were computed from the averaged tangential and radial
velocities as
km s-1. The spatial
velocity components (U,V,W) of the Per OB2 association with respect
to the LSR were computed from the averaged tangential and radial
velocities as
 km s-1.
7 Discussion and conclusions
In this paper we deal with one of the nearest associations with a long
history of scientific investigations, the Per OB2 association. On
one hand, this association is predestined for membership studies:
due to a rather high Galactic latitude (
)
it is
projected onto a relatively poor background of the thick disk. On the
other hand, its average velocity does not differ strongly from that
of the field stars. Therefore, the full potential of the usage of the
proper motion method for membership determination cannot be exploited.
For our study we applied a deeper and more complete data set of
present-day quality in the region of Per OB2 than was used before.
We implemented the reduced proper motion method, which together with
the high accuracy of the kinematic data, proved to be a very
effective tool for the study of the association. Compared to
previous investigations, we probed a much larger sample of
30 000 stars with accurate proper motions in the Hipparcos system
and magnitudes being updated with other relevant data.
Since proper motions are the most common type of data within our sample,
we combined these data with available spectral classification and used
them for distance calibration. In spite of the unfavourable conditions
for membership determination, this enabled us to select the
association members with higher reliability. Monte Carlo simulations
show that due to the still insufficiently accurate proper motions
and due to the non-zero internal random motions of the association
stars, we can hardly study the association structure in detail from
individual HV-calibrated distances. However, we can apply the
method for an independent and robust determination of the distance
to the association and for the separation of main sequence stars
from red giants.
The extensive sample of spectral classification data included in the
CC allowed to study the distribution of interstellar extinction in
the wider neighbourhood of the association. We found a remarkable
correlation of the reddening pattern with the structure of
CO-emitting clouds derived from large scale radio-surveys. In the
studied region, the average reddening was determined to be
mag, and
mag.
With distances estimated practically for every star in the CC, we
had some freedom to decide which approach to use for the member
selection (proper motions or tangential velocities). In the case of
extended structures like associations, a membership criterion based
on tangential velocities is more justified. However, we found that,
at the present accuracy level of the data, both approaches give, in
general, the same association structure, being somewhat different
only for distance-dependent features. The implementation of a
membership criterion based on tangential velocities to all CC stars
brighter than V=13 mag yielded about 6200 probable members (i.e.,
membership probability
). However, the analysis of their
distribution over the sky and their CMDs have shown that this sample
is strongly contaminated by co-moving field stars. When applied to
a uniform sample of main sequence stars located within 500 pc from
the Sun, the kinematic criterion has revealed a clear concentration
(i.e. the association core) in the central part of the CC field with
a size of about 7 .
.
In this region, we found 1025 probable main sequence members with
V between 3 and 13. Assuming a 20%-contamination by field stars
(see Sect. 4), this amounts to about 800 association members
within a mass range of
 .
Under the assumption that the Per OB2
population goes down to masses of
.
Under the assumption that the Per OB2
population goes down to masses of
 ,
we estimate - adopting the
Salpeter IMF - that these stars would make up about 4% of the total number of
association members (i.e., 20 000 members with an average mass of
0.32
,
we estimate - adopting the
Salpeter IMF - that these stars would make up about 4% of the total number of
association members (i.e., 20 000 members with an average mass of
0.32  ). With a core radius of 25-20 pc, this yields an average
density of about 0.1-0.2
). With a core radius of 25-20 pc, this yields an average
density of about 0.1-0.2
 .
This estimation is
in agreement both with mass densities expected for associations
(0.001-0.1
,
see Lang 1992) and with the
average densities of open clusters like the Pleiades (0.18
)
or Praesepe (0.25
)
obtained by Kholopov (1981).
.
This estimation is
in agreement both with mass densities expected for associations
(0.001-0.1
,
see Lang 1992) and with the
average densities of open clusters like the Pleiades (0.18
)
or Praesepe (0.25
)
obtained by Kholopov (1981).
The analysis based on these stars also shows that the previous view
of Per OB2 should be modified by extending the association in the
direction of the Galactic equator, towards the California nebula and
the Auriga dark cloud. This brings the association in full coherence
with the environment, dominated by the cloud pattern. We conclude
that the Per OB2 association is not only in relation with the Perseus
cloud in the South, but also interacts with the Auriga cloud in the
North. It cannot be excluded that association stars are responsible
for the "cavity'' separating the Auriga and Taurus/Perseus cloud
systems.
The distance to the association center derived from kinematic
calibration is found to be about 300 pc. This is in agreement with
Hipparcos-based data of de Zeeuw et al. (1999) found for about
40 members. Taking also into account the estimated diameter of the
association core of about 40 pc, we conclude that the IC 348 cluster
which is semi-embedded into the Perseus dark cloud is located
immediately at the front edge of the association. The derived results
support our findings from Paper I that the stellar population of
Per OB2 consists of two groups located at different distances.
According to our new results, these groups called Per OB2a and
Per OB2b which represent the same kinematic sample and show
similar CMDs but are separated in the face-on plane and along the
line of sight by a few tens of parsecs, can be identified with these
two populations found previously.
This configuration may lead to an interesting consequence. Indeed, as
we note in Sect. 5, the only difference between the CMDs
of the Per OB2a and Per OB2b regions is the lack of the luminous
stars in the latter. If one interprets this as an age difference,
then it can not be ruled out, that the Per OB2 association represents
an example of propagated star formation, which started in Per OB2b at
the edge of the Auriga clouds more than 30 Myr ago, resumed in
Per OB2a after about 10 Myr, and is now in progress at the Per OB2
southern border within the Perseus cloud (IC 348). We plan to
consider this issue in a following paper.
The examination of internal systematic motions has shown that no
evidence of an expansion of the association nor a rotation around the
line of sight is found from the proper motion data. Radial velocities
are too scarce and inaccurate to produce a coherent picture of
internal motions. However they are sufficient to be involved in the
calculation of the mean spatial motion of the association.
Acknowledgements
This work is supported in part by the German
Deutsche Forschungsgemeinschaft, DFG project
number 113/380/O(R) and by the Russian Foundation of Basic Research
(grant No. 01-02-16306). RDS gratefully acknowledges financial
support from the Deutsches Zentrum für Luft- und Raumfahrt (DLR)
(Förderkennzeichen 50 OI 0001). We acknowledge the use of
the SIMBAD database operated at the CDS. The authors also thank the
anonymous referee for his/her very useful comments and suggestions.
- Ambarzumian, V. A. 1949, Astron. Zhurn., 26, 3
In the text
- Belikov, A. N., Kharchenko, N. V., Piskunov, A. E., et al. 2002,
A&A, 384, 145 (Paper I)
In the text
NASA ADS
- Blaauw, A. 1952, BAN, 11, 405
In the text
NASA ADS
- Blaauw, A. 1964, ARA&A, 2, 213
In the text
NASA ADS
- Brown, A. G. A., Dekker G., & de Zeeuw, P. T. 1997, MNRAS, 285, 479
In the text
NASA ADS
- Cernis, K. 1990, Ap&SS, 166, 315
In the text
NASA ADS
- Cernis, K. 1993, Baltic Astr., 2, 214
In the text
NASA ADS
- Chiu, L.-T.G. 1980, ApJS, 44, 31
In the text
NASA ADS
- Dehnen, W., & Binney, J. J. 1998, MNRAS, 298, 387
In the text
NASA ADS
- Delhaye, J., & Blaauw, A. 1953, BAN, 12, 72
In the text
NASA ADS
- Efremov, Yu. N. 1981, Star formation sites in galaxies. Star complexes and spiral arms (Nauka Publ., Moscow)
In the text
- Feast, M. W., & Whitelock, P. 1997, MNRAS, 291, 683
In the text
NASA ADS
- Houk, N., Swift, C. M., Murray, C. A., Penston, M. J., & Binney, J. J. 1997, ESA SP-402, 279
In the text
- Jones 1972, ApJ, 173, 671
In the text
NASA ADS
- Kharchenko, N., & Schilbach, E. 1995, Astron. Nachr., 1995, 316, 91
In the text
NASA ADS
- Kharchenko, N., & Schilbach, E. 1996, Baltic Astr., 5, 337
In the text
NASA ADS
- Kislyuk, V., Yatsenko, A., Ivanov, G., Pakulyak, L., & Sergeeva, T. 1999, in Motion of Celestial Bodies, Astrometry and Astronomical Reference Frames, JOURNEES 1999 & IX Lohrman Kolloquium (Dresden, Germany), 13-15 September 1999
In the text
- Kholopov, P. N. 1981, Star Clusters (Nauka Publ., Moscow.)
In the text
- Lang, K. R. 1992, Astrophysical Data: Planets and Stars (Springer-Verlag, New York, Berlin, Heidelberg, London, Paris, Tokyo, Honk Kong, Barcelona, Budapest)
In the text
- Lesh, J. R. 1969, AJ, 74, 891
In the text
NASA ADS
- Sakhibov, F., & Smirnov, M. A. 2000, A&A, 354, 802
In the text
NASA ADS
- Schmidt-Kaler, Th. 1982, Landolt-Börnstein Numerical Data and Functional Relationships in Science and Technology, New Series, Group IV (Springer-Verlag Press, Berlin-Heidelberg, New York), 2, 15
In the text
- Scholz, R.-D., Brunzendorf, J., Ivanov, G., et al. 1999, A&AS, 137, 305
In the text
NASA ADS
- Seyfert, C. K., Hardie, R. H., & Grenchik, R. T. 1960, ApJ, 132, 58
In the text
NASA ADS
- Straizys, V. 1977, Multicolour stellar photometry (Mokslas Publ., Vilnius)
In the text
- Ungerechts, H., & Thaddeus, P. 1987, ApJS, 63, 645
In the text
NASA ADS
- de Zeeuw, P. T., Hoogerwerf, R., de Bruijne, J. H. J., Brown, A. G. A., & Blaauw, A. 1999, AJ, 117, 354
In the text
NASA ADS
Copyright ESO 2002
![\begin{figure}
\par\includegraphics[angle=-90,width=11.6cm,clip]{MS1966f1.ps} \end{figure}](/articles/aa/full/2002/19/aa1966/img15.gif)
![\begin{figure}
\par\includegraphics[width=8.8cm,clip]{MS1966f2.ps} \end{figure}](/articles/aa/full/2002/19/aa1966/img34.gif)
![\begin{figure}
\par\includegraphics[width=8.8cm,clip]{MS1966f3.ps} \end{figure}](/articles/aa/full/2002/19/aa1966/img46.gif)
![\begin{figure}
\par\includegraphics[width=8.8cm,clip]{MS1966f4.eps}\end{figure}](/articles/aa/full/2002/19/aa1966/img49.gif)
![\begin{figure}
\includegraphics[width=8.8cm,clip]{MS1966f5.ps}\end{figure}](/articles/aa/full/2002/19/aa1966/img87.gif)
![\begin{figure}
\par\includegraphics[width=8.8cm,clip]{MS1966f6.eps} \end{figure}](/articles/aa/full/2002/19/aa1966/img91.gif)
![\begin{figure}
\par\includegraphics[width=8.8cm,clip]{MS1966f7.ps} \end{figure}](/articles/aa/full/2002/19/aa1966/img94.gif)
![\begin{figure}
\par\includegraphics[angle=270,width=8.8cm,clip]{MS1966f8.ps}\end{figure}](/articles/aa/full/2002/19/aa1966/img109.gif)
![\begin{figure}
\par\includegraphics[angle=270,width=8.8cm,clip]{MS1966f9.ps}\end{figure}](/articles/aa/full/2002/19/aa1966/img122.gif)