next previous
Up: Transmission curves and effective


3 Results


  \begin{figure}\resizebox{\hsize}{!}
{\rotatebox{-90}{\includegraphics{h3451f2.ps}}}\end{figure} Figure 2: Detailed view of the narrow band filter curves. The solid line is for an incidence angle of $3^\circ $ while the dashed curve refer to measurements at $6.5^\circ $. The shift in wavelength is compatible with an effective refractive index of 2 for all filters.

The measured transmissions of the MKO near-infrared consortium filters mounted in NICS are displayed in Fig. 1 which also includes, for comparison, the curves relative to the standard J filter (see the caption for details). The corresponding half-power points and average transmissions are summarized in Table 1.

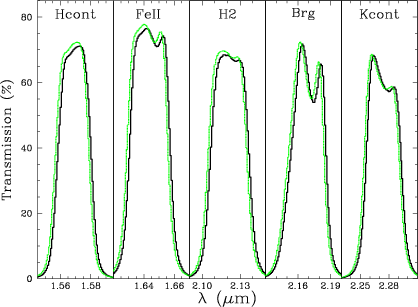
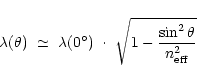
Figure 2 is a zoom on the transmission curves of the narrow band filters and includes measurements taken at different incidence angles. The shift of the central wavelength and half power points can be well represented by the relationship


 \begin{displaymath}
\lambda(\theta)\ \simeq \ \lambda(0^{\circ})\ \cdot \
\sqrt{1-{\sin^2\theta\over n_{\rm {eff}}^2}}
\end{displaymath} (1)

where $n_{\rm {eff}}$ is the effective refraction index. Within the range of angle spanned by our measurements, all the data are compatible with $n_{\rm {eff}}\simeq 2$, a quite typical value for IR interference filters (see e.g. Vanzi et al. 1998).


next previous
Up: Transmission curves and effective

Copyright ESO 2002