III. Observations with INT and NOT 2.5 m telescopes
A&A 386, 134-139 (2002)
DOI: 10.1051/0004-6361:20020216
A. Boselli1 - J. Iglesias-Páramo 1 - J. M. Vílchez 2 - G. Gavazzi 3
1 - Laboratoire d'Astronomie Spatiale, Traverse du Siphon, 13376 Marseille
Cedex 12, France
2 -
Instituto de Astrofísica de Andalucía (CSIC), Apdo. 3004, 18080, Granada, Spain
3 -
Università degli Studi di Milano-Bicocca, Piazza delle scienze 3,
20126 Milano, Italy
Received 3 December 2001 / Accepted 5 February 2002
Abstract
We present H![]() line imaging observations of
30 galaxies obtained at the 2.5 m INT and NOT telescopes.
The observed galaxies are mostly BCD Virgo cluster galaxies.
H
line imaging observations of
30 galaxies obtained at the 2.5 m INT and NOT telescopes.
The observed galaxies are mostly BCD Virgo cluster galaxies.
H![]() +[NII] fluxes and equivalent widths, as well as images of
all the detected targets are presented. With these observations, H
+[NII] fluxes and equivalent widths, as well as images of
all the detected targets are presented. With these observations, H![]() data are available for
data are available for ![]() 50% of the BCD galaxies listed in the VCC.
50% of the BCD galaxies listed in the VCC.
Key words: galaxies: photometry - galaxies: fundamental parameters
This paper is the third of a series devoted to H![]() +[NII]
imaging observations of Virgo cluster galaxies: in Gavazzi et al. (2002;
Paper I), we present H
+[NII]
imaging observations of Virgo cluster galaxies: in Gavazzi et al. (2002;
Paper I), we present H![]() imaging data obtained with the 2.1 m
of San Pedro Martir, mostly of low luminosity spirals and irregulars.
In Boselli & Gavazzi (2002;
Paper II) we present data obtained with the 1.2 m telescopes at
the Observatoire de Haute Provence and at Calar Alto for the
brightest galaxies in the cluster.
This paper presents H
imaging data obtained with the 2.1 m
of San Pedro Martir, mostly of low luminosity spirals and irregulars.
In Boselli & Gavazzi (2002;
Paper II) we present data obtained with the 1.2 m telescopes at
the Observatoire de Haute Provence and at Calar Alto for the
brightest galaxies in the cluster.
This paper presents H![]() imaging data obtained at the 2.5 m INT and NOT
telescopes for blue compact dwarfs (BCDs) galaxies
in Virgo. These data are aimed at completing the H
imaging data obtained at the 2.5 m INT and NOT
telescopes for blue compact dwarfs (BCDs) galaxies
in Virgo. These data are aimed at completing the H![]() survey of
BCD galaxies of Almoznino et al. (1998) and Heller et al. (1999) aimed at studying the star formation activity in low-mass, dwarf galaxies. These objects
are particulary useful to test whether the scaling relations of
giant spirals, as derived by Boselli et al. (2001), hold true at the low
end of the luminosity function.
Given the lack of spiral patterns in BCDs, star formation cannot be triggered
by compression from gravitational density waves and rotational shear, as in giant spirals,
but is probably governed by random collision of interstellar clouds (Hunter et al. 1998).
These characteristics make BCDs and dwarf irregulars a unique class of objects for
studying the physical conditions behind the star formation.
survey of
BCD galaxies of Almoznino et al. (1998) and Heller et al. (1999) aimed at studying the star formation activity in low-mass, dwarf galaxies. These objects
are particulary useful to test whether the scaling relations of
giant spirals, as derived by Boselli et al. (2001), hold true at the low
end of the luminosity function.
Given the lack of spiral patterns in BCDs, star formation cannot be triggered
by compression from gravitational density waves and rotational shear, as in giant spirals,
but is probably governed by random collision of interstellar clouds (Hunter et al. 1998).
These characteristics make BCDs and dwarf irregulars a unique class of objects for
studying the physical conditions behind the star formation.
Data for other bright galaxies, serendipitously observed in the Wide Field Camera (WFC) at the INT are also presented.
The analysis based on these data will be discussed in future communications.
| VCC | NGC/IC | UGC | RA(1950) | Dec | a | b | Vel | Clust | Dist | Type |
|
|
||
| (1) | (2) | (3) | (4) | (5) | (6) | (7) | (8) | (9) | (10) | (11) | (12) | (13) | (14) | (15) |
| 24 | - | - | 120802.5 | 120220.0 | 1.00 | 0.37 | 1289 | M | 32 | 4.99 | BCD | 14.95 | 15.79 | 12.68 |
| 144 | - | - | 121245.0 | 60220.0 | 0.63 | 0.32 | 2014 | W | 32 | 7.66 | BCD | 15.31 | 15.18 | 12.95 |
| 213 | 3094 | 7305 | 121423.4 | 135413.0 | 0.93 | 0.71 | -162 | N | 17 | 3.60 | dS/BCD | 14.26 | 14.74 | 11.52 |
| 324 | - | 7354 | 121636.5 | 40758.0 | 1.35 | 1.15 | 1524 | S | 17 | 9.01 | BCD | 14.78 | 14.30 | 11.83 |
| 404 | - | 7387 | 121743.8 | 42844.0 | 1.71 | 0.21 | 1733 | S | 17 | 8.60 | Scd | 15.00 | 13.90 | - |
| 428 | - | - | 121807.9 | 140959.0 | 0.39 | 0.11 | 794 | A | 17 | 2.89 | BCD | 17.50 | - | - |
| 459 | - | - | 121839.6 | 175457.0 | 0.84 | 0.36 | 2108 | A | 17 | 5.74 | BCD | 14.95 | - | 12.72 |
| 513 | - | - | 121924.0 | 23718.0 | 0.73 | 0.61 | 1832 | S | 17 | 10.28 | BCD | 15.10 | - | 12.33 |
| 655 | 4344 | 7468 | 122105.8 | 174906.0 | 1.55 | 1.55 | 1147 | A | 17 | 5.44 | Spec/BCD | 13.21 | 13.58 | 10.66 |
| 787 | 4376 | 7498 | 122245.1 | 60104.0 | 1.84 | 1.07 | 1136 | B | 23 | 6.79 | Scd | 13.69 | 13.38 | 11.08 |
| 793 | - | - | 122249.8 | 132060.0 | 0.47 | 0.34 | 1906 | A | 17 | 1.50 | Im | 16.74 | 17.26 | 14.85 |
| 802 | - | - | 122257.0 | 134624.0 | 0.64 | 0.21 | -215 | A | 17 | 1.71 | BCD | 17.40 | 17.61 | 14.64 |
| 810 | - | - | 122301.8 | 133006.0 | 0.77 | 0.77 | -340 | A | 17 | 1.53 | dE | 16.95 | 17.06 | 14.04 |
| 815 | - | - | 122305.4 | 132512.0 | 0.66 | 0.53 | -700 | A | 17 | 1.47 | dE | 16.10 | 16.59 | - |
| 846 | - | - | 122318.0 | 132818.0 | 0.89 | 0.80 | -730 | A | 17 | 1.46 | dE | 16.20 | 16.58 | - |
| 848 | - | - | 122319.8 | 60506.0 | 1.16 | 0.98 | 1537 | B | 23 | 6.70 | Im/BCD | 14.72 | 15.18 | 13.35 |
| 873 | 4402 | 7528 | 122335.3 | 132320.0 | 3.95 | 1.16 | 234 | A | 17 | 1.36 | Sc | 12.56 | 11.74 | 8.58 |
| 1297 | - | - | 122800.0 | 124600.0 | 0.51 | 0.45 | 1486 | A | 17 | 0.12 | E | 14.33 | 14.42 | 10.25 |
| 1313 | - | - | 122816.6 | 121916.0 | 0.45 | 0.20 | 1254 | A | 17 | 0.35 | BCD | 17.15 | 17.30 | 15.60 |
| 1316 | 4486 | 7654 | 122817.6 | 124002.0 | 11.00 | 11.00 | 1292 | A | 17 | 0.00 | E | 9.58 | 9.82 | 6.21 |
| 1369 | - | - | 122901.2 | 122024.0 | 0.50 | 0.20 | 1022 | A | 17 | 0.37 | dE | 17.30 | - | - |
| 1437 | - | - | 123001.2 | 92658.0 | 0.59 | 0.45 | 1160 | S | 17 | 3.25 | BCD | 15.12 | - | 12.21 |
| 1488 | 3487 | - | 123041.4 | 94030.0 | 1.26 | 0.53 | 1157 | S | 17 | 3.05 | E | 14.76 | - | - |
| 1725 | - | - | 123509.4 | 85001.0 | 1.55 | 0.97 | 1068 | S | 17 | 4.19 | Sm/BCD | 14.51 | 14.61 | 12.13 |
| 1804 | - | - | 123708.4 | 94024.0 | 0.75 | 0.20 | 1898 | E | 17 | 3.70 | Im/BCD | 15.63 | 16.30 | 13.31 |
| 1955 | 4641 | 7889 | 124036.5 | 121928.0 | 1.36 | 1.07 | 2012 | E | 17 | 3.02 | Spec/BCD | 14.32 | - | 11.16 |
| 2007 | 3716 | - | 124215.6 | 82254.0 | 0.78 | 0.41 | 1857 | E | 17 | 5.49 | Im/BCD | 15.20 | - | 13.33 |
| 2033 | - | - | 124333.0 | 84454.0 | 0.73 | 0.73 | 1486 | E | 17 | 5.42 | BCD | 14.65 | 15.60 | 13.06 |
| 2034 | - | - | 124336.6 | 102612.0 | 0.78 | 0.52 | 1500 | E | 17 | 4.36 | Im | 15.82 | 16.24 | 13.23 |
| 2037 | - | - | 124343.8 | 102848.0 | 0.88 | 0.38 | 1142 | E | 17 | 4.37 | Im/BCD | 15.92 | 16.20 | 12.55 |
| 2045 | - | - | 124424.0 | 102724.0 | 1.29 | 0.43 | - | E | 17 | 4.52 | dE | 16.33 | - | - |
Galaxies observed in this work have been selected from the Virgo Cluster
Catalogue (VCC) of Binggeli et al. (1985), which is complete to the optical B magnitude
![]() .
We selected all BCD galaxies (BCD, Im/BCD, Sm/BCD)
classified as cluster members, possible members or belonging to the
W, W', M clouds or to the southern extension (Binggeli et al. 1985, 1993).
.
We selected all BCD galaxies (BCD, Im/BCD, Sm/BCD)
classified as cluster members, possible members or belonging to the
W, W', M clouds or to the southern extension (Binggeli et al. 1985, 1993).
Among the 67 BCD Virgo cluster members matching these criteria, 34 objects (51%) either included in the present work or in Paper I have an
H![]() measurement.
If limited to the
ISO sample described in Boselli et al. (1997), 16 out 18 BCD galaxies (89%)
have H
measurement.
If limited to the
ISO sample described in Boselli et al. (1997), 16 out 18 BCD galaxies (89%)
have H![]() data.
data.
Given the large field of view of the WFC at the INT, some galaxies not matching the selection criteria were serendipitously observed in the fields of other targets.
The target galaxies, as well as the serendipitously observed objects, are listed in Table 1, arranged as follow:
| Telescope | Date | Nights (ass./used) | CCD | Pixel size |
| 2.5 m INT | 17-20/2/1999 | 4/3.5 | WFC | 0.333 |
| 2.56 m NOT | 29/4-1/5/2000 | 3/0.5 | Loral/Lesser
|
0.188 |
| 2.56 m NOT | 27-29/4/2001 | 3/1.5 | Loral/Lesser
|
0.188 |
Narrow band imaging in the H![]() emission line (
emission line (![]() = 6562.8 Å) of galaxies was
obtained in 1999 at the 2.5 m INT and in 2000 and 2001
at the 2.56 m NOT telescope at El Roque de los Muchachos, La Palma, Canary Islands.
The INT observations were carried out with the Wide Field Camera (WFC) attached at
the prime focus of the telescope. The WFC is composed by a science array of four thinned AR
coated EEV 4 K
= 6562.8 Å) of galaxies was
obtained in 1999 at the 2.5 m INT and in 2000 and 2001
at the 2.56 m NOT telescope at El Roque de los Muchachos, La Palma, Canary Islands.
The INT observations were carried out with the Wide Field Camera (WFC) attached at
the prime focus of the telescope. The WFC is composed by a science array of four thinned AR
coated EEV 4 K![]() 2 K CCDs, plus a fifth acting as
autoguider. The pixel scale at the detectors is 0.33 arcsecpixel-1, which gives a total field of view of about
2 K CCDs, plus a fifth acting as
autoguider. The pixel scale at the detectors is 0.33 arcsecpixel-1, which gives a total field of view of about
![]() arcmin2. Given the particular arrangement of the detectors, a squared area
of about
arcmin2. Given the particular arrangement of the detectors, a squared area
of about
![]() arcmin2 is lost at the top right corner of the
field. The top left corner of detector #3 is also lost because of vignetting of
the filters.
arcmin2 is lost at the top right corner of the
field. The top left corner of detector #3 is also lost because of vignetting of
the filters.
The f/11 2.56 m NOT telescope is equipped with a Loral/Lesser 2048![]() 2048 pixelCCD
detector. The pixel size is 0.19 arcsec. At the adopted gain, the electron/adu conversion is
1 e-/adu, with a readout noise of 6 e-.
A total of 4 nights at the INT and 6 at NOT were allocated to this project.
Of these, 5.5 were totally or partly useful due to technical problems or weather limitations,
as reported in Table 2 (logbook of the observations and CCD technical data). One galaxy
(VCC 24) was observed at the INT in service mode.
2048 pixelCCD
detector. The pixel size is 0.19 arcsec. At the adopted gain, the electron/adu conversion is
1 e-/adu, with a readout noise of 6 e-.
A total of 4 nights at the INT and 6 at NOT were allocated to this project.
Of these, 5.5 were totally or partly useful due to technical problems or weather limitations,
as reported in Table 2 (logbook of the observations and CCD technical data). One galaxy
(VCC 24) was observed at the INT in service mode.
Each galaxy was observed through one narrow band interferometric filter
(see Table 3) centered at the redshifted H![]() line (ON), while the
red continuum near H
line (ON), while the
red continuum near H![]() (OFF)
was generally taken in a broad band filter.
The filters given in Table 3 are used as ON or OFF band
for each target as specified in Cols. 2 and 3 of Table 4.
The flux from the [NII] emission lines at
(OFF)
was generally taken in a broad band filter.
The filters given in Table 3 are used as ON or OFF band
for each target as specified in Cols. 2 and 3 of Table 4.
The flux from the [NII] emission lines at
![]() 6548 Å and
6548 Å and ![]() 6584 Å is included in the ON band observations.
The typical integration time was of
6584 Å is included in the ON band observations.
The typical integration time was of
![]() -1500 min ON- and
-1500 min ON- and
![]() -200 min
OFF-band for the INT observations, and
-200 min
OFF-band for the INT observations, and
![]() -900 min ON- and
-900 min ON- and
![]() -900 min
for the broad and narrow OFF-band observations at the NOT.
NOT observations were obtained during good seeing conditions (
-900 min
for the broad and narrow OFF-band observations at the NOT.
NOT observations were obtained during good seeing conditions (![]() 1 arcsec), fairly good
at the INT (1.5-2 arcsec).
1 arcsec), fairly good
at the INT (1.5-2 arcsec).
The observations were calibrated
using the standard stars Feige 56, 66, 67 and BD 33+2642 from the catalogue of Massey et al. (1988)
or from the IRAF compilation.
Observations of the standard stars were repeated every 2 hours,
with an integration time of 3-30 s.
At least once per night a calibration star was observed on each CCD of the
WFC to allow cross calibration of the different chips.
The zero point of each galaxy is determined assuming an extinction law of slope 0.06 for the
1999 run, 0.1 for the other runs. Repeated measurements
gave <10% differences, which we assume as the typical uncertainty of the
photometry given in this work. All frames except one were obtained in photometric
conditions.
The determination of the H![]() equivalent width
can however be achieved also in non photometric conditions using field stars to normalize
the ON and OFF band images, as described in Paper I.
equivalent width
can however be achieved also in non photometric conditions using field stars to normalize
the ON and OFF band images, as described in Paper I.
The data reduction of the CCD images follows a procedure identical to the one
described in previous papers of this series (Gavazzi et al. 1998; Papers I and II), based on IRAF/
STSDAS![]() data reduction packages. To remove the detector response each image is
bias subtracted and divided by the mean of several flat field exposures obtained on
the twilight sky. In some cases images were fitted with a 2-D
polynomial function to remove second order structures in the image.
A median combination of the realigned images
allows removal of cosmic rays.
Subtraction of contaminating objects, such as nearby stars and galaxies, is done by
direct editing of the frames.
The sky background is determined in each frame in concentric object-free annuli
around the object. The typical uncertainty on the mean background is estimated
10% of the rms in the individual pixels. This represents the dominant source of
error in low S/N regions.
data reduction packages. To remove the detector response each image is
bias subtracted and divided by the mean of several flat field exposures obtained on
the twilight sky. In some cases images were fitted with a 2-D
polynomial function to remove second order structures in the image.
A median combination of the realigned images
allows removal of cosmic rays.
Subtraction of contaminating objects, such as nearby stars and galaxies, is done by
direct editing of the frames.
The sky background is determined in each frame in concentric object-free annuli
around the object. The typical uncertainty on the mean background is estimated
10% of the rms in the individual pixels. This represents the dominant source of
error in low S/N regions.
Total counts in the two frames have been obtained by integrating the pixel counts over the area covered by each galaxy, as derived by the optical major and minor diameters. Fluxes and equivalent widths and errors are computed using Eqs. (1) and (2) and (6) and (7) of Paper I, assuming K=1.
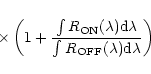
We corrected for the contamination of the H![]() +[NII] line emission in the
broad band filter (OFF-band) using the following relations:
+[NII] line emission in the
broad band filter (OFF-band) using the following relations:
![\begin{displaymath}{F({\rm H}\alpha+[{\rm NII}])_{\rm c}}
{=F({\rm H}\alpha+[{\r...
...m d}\lambda}{\int R_{\rm OFF}(\lambda){\rm d}\lambda}}\right)}
\end{displaymath}](/articles/aa/full/2002/16/aa2163/img19.gif) |
(1) |
![\begin{displaymath}{{\rm H}\alpha+[{\rm NII}]EW_{\rm c}}
\end{displaymath}](/articles/aa/full/2002/16/aa2163/img20.gif)
![\begin{displaymath}{={\rm H}\alpha+[{\rm NII}]EW_{\rm o} \left(1+{\frac{{\rm H}\alpha+[{\rm NII}]{EW}_{\rm o}}{\int R_{\rm OFF}}}\right)}
\end{displaymath}](/articles/aa/full/2002/16/aa2163/img21.gif)
 |
(2) |
| Filter |
|
|
|
Telescope | |
| 6568 | 6574 | 95 | 89 | 83.95 | INT |
| R | 6380 | 1520 | 83 | 1307.73 | INT |
| 6562 | 6562 | 33 | 66 | 24.68 | NOT |
| 6564 | 6564 | 46 | 74 | 39.18 | NOT |
| 6610 | 6610 | 50 | 76 | 43.74 | NOT |
| 6883 | 6883 | 65 | 77 | 50.50 | NOT |
| r | 6800 | 1020 | 86 | 1249.41 | NOT |
| This work | Literature | ||||||||||||||||
| VCC | ON | OFF | Tel | Year |
|
|
R(Ha) |
|
H
|
|
Phot | Morph | Notes |
|
|
Ref. | Notes |
| (1) | (2) | (3) | (4) | (5) | (6) | (7) | (8) | (9) | (10) | (11) | (12) | (13) | (14) | (15) | (16) | (17) | |
| 24 | 6568 | r | INT | 2001 | 33 | 10 | 0.86 | 0.30 |
|
C | C | -1 | - | A | * | ||
| 144 | 6610 | r | NOT | 2001 | 45 | 15 | 0.75 | 0.18 |
|
|
P | C | -12.72 | A | |||
| 213 | 6564 | r | NOT | 2000 | 40 | 10 | 0.61 | 0.13 |
|
P | El | ||||||
| 324 | 6568 | R | INT | 1999 | 75 | 25 | 0.85 | 0.20 |
|
P | C | -12.20 | A | * | |||
| 404 | 6568 | R | INT | 1999 | 75 | 25 | 0.83 | 0.21 |
|
P | D | ||||||
| 428 | 6562 | r | NOT | 2000 | 60 | 30 | 0.53 | 0.09 |
|
|
P | C | |||||
| 459 | 6610 | r | NOT | 2001 | 45 | 15 | 0.75 | 0.19 |
|
P | E | -12.53 | A | * | |||
| 513 | 6610 | r | NOT | 2001 | 45 | 15 | 0.73 | 0.19 |
|
P | C | -12.66 | A | ||||
| 655 | 6568 | R | INT | 1999 | 77 | 18 | 0.87 | 0.23 |
|
P | El | Hi | * | ||||
| 787 | 6568 | R | INT | 1999 | 47 | 10 | 0.87 | 0.46 |
|
P | C+E | ||||||
| 793 | 6568 | R | INT | 1999 | 75 | 20 | 0.73 | 0.23 | - | P | |||||||
| 802 | 6568 | R | INT | 1999 | 75 | 20 | 0.86 | 0.24 |
|
P | E | ||||||
| 810 | 6568 | R | INT | 1999 | 75 | 20 | 0.85 | 0.23 | - | P | |||||||
| 815 | 6568 | R | INT | 1999 | 75 | 20 | 0.84 | 0.23 | - | P | |||||||
| 846 | 6568 | R | INT | 1999 | 75 | 20 | 0.84 | 0.23 | - | P | |||||||
| 848 | 6568 | R | INT | 1999 | 47 | 10 | 0.83 | 0.47 |
|
P | E | 14 | GS | ||||
| 873 | 6568 | R | INT | 1999 | 75 | 20 | 0.88 | 0.23 |
|
P | D | -12.18 | II | * | |||
| 1297 | 6568 | R | INT | 1999 | 75 | 5 | 0.85 | 1.00 | - | P | |||||||
| 1313 | 6568 | R | INT | 1999 | 75 | 25 | 0.86 | 0.20 |
|
|
P | C | |||||
| 1316 | 6568 | R | INT | 1999 | 75 | 5 | 0.86 | 1.00 |
|
P | FIL | -11.73 | M | * | |||
| 1369 | 6568 | R | INT | 1999 | 75 | 25 | 0.87 | 0.20 | - | P | |||||||
| 1437 | 6568 | R | INT | 1999 | 90 | 23 | 0.87 | 0.20 |
|
P | C | ||||||
| 1488 | 6568 | R | INT | 1999 | 90 | 23 | 0.87 | 0.20 | - | P | * | ||||||
| 1725 | 6568 | R | INT | 1999 | 75 | 7 | 0.87 | 0.25 |
|
P | C+E | -12.62 | A | * | |||
| 1804 | 6610 | 6883 | NOT | 2001 | 60 | 45 | 0.73 | 1.47 |
|
P | D | ||||||
| 1955 | 6610 | r | NOT | 2000 | 20 | 5 | 0.74 | 0.25 |
|
P | C | ||||||
| 2007 | 6610 | 6883 | NOT | 2001 | 60 | 45 | 0.73 | 1.45 |
|
P | E | ||||||
| 2033 | 6568 | R | INT | 1999 | 75 | 25 | 0.85 | 0.22 |
|
P | C | -13.68 | A | * | |||
| 2034 | 6568 | R | INT | 1999 | 75 | 10 | 0.85 | 0.50 |
|
P | L | -13.81 | H | * | |||
| 2037 | 6568 | R | INT | 1999 | 75 | 10 | 0.87 | 0.50 |
|
P | C | Hi | |||||
| 2045 | 6568 | R | INT | 1999 | 75 | 10 | 0.87 | 0.50 | - | P | * | ||||||
Notes: long slit spectra were taken by Gavazzi et al., in prep., for
VCC 24 (
![]() Å),
VCC 324 (
Å),
VCC 324 (
![]() Å),
VCC 459 (
Å),
VCC 459 (
![]() Å),
VCC 655 (
Å),
VCC 655 (
![]() Å),
VCC 873 (
Å),
VCC 873 (
![]() Å),
VCC 1725 (
Å),
VCC 1725 (
![]() Å) and
VCC 2033 (
Å) and
VCC 2033 (
![]() Å).
Å).
VCC 1316: our H![]() data are already discussed in Gavazzi et al. (2000b).
data are already discussed in Gavazzi et al. (2000b).
VCC 1488: possible vignetting.
VCC 2034: the flux might be contaminated by a nearby bright star.
VCC 2045: no redshift available; assumed at the average velocity of the cluster,
![]() kms-1
kms-1
References:
A: Almoznino & Brosch (1998); H: Heller et al. (1999); Hi: Hippelein et al. in prep; M: Macchetto et al. (1996); II: Paper II. GS: Gavazzi et al., in preparation (spectroscopic survey drifting the telescope over the entire disc of the galaxy).
The results of the present observations are listed in Table 4, arranged as follow:
![\begin{figure}
\par\includegraphics[width=6.7cm,clip]{MS2163f2.eps}
\end{figure}](/articles/aa/full/2002/16/aa2163/img113.gif) |
Figure 2: Comparison with data in the literature: open dots are for A, filled dots for Hi, open squares for M, filled squares for H, + for I and X for G (see Table 4). |
| Open with DEXTER | |
Fluxes and equivalent widths given in this paper are in general consistent
with available measurements, as shown in Fig. 2. The average value
of the difference between our measurements and those
in the literature is:
![]() Å and
Å and
![]() .
This has been estimated excluding long-slit spectroscopic data
from (Gavazzi et al. in prep.), which, in the case of
BCD, could be non-representative
of the whole galaxy but biased towards high surface brightness HII regions,
as in the case of VCC 24, 324, 655 and 2033. The significant difference
between our H
.
This has been estimated excluding long-slit spectroscopic data
from (Gavazzi et al. in prep.), which, in the case of
BCD, could be non-representative
of the whole galaxy but biased towards high surface brightness HII regions,
as in the case of VCC 24, 324, 655 and 2033. The significant difference
between our H![]() +[NII] flux estimate and that of Heller et al. (1999)
for VCC 2034 might be due to
the contamination by a nearby star.
+[NII] flux estimate and that of Heller et al. (1999)
for VCC 2034 might be due to
the contamination by a nearby star.
We present H![]() +[NII] imaging data (fluxes and equivalent widths) of
30 Virgo galaxies obtained at the 2.5 m INT and at the 2.56 m NOT telescopes
at El Roque de los Muchachos, La Palma.
The present observations of BCD galaxies in the Virgo cluster
are aimed at completing at low luminosity a large project
of multifrequency observations of galaxies spanning a large range
in morphological type and luminosity and belonging to different environments
(cluster-isolated) for the purpose of constructing a large data-set suitable for statistical
studies.
+[NII] imaging data (fluxes and equivalent widths) of
30 Virgo galaxies obtained at the 2.5 m INT and at the 2.56 m NOT telescopes
at El Roque de los Muchachos, La Palma.
The present observations of BCD galaxies in the Virgo cluster
are aimed at completing at low luminosity a large project
of multifrequency observations of galaxies spanning a large range
in morphological type and luminosity and belonging to different environments
(cluster-isolated) for the purpose of constructing a large data-set suitable for statistical
studies.
Acknowledgements
We wish to thank the night operators for their assistance during the observations. This project is partly financed by the French PNG. The data presented here have been taken using ALFOSC, which is owned by the Instituto de Astrofisica de Andalucia (IAA) and operated at the Nordic Optical Telescope under agreement between IAA and the NBIfAFG of the Astronomical Observatory of Copenhagen. We thank L. Cortese for helping us in cros-calibrating photometric observations with spectroscopic data.
![\begin{figure}\par\par\includegraphics[width=7.7cm,clip]{MS2163f1a.eps}\includeg...
...ip]{MS2163f1e.eps}\includegraphics[width=7.7cm,clip]{MS2163f1f.eps}
\end{figure}](/articles/aa/full/2002/16/aa2163/img116.gif) |
Figure 1:
H |
| Open with DEXTER | |
![\begin{figure}\par\includegraphics[width=7.7cm,clip]{MS2163f1g.eps}\includegraph...
...ip]{MS2163f1m.eps}\includegraphics[width=7.7cm,clip]{MS2163f1n.eps}
\end{figure}](/articles/aa/full/2002/16/aa2163/img117.gif) |
Figure 1: continued. |
| Open with DEXTER | |
![\begin{figure}\par\includegraphics[width=7.7cm,clip]{MS2163f1o.eps}\includegraph...
...ip]{MS2163f1s.eps}\includegraphics[width=7.7cm,clip]{MS2163f1t.eps}
\end{figure}](/articles/aa/full/2002/16/aa2163/img118.gif) |
Figure 1: continued. |
| Open with DEXTER | |
![\begin{figure}\par\includegraphics[width=7.7cm,clip]{MS2163f1v.eps}\includegraph...
...\par\hspace*{4cm}
\includegraphics[width=7.7cm,clip]{MS2163f1z.eps}
\end{figure}](/articles/aa/full/2002/16/aa2163/img119.gif) |
Figure 1: continued. |
| Open with DEXTER | |