A&A 386, 256-270 (2002)
DOI: 10.1051/0004-6361:20020202
E. M. L. Humphreys 1 - M. D. Gray 2 - J. A. Yates 3 - D. Field 4 - G. H. Bowen 5 - P. J. Diamond 6
1 - Onsala Space Observatory, 43 992 Onsala, Sweden
2 -
Department of Physics, UMIST, PO Box 88, Manchester M60 1QD, UK
3 -
Department of Physics and Astronomy, UCL, Gower Street, London WC1E 6BT, UK
4 -
Institute of Physics and Astronomy, University of Aarhus, 8000 Aarhus C, Denmark
5 -
Department of Physics and Astronomy, Iowa State University, Ames IA 50011-3160, USA
6 -
University of Manchester, Nuffield Radio Astronomy Laboratories,
Jodrell Bank, Macclesfield,
Cheshire SK11 9DL, UK
Received 9 July 2001 / Accepted 5 February 2002
Abstract
A stellar hydrodynamic pulsation model has been combined with a SiO maser
model in an attempt to calculate the temporal variability of SiO maser emission
in the circumstellar envelope (CE) of a model AGB star. This study
investigates whether the variations in local
physical conditions brought about by
shocks are the predominant contributing factor to SiO maser
variability because, in this work, the radiative part of the pump is constant. We find that
some aspects of the variability are not consistent with a pump provided
by shock-enhanced collisions alone.
In these simulations, gas parcels of relatively
enhanced SiO abundance are distributed in a model CE by a Monte Carlo method,
at a single epoch of the stellar cycle. From this epoch on, Lagrangian motions
of individual
parcels are calculated according to the velocity fields encountered in
the model CE during the stellar pulsation cycle. The potentially masing gas parcels
therefore experience different densities and temperatures, and have varying
line-of-sight velocity gradients throughout the stellar cycle, which may or may not
be suitable to produce maser emission.
At each epoch (separated by 16.6 days), emission lines from the parcels are combined
to produce synthetic spectra and VLBI-type images.
We report here the results for v=1, J=1-0 (43-GHz) and
J=2-1 (86-GHz) masers and compare
synthetic lineshapes and images with those
observed.
Strong SiO maser emission is calculated to form in an
unfilled ring within a few stellar radii of the photosphere,
indicating a tangential amplification process.
The diameter of the synthetic maser ring is dependent upon stellar phase, as clearly
observed for TX Cam, and upon maser transition. Proper motions of brightly masing parcels
are comparable to measurements for some maser components in R Aqr and TX Cam, although we
are unable to reproduce all of the observed motions.
Synthetic lineshapes
peak at the stellar velocity, have typical Mira linewidths and vary in intensity with
stellar phase.
However, the model fails quantitatively in several respects.
We attribute these failings to (i) lack of an accurate,
time-varying stellar IR field
(ii) post-shock kinetic temperatures which are too high, due to the cooling function
included in our model and (iii) the lack of a detailed treatment of the
chemistry of the inner CE. We expect the use of oxygen-rich hydrodynamical
stellar models which are currently under development to
alleviate these problems.
Key words: stars: AGB and post-AGB - stars: mass loss - stars: variables: general - stars: circumstellar material - radiative transfer
It is well-known from VLBI experiments that bright v=1 J=1-0 SiO
maser components in M-Mira and Supergiant stars lie in approximate ring-type
structures of several AU in diameter (in the range 1.5-4.0 R*),
which are assumed to be centered on the stellar position
(Colomer et al. 1992; Diamond et al. 1994;
Greenhill et al. 1995; Miyoshi et al. 1994;
Boboltz et al. 1997; Doeleman et al. 1998 at 86-GHz;
Desmurs et al. 2000; Yi et al. 2002). The width of the
projected ring of clumpy emission
is relatively narrow. The ring diameter changes with
stellar pulsation phase,
as emission brightens and dims, during the cycles of M-Mira stars such as
TX Cam and R Aqr (Diamond & Kemball 1999; Boboltz et al. 1997).
M-Miras and other classes of star on the thermally pulsing AGB (TP-AGB) are of
interest due to their high mass loss rates (in the range 10-7-10-4
![]() yr-1) which replenish the interstellar medium with heavy elements
and dust grains. SiO masers, which may now be studied at 43-GHz with an angular
resolution of 200
yr-1) which replenish the interstellar medium with heavy elements
and dust grains. SiO masers, which may now be studied at 43-GHz with an angular
resolution of 200 ![]() as and a velocity resolution of 0.1 km s-1 using the
VLBA, provide excellent probes of the dynamics and time-varying physical conditions
of the extended atmosphere/inner CE of AGB stars. A detailed VLBA study of v=1
J=1-0 (43-GHz) masers in the Mira TX Cam provides data on the inner CE at 50 epochs
over 1.25 stellar cycles (Diamond & Kemball 1999).
as and a velocity resolution of 0.1 km s-1 using the
VLBA, provide excellent probes of the dynamics and time-varying physical conditions
of the extended atmosphere/inner CE of AGB stars. A detailed VLBA study of v=1
J=1-0 (43-GHz) masers in the Mira TX Cam provides data on the inner CE at 50 epochs
over 1.25 stellar cycles (Diamond & Kemball 1999).
An important role in the mass loss mechanism of
TP-AGB stars is thought to be played by a combination of stellar
pulsation-driven shock waves and
radiation pressure on dust. In this scenario, a succession of shocks
greatly extends the Mira atmosphere, and material is accelerated, overcoming
the gravity of the star with accompanying mass loss. Observational evidence
for shock waves is provided by large amplitudes (![]() = 20-30 km s-1)
in the velocity curves derived from photospheric CO lines. These
indicate that an outwardly propagating shock wave is associated
with the stellar pulsation (Hinkle et al. 1984;
1997).
However models are unable to reproduce the relatively high
mass loss rates measured for TP-AGB stars without the inclusion of
radiation pressure on dust, which must be formed close to the star
(Bowen 1988).
This is possible in the shocked model in which relatively dense
gas is levitated to regions of lower temperature by the shocks,
allowing dust condensation to take place within a few stellar radii
from the photosphere.
Radiation pressure from stellar photons then accelerates the grains,
driving a slow, cool wind through frictional coupling with
the circumstellar gas.
Infrared interferometry measurements support the formation of dust
shells with inner radii of 3-5 R* towards a number of Miras
and Supergiants (Danchi et al. 1994).
Towards the Supergiant VX Sgr, coordinated SiO maser and infrared
interferometry observations indicate that the v=1 J=1-0 (43-GHz) ring of
bright SiO masers and the inner radius of the dust shell are
well-separated, the masers lying at
= 20-30 km s-1)
in the velocity curves derived from photospheric CO lines. These
indicate that an outwardly propagating shock wave is associated
with the stellar pulsation (Hinkle et al. 1984;
1997).
However models are unable to reproduce the relatively high
mass loss rates measured for TP-AGB stars without the inclusion of
radiation pressure on dust, which must be formed close to the star
(Bowen 1988).
This is possible in the shocked model in which relatively dense
gas is levitated to regions of lower temperature by the shocks,
allowing dust condensation to take place within a few stellar radii
from the photosphere.
Radiation pressure from stellar photons then accelerates the grains,
driving a slow, cool wind through frictional coupling with
the circumstellar gas.
Infrared interferometry measurements support the formation of dust
shells with inner radii of 3-5 R* towards a number of Miras
and Supergiants (Danchi et al. 1994).
Towards the Supergiant VX Sgr, coordinated SiO maser and infrared
interferometry observations indicate that the v=1 J=1-0 (43-GHz) ring of
bright SiO masers and the inner radius of the dust shell are
well-separated, the masers lying at ![]() 3 R* inside the
dust region of the supergiant star (Greenhill et al. 1995).
3 R* inside the
dust region of the supergiant star (Greenhill et al. 1995).
Much remains to be understood about the complex processes in these stars.
For example, recent multi-wavelength observations of the S-type Mira, ![]() Cygni, show
that the star is largest at minimum light, whereas current non-linear pulsation models
predict the maximum physical size to occur close to maximum light
(Young et al. 2000). With respect to the inner CE region, measurements
of the 8-GHz "radio photospheres''
of several stars indicate that shocks must have been
significantly damped by the inner radius of the SiO maser zone
and propagate outwards with velocities of <5 km s-1 (Reid & Menten 1997).
Yet proper motion measurements for the SiO masers in TX Cam show that some
components are outflowing at velocities of
Cygni, show
that the star is largest at minimum light, whereas current non-linear pulsation models
predict the maximum physical size to occur close to maximum light
(Young et al. 2000). With respect to the inner CE region, measurements
of the 8-GHz "radio photospheres''
of several stars indicate that shocks must have been
significantly damped by the inner radius of the SiO maser zone
and propagate outwards with velocities of <5 km s-1 (Reid & Menten 1997).
Yet proper motion measurements for the SiO masers in TX Cam show that some
components are outflowing at velocities of ![]() 10 km s-1 (Diamond,
private communication). In addition, magnetic fields in the SiO maser zone may be
of the order of several Gauss (Kemball & Diamond 1997), and will
therefore play a crucial role in the gas dynamics of the inner CE, or may be
only a few tens of milliGauss
(Wiebe & Watson 1998). Finally, recent observations appear to have detected
rotation in the SiO maser zone of some stars (e.g. Boboltz & Marvel 2000).
10 km s-1 (Diamond,
private communication). In addition, magnetic fields in the SiO maser zone may be
of the order of several Gauss (Kemball & Diamond 1997), and will
therefore play a crucial role in the gas dynamics of the inner CE, or may be
only a few tens of milliGauss
(Wiebe & Watson 1998). Finally, recent observations appear to have detected
rotation in the SiO maser zone of some stars (e.g. Boboltz & Marvel 2000).
As a first essay towards understanding some of these observations, we combine a model of a pulsating TP-AGB star, in which mass loss is driven by shocks and radiation pressure on dust, with an SiO maser model. Humphreys et al. (1996; hereafter H96) showed how, at a single stellar phase, the key features of SiO maser emission are reproduced by such a model. In the present study, the crude representation of the stellar IR radiation field results in a decoupling of the effects on SiO masers of a varying IR radiation field and shocks in the inner CE. The aim of the present study is to perform simulations of the time evolution of SiO masers, both in intensity and in spatial distibution, throughout a stellar pulsation cycle. Although constant radiative pumping is present, we effectively determine whether the effect of shocks alone is sufficient to reproduce the observed features of SiO maser variability.
Three types of variability may be identified. Firstly, there is variability from cycle to cycle, random in behaviour in the sense that SiO maser spectra are quite different in appearance from one cycle to the next. Secondly, there may be relatively orderly long-term variability within a cycle, in which maser flux passes through a maximum at an optical phase not far removed from maximum light, as described in Sect. 2.1. Thirdly there is rapid variability over a period of a day to a few tens of days, as described in Sect. 2.2. We are concerned mainly in the present paper with the second and third types of variability, which we refer to as long term and short term (or rapid) variability. We do not address variability from cycle to cycle in this work, except for an investigation of the stellar phase at which maser emission is severely disrupted (Sect. 4.3).
The long term variability of SiO masers has been investigated in monitoring
programs towards many Mira variables, for example o Ceti (Mira), R Aqr,
TX Cam, U Her, R LMi, IK Tau (=NML Tau), R Leo, W Hya, ![]() Cygni,
R Cas, U Ori, R Aql, R Cnc, X Hya and T Cep. The most complete sets of observations
performed to date are those of Martínez et al. (1988; hereafter MBA88)
and Alcolea et al. (1999) for v=1 43-GHz masers
and
Nyman & Olofsson (1986; NO86 hereafter) for v=1 86-GHz masers.
These studies demonstrate long and short term variability. A
statistical approach to the study of long term variability has been
taken by papers involving Cho. The same maser transition was observed
towards a large sample of stars, yielding statistical information on
that maser as a function of stellar phase. Very short term variability
on a timescale of 12 to 24 hours measured over a small part of a stellar
cycle has been investigated in one detailed study of R Cas and R Leo
(Pijpers et al. 1994) at 43-GHz v=1 J=1-0.
We consider first the observational data for long term variability.
Cygni,
R Cas, U Ori, R Aql, R Cnc, X Hya and T Cep. The most complete sets of observations
performed to date are those of Martínez et al. (1988; hereafter MBA88)
and Alcolea et al. (1999) for v=1 43-GHz masers
and
Nyman & Olofsson (1986; NO86 hereafter) for v=1 86-GHz masers.
These studies demonstrate long and short term variability. A
statistical approach to the study of long term variability has been
taken by papers involving Cho. The same maser transition was observed
towards a large sample of stars, yielding statistical information on
that maser as a function of stellar phase. Very short term variability
on a timescale of 12 to 24 hours measured over a small part of a stellar
cycle has been investigated in one detailed study of R Cas and R Leo
(Pijpers et al. 1994) at 43-GHz v=1 J=1-0.
We consider first the observational data for long term variability.
The following general characteristics can be derived from observations of Miras.
(i) The period is stable from cycle to cycle, but spectra vary greatly (NO86). Indeed, so do photospheric sizes, as measured by speckle interferometry (Bonneau et al. 1982).
(ii) Optical, infrared and low frequency (43 and 86-GHz) SiO maser fluxes are
correlated. There is firm evidence for an average phase lag of ![]() 0.2 of a period
between optical and maser maxima, but this may vary between objects, and for the same
object, between cycles (MBA88, Cho et al. 1996; Alcolea et al. 1999).
From the 43-GHz data in MBA88 the phase lag had a mean of 0.18, standard deviation 0.1.
0.2 of a period
between optical and maser maxima, but this may vary between objects, and for the same
object, between cycles (MBA88, Cho et al. 1996; Alcolea et al. 1999).
From the 43-GHz data in MBA88 the phase lag had a mean of 0.18, standard deviation 0.1.
(iii) SiO maser emission appears to vary in phase
with near and mid-IR lightcurves. Alcolea et al. (1999)
show that the SiO maser maxima are closely
related to the light curve at 3.79 and 4.64 ![]() m for R Aqr and IK Tau. However,
the amplitudes of the IR and maser lightcurves are not correlated.
A good correlation of the maxima of 86GHz masers and the IR continuum at
1.04
m for R Aqr and IK Tau. However,
the amplitudes of the IR and maser lightcurves are not correlated.
A good correlation of the maxima of 86GHz masers and the IR continuum at
1.04 ![]() m was found in 6 out of 8 Miras studied in NO86, but failed for two
objects, R Leo and R Aql.
m was found in 6 out of 8 Miras studied in NO86, but failed for two
objects, R Leo and R Aql.
(iv) SiO masers often have strong linear polarization (Barvainis & Predmore 1985) which may introduce bias into observations made with a single linearly polarized feed. NO86 and MBA88 argue the bias is small however. Papers involving Clark are the best in this respect, since they measure the Stokes parameters I, Q and U.
(v) The contrast between the highest and lowest peak lineshape intensity
(and lineshape area) during a cycle is very variable from cycle to cycle and
star to star.
For the Mira-type stars studied at 43GHz in
Alcolea et al. (1999), this value varied between 1 up to as high as 20,
in the
case of o Ceti.
However, at 86GHz the dynamic range during one cycle of o Ceti was at
least 100, and could have been considerably larger, since masers in this source
fell below the 3![]() detection limit of 5Jy near minimum.
detection limit of 5Jy near minimum.
(vi) The velocity extent of emission is typically ![]() 15 km s-1, with
the cycle-averaged peaks of the spectra close to the stellar velocity (NO86).
Cho et al. (1996) find the mean velocity of their sample was
red-shifted with respect to V* for optical phase 0.3 to 0.8 with blue-shifted
emission appearing from
15 km s-1, with
the cycle-averaged peaks of the spectra close to the stellar velocity (NO86).
Cho et al. (1996) find the mean velocity of their sample was
red-shifted with respect to V* for optical phase 0.3 to 0.8 with blue-shifted
emission appearing from ![]() 0.85 and dominating between 0.0 and 0.2. The cycle-averaged
spectral peak at v=1, J=1-0 was 0.3 km s-1 to the red of V*, compared
to the blueshift of
0.85 and dominating between 0.0 and 0.2. The cycle-averaged
spectral peak at v=1, J=1-0 was 0.3 km s-1 to the red of V*, compared
to the blueshift of ![]() 1 km s-1 found by NO86.
In addition, SiO profiles sometimes have unusually broad, low-intensity
linewings which can exceed the expansion velocity of the circumstellar
envelope as traced by thermal CO measurements, at least at 86-GHz
(Herpin et al.1998).
1 km s-1 found by NO86.
In addition, SiO profiles sometimes have unusually broad, low-intensity
linewings which can exceed the expansion velocity of the circumstellar
envelope as traced by thermal CO measurements, at least at 86-GHz
(Herpin et al.1998).
Clark et al. (1984) and Clark et al. (1985) decomposed their 86-GHz maser spectra into a number of overlapping Gaussian components. They find for R Leo and W Hya that individual Gaussian components in the Stokes I spectra often persist in successive spectra over the greater part of an optical cycle. Miller et al. (1984) reach the same conclusion for o Ceti. The consistency of polarization position angle in these individual components is an important factor in reaching this conclusion. Given that the centre velocity, velocity width, polarization position angle and fractional polarization of individual features persist throughout much of the optical cycle, Clark et al. (1985) argue that individual maser zones are stable and discrete physical entities. The continuity of maser features was reported to be broken at, or just prior to, maximum light for W Hya (Clark et al. 1985), for R Cas (Clark et al. 1982a), for R Leo (Clark et al. 1982b; Clark et al. 1984) and for o Ceti (Miller et al. 1984). NO86 however found no such result for R Cas, R Leo and o Ceti, but note that a lack of polarization information (and line blending) could have caused the effect to be missed. According to MBA88 and Alcolea et al. (1999) however, continuity appears to be broken where SiO maser brightness is at minimum, at around an optical phase of 0.7, rather than near optical maximum.
VLBI studies have been made towards several M-Miras:
R Aqr (Boboltz et al. 1997; Hollis et al. 2001 for v=1 43-GHz masers); TX Cam (Diamond & Kemball 1999 for v=1 43-GHz masers;
Desmurs et al. 2000 for v=1 and v=2 43-GHz masers;
Yi et al. 2002 for v=1 and v=2 43-GHz masers); o Ceti
(Gardner et al. 2000 for v=1 and v=2 43-GHz masers); R Cas
(Yi et al. 2002 for v=1 and v=2 43-GHz masers).
Boboltz et al. (1997) made the first proper motion measurements of
circumstellar SiO masers towards R Aqr. They observed an infalling mean component
proper motion of 1 mas in 98 days, corresponding to
0.22 AU over 0.25 stellar periods or 4 km s-1, for their assumed
distance to R Aqr of 220 pc.
In the long-term monitoring of TX Cam, more
complex motions are evident.
Maser components are generally expanding
outwards from the star at a typical velocity of 3.65 km s-1
(Diamond & Kemball (1999), although some have constant
outflow velocities as high as ![]() 10 km s-1. In one
quadrant of the images, components decelerate smoothly as they appear
to run into denser material. Some of the ring also shows features sliding in
non-radial directions. Masers in one region of the ring
fall inwards towards the star and then appear to "bounce back'',
an effect which could be due to a new shockwave moving through the maser zone
(Diamond, private communication).
Disruption to the maser ring appears to occur at
maser minimum light at around optical phase 0.67 (Diamond, private communication).
A new maser emission ring, of smaller angular extent than the disrupted
ring, is then observed to appear.
10 km s-1. In one
quadrant of the images, components decelerate smoothly as they appear
to run into denser material. Some of the ring also shows features sliding in
non-radial directions. Masers in one region of the ring
fall inwards towards the star and then appear to "bounce back'',
an effect which could be due to a new shockwave moving through the maser zone
(Diamond, private communication).
Disruption to the maser ring appears to occur at
maser minimum light at around optical phase 0.67 (Diamond, private communication).
A new maser emission ring, of smaller angular extent than the disrupted
ring, is then observed to appear.
![\begin{figure}
\par\includegraphics[angle=270,width=8.4cm,clip]{MS1648f1a.ps}\pa...
...1b.ps}\par\includegraphics[angle=270,width=8.4cm,clip]{MS1648f1c.ps}\end{figure}](/articles/aa/full/2002/16/aa1648/img10.gif) |
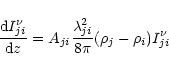
Figure 1: a) The variation with distance of the radial velocity of material in the circumsteller envelope (CE) of a M-Mira variable for 4 model epochs, obtained using the hydrodynamic-pulsation model of Bowen described in Sect. 3.1. The model epochs shown are 1, 6, 11 and 16 corresponding respectively to 0, 83, 166 and 249 days in the stellar pulsation cycle. The characteristics of the model M-Mira are given in Table 1. b) As for a), but showing the variation of gas kinetic temperature. c) As for a), but showing the variation of gas number density. |
| Open with DEXTER | |
The technical means employed in this paper have been described in
some detail in H96. A hydrodynamic pulsation model for M-type Miras, based
upon that in Bowen (1988, 1989), is coupled to a model
for SiO maser action based on that described in Doel et al. (1995;
D95 hereafter) and Gray et al. (1995). H96 considered only a single phase of the stellar pulsation
and showed how, at this phase, the physical conditions in the CE were such
that a ring of SiO masers should form about the star at a distance from the
photosphere of ![]() 1 R* (1 R* = 1.1 AU). The synthetic map produced
showed an encouraging resemblance to data acquired using the VLBA
(Diamond et al. 1994 and new data presented in H96).
The lineshapes of masers in various transitions in v=1 and v=2 ranging
from J=1-0 to J=7-6 were also presented and were found in form and
width to resemble lines observed in the very large number of sources in the
literature. H96 allowed certain conclusions to be drawn with respect to the
location of SiO masers, that is, that they do not in general reside in the
stellar wind, defining the stellar wind as that part of the flow in which
the radial velocity of the CE is always directed away from the photosphere
with no further episode of infall. The agreement between the calculated and
observed position of SiO masers lends support to the shock driven pulsation
model, since it is this model which determines spatial variation of number
density, temperature and velocity field which in turn dictates where the SiO
masers should be found.
1 R* (1 R* = 1.1 AU). The synthetic map produced
showed an encouraging resemblance to data acquired using the VLBA
(Diamond et al. 1994 and new data presented in H96).
The lineshapes of masers in various transitions in v=1 and v=2 ranging
from J=1-0 to J=7-6 were also presented and were found in form and
width to resemble lines observed in the very large number of sources in the
literature. H96 allowed certain conclusions to be drawn with respect to the
location of SiO masers, that is, that they do not in general reside in the
stellar wind, defining the stellar wind as that part of the flow in which
the radial velocity of the CE is always directed away from the photosphere
with no further episode of infall. The agreement between the calculated and
observed position of SiO masers lends support to the shock driven pulsation
model, since it is this model which determines spatial variation of number
density, temperature and velocity field which in turn dictates where the SiO
masers should be found.
The present work is an extension of H96 involving calculations at 20 phases of stellar pulsation, carrying the evolution of the CE through a complete stellar cycle. As the cycle develops, the number densities, kinetic temperatures and bulk velocity fields change as a shock propagates through the photosphere and into the CE. This in turn causes populations of rovibrational levels of SiO to be modified. Inversions between rotational levels therefore increase, decrease or disappear and maser emission is modified accordingly. The remainder of this section is devoted to a description of the hydrodynamic pulsation and the kinetic and radiative SiO maser models.
| Parameters of the model M-Mira | |
| Mass | 1 |
| Fundamental Period | 332 days |
| Stellar Radius | 244
|
| Effective Temperature | 3002.2 K |
| Maximum Inner Boundary Speed | 3.93 km s-1 |
| Mass Loss Rate | 1.8 |
The model of the time-varying CE is based upon that described in Bowen (1988, 1989) and is identical to that described in H96. The models of Bowen have been chosen over more recent models, which include time-dependent dust formation, such as the work of Bessell, Höfner and Fleischer, as they have tended to concentrate on carbon-rich variables (Fleischer et al. 1991, 1992; Bessell et al. 1996; Höfner et al. 1996; Höfner 1999), which clearly do not support SiO masers since the greater part of the oxygen budget is bound up in CO. The models by Bowen represent oxygen-rich Miras, which comprise the vast majority of the AGB star population, although dust in these models is introduced as a parametrised opacity.
Briefly, the stellar oscillation is driven by a sinusoidally varying force situated
below the photosphere of the star. Radiation pressure is assumed to act on
dust, and on H2O molecules. The quantity of dust present depends on the
grain temperature, with no dust for
![]() = 2000 K and a maximum
achieved for
= 2000 K and a maximum
achieved for
![]() < 1000 K. The outflow of material from the star becomes
a steady wind at 40 to 50 R*, the outer boundary of the model. The same stellar
parameters are used as in H96 and for ease of reference these are shown again
in Table 1. The stellar phase in the model (the "model phase'') is
defined as zero when the sinusoidally varying inner boundary is moving outwards with
maximum velocity. We refer to the
problem of relating the model phase to stellar optical phase in
Sect. 4.
< 1000 K. The outflow of material from the star becomes
a steady wind at 40 to 50 R*, the outer boundary of the model. The same stellar
parameters are used as in H96 and for ease of reference these are shown again
in Table 1. The stellar phase in the model (the "model phase'') is
defined as zero when the sinusoidally varying inner boundary is moving outwards with
maximum velocity. We refer to the
problem of relating the model phase to stellar optical phase in
Sect. 4.
![\begin{figure}
\par\includegraphics[angle=270,width=8.8cm,clip]{MS1648f2.ps}\end{figure}](/articles/aa/full/2002/16/aa1648/img13.gif) |
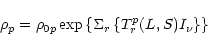
Figure 2: The number density - temperature space which 4 masing parcels of gas experience during a stellar cycle. Points are separated by an interval of 16.6 days. The start and end of the cycle is marked for one of the parcels. |
| Open with DEXTER | |
In the CE, a parcel of gas for example close to the photosphere, initially experiences a brief but very strong outward acceleration, and thereafter decelerates, reversing direction. After a period of infall it is then driven outwards again and this cycle is repeated with successively weaker impulses as the material finds itself increasingly further from the photosphere. Thus if one were arbitrarily to choose some initial radial position within the CE, and ride on that parcel of gas in the co-moving Lagrangian frame, then one would experience a continuously changing set of number densities, temperatures and velocity fields. The nature of these changes would depend on the initial choice of radius. This is illustrated in Figs. 1a, b and c and in Fig. 2. Figure 1a shows the variation in velocity at four different model phases, Fig. 1b the variation in temperature and Fig. 1c the variation in number density. The model phases chosen correspond to zero, 83 days, 166 days and 249 days, the stellar pulsational period being 332.0 days. Values are plotted out to 10 AU only, in order to show the zone of interest for SiO masers. Any vertical line drawn through the four graphs in each figure illustrates how the chosen parameter would vary with stellar phase. Figure 2 illustrates the density and temperature history, in a Lagrangian frame, for four masing parcels of gas during a stellar cycle i.e. Fig. 1 gives an Eulerian view, and Fig. 2 the Lagrangian view following a particle. Points in Fig. 2 are separated by 16.6 days. Similar phase plots may be made for velocity-temperature and velocity-density.
The calculation of maser spectra and of maps proceeds as follows. Sites of maser action in the CE are first chosen on a random basis, for one epoch of the calculations only. At present, it is assumed for simplicity that maser zones maintain their integrity throughout the cycle involving model phase zero to 1. The trajectories of these initially chosen sites are followed in terms of their radial distances from the star as the cycle progresses, using data from the stellar pulsation model. At any chosen phase, for each radial distance a number density, kinetic temperature and velocity field may be assigned, as is apparent from Figs. 1a, b, c and Fig. 2. For each such distance, SiO rovibrational level populations are calculated. If these populations lead to inversions, the intensities of the resulting masers are calculated for paths in our line-of-sight. In this way, maps of SiO maser emission may be calculated for as many phases of the stellar cycle as desired and for any masing transition. The series of steps involved in synthesising maser images is described in more detail in the succeeding sections. Maser spectra are generated at any phase by summing over the contributions of individual maser spots, with line-of-sight velocity shifts appropriate for their position.
VLBI images of SiO emission at 43-GHz and 86-GHz clearly show that at some chosen
radial distance from the photosphere only certain portions of gas in the CE are
capable of sustaining maser action. This suggests that there exists small-scale,
non-radial velocity structure superimposed on the large-scale velocity structure
calculated by the stellar pulsation model and/or inhomogeneity in the density and
temperature structure of the CE, such as clump formation via thermal instabilities
(Cuntz & Muchmore 1994). Since the nature of such small-scale
structure is unknown, sites of maser action were chosen randomly in H96. This
turned out to be a successful means to reproduce the appearance of VLBI maps
(of TX Cam) and we adopt the same procedure here. Thus, as in H96, we choose sites
of maser action in the CE at random radial distances from the star within a
specified range of radius, r, and in fact we start with the same set as in H96.
Only directions of maser propagation in our line-of-sight are considered
(see Sect. 3.5). The range of radius over which values are
randomly chosen extends from an inner boundary
![]() = R* = 1.7
= R* = 1.7 ![]() 1011 m to an outer boundary
1011 m to an outer boundary
![]() = 5 R*. Tests with larger values of
= 5 R*. Tests with larger values of
![]() showed that this range of radius was sufficient to include all masers in all transitions.
The number of random values of r used is a free parameter of the model.
We found in H96 that
1500 values, of which
showed that this range of radius was sufficient to include all masers in all transitions.
The number of random values of r used is a free parameter of the model.
We found in H96 that
1500 values, of which ![]() 25
25![]() yielded inversions, was appropriate to reproduce the
appearance of VLBI maps of TX Cam in terms of the number of bright maser spots around the
host star. The same value was chosen in the present study. Maser propagation is discussed
in more detail in Sect. 3.5.
yielded inversions, was appropriate to reproduce the
appearance of VLBI maps of TX Cam in terms of the number of bright maser spots around the
host star. The same value was chosen in the present study. Maser propagation is discussed
in more detail in Sect. 3.5.
The CE is seen in projection in the plane of the sky and the location of masing zones
within the spherical CE must be fully specified in order to reproduce VLBI maps. We use
spherical polar coordinates r, ![]() and
and ![]() ,
choosing random points in such a way as to provide uniform sampling by volume. Thus a set of random r,
,
choosing random points in such a way as to provide uniform sampling by volume. Thus a set of random r, ![]() and
and ![]() is
chosen and weighted as described in detail in H96, giving r',
is
chosen and weighted as described in detail in H96, giving r', ![]()
![]() and
and ![]()
![]() ,
where primed quantities refer to weighted values. In summary, r' defines the physical conditions
and
,
where primed quantities refer to weighted values. In summary, r' defines the physical conditions
and ![]()
![]() and
and ![]()
![]() are used to locate the position, in the plane of the sky, of any
maser spot that may develop. The next stage is to advance the value of radius r' to that
corresponding to the next phase for which the physical conditions and maser location are
required. The distance
are used to locate the position, in the plane of the sky, of any
maser spot that may develop. The next stage is to advance the value of radius r' to that
corresponding to the next phase for which the physical conditions and maser location are
required. The distance ![]() that any mass of gas of velocity V travels in time t is given by
that any mass of gas of velocity V travels in time t is given by
 |
(1) |
The methods used for the calculation of the populations of SiO rovibrational levels
have been described in detail in D95 with modifications described in H96.
Populations of levels are initially calculated
ignoring the presence of inversion in the medium or the influence of maser radiation.
In this connection, population inversions involve rotational transitions whose line
emissivities are negligible by comparison with those of rovibrational transitions
(H96; Yates et al. 1997). The effects of the presence of masers are discussed
in Sect. 3.5. A discussion of the work of other groups involved in
modelling
SiO maser emission (e.g. Langer & Watson 1984; Lockett & Elitzur 1992; Bujarrabal 1994a,
1994b) is given in D95.
Calculation of the SiO populations involves solution of the master equations for
200 rovibrational energy levels of SiO, involving v = 0-4 and J = 0-39 in each
vibrational state.
Stellar continuum radiation is included with a geometrical dilution
factor of 0.1 (D95). As the model has a fixed photospheric temperature,
with no phase variation (see Table 1), and is represented as a black-body,
the radiative part of the pumping scheme is represented only crudely. We
note that the present hydrodynamic model provides no means of tracing either
the true radius or temperature of the photosphere in the near to mid-IR
wavelength range. Consequently, the present combined model is not capable
of testing the observed phase correlation between the IR continuum and
low-frequency SiO maser peaks. The current work is therefore a useful
test, in that it provides information about those aspects of maser
time variability which can and cannot be reproduced by a pump in which
collisions provide that part of the pumping scheme which is dependent on
stellar phase.
An infrared dust radiation field is also present. The dust continuum
is represented in a crude manner by a black-body function at a single dust temperature of
200 K modified by a wavelength dependent factor,
![]() ,
where
,
where
![]() is 80
is 80 ![]() m
and p = 1.1 (Rowan-Robinson et al.1986), and the shortest value of
m
and p = 1.1 (Rowan-Robinson et al.1986), and the shortest value of ![]() is
is
![]() 8
8 ![]() m. D95 shows that the only significant property of the dust radiation
field (or any other external field) is that it should be weak. Thus our very simple
and inaccurate representation of the dust field is not a significant source of error
in the computation of the SiO energy level populations except for high v-states and minor
isotopomers. The dust radiation field is spatially diluted through a factor of 0.01, since
it is assumed that significant quantities of dust are not found in regions occupied by SiO
masers (Greenhill et al. 1995). The dust may also be patchy, with a covering
factor significantly <1 (D95). Collisional rate coefficients for the transfer
of rotational
and rovibrational energy between SiO and its collision partners (see below) have been
taken
from Bieniek & Green (1983a, 1983b; hereafter BG83) where values have been
extrapolated, as
described in D95 and Doel (1990), to include all v and J states in
the maser model. We note that Lockett & Elitzur (1992) also employed the
rate data of BG83, and
extended the range of vibrational transitions treated up to
m. D95 shows that the only significant property of the dust radiation
field (or any other external field) is that it should be weak. Thus our very simple
and inaccurate representation of the dust field is not a significant source of error
in the computation of the SiO energy level populations except for high v-states and minor
isotopomers. The dust radiation field is spatially diluted through a factor of 0.01, since
it is assumed that significant quantities of dust are not found in regions occupied by SiO
masers (Greenhill et al. 1995). The dust may also be patchy, with a covering
factor significantly <1 (D95). Collisional rate coefficients for the transfer
of rotational
and rovibrational energy between SiO and its collision partners (see below) have been
taken
from Bieniek & Green (1983a, 1983b; hereafter BG83) where values have been
extrapolated, as
described in D95 and Doel (1990), to include all v and J states in
the maser model. We note that Lockett & Elitzur (1992) also employed the
rate data of BG83, and
extended the range of vibrational transitions treated up to ![]() = 4.
Langer & Watson (1984) used the BG83 data for collisions
of molecular hydrogen with SiO, and
additionally estimated rates for collisions of SiO with
atomic hydrogen.
The Sobolev or large velocity gradient (LVG) approximation is used to
calculate self-consistent
populations and line and continuum radiation fields, as in
Lockett & Elitzur (1992).
In support of the use of this approximation, CE models clearly indicate the presence of
supersonic velocity shifts over distances smaller than or comparable to the dimensions of
the maser zone. However the physical conditions in the CE close to the photosphere change
markedly over a typical Sobolev length, whilst in the simple form of LVG used here
conditions
are assumed constant over a Sobolev length (=Doppler width divided by the local velocity
gradient). The LVG approximation evidently introduces a coarse-grained interpretation of
observational data. As described in H96, the number density may change by as much
as an order
of magnitude over the Sobolev length, representing a rather severe spatial
averaging. As in H96
we use a general expression for the angle-averaged photon escape probability
in a spherically
symmetric system, using values of the radial velocity gradient
= 4.
Langer & Watson (1984) used the BG83 data for collisions
of molecular hydrogen with SiO, and
additionally estimated rates for collisions of SiO with
atomic hydrogen.
The Sobolev or large velocity gradient (LVG) approximation is used to
calculate self-consistent
populations and line and continuum radiation fields, as in
Lockett & Elitzur (1992).
In support of the use of this approximation, CE models clearly indicate the presence of
supersonic velocity shifts over distances smaller than or comparable to the dimensions of
the maser zone. However the physical conditions in the CE close to the photosphere change
markedly over a typical Sobolev length, whilst in the simple form of LVG used here
conditions
are assumed constant over a Sobolev length (=Doppler width divided by the local velocity
gradient). The LVG approximation evidently introduces a coarse-grained interpretation of
observational data. As described in H96, the number density may change by as much
as an order
of magnitude over the Sobolev length, representing a rather severe spatial
averaging. As in H96
we use a general expression for the angle-averaged photon escape probability
in a spherically
symmetric system, using values of the radial velocity gradient
![]() and the tangential
velocity gradient v/r' taken from the stellar pulsation model for each value of radius.
As we discuss in H96 we ignore the influence of non-monotonic velocity gradients, which
may cause a ray of light to encounter additional surfaces in the medium at equal velocity
to an emitting point (Rybicki & Hummer 1978). D95 concluded that masers are
pumped by collisions at typically 1500 K and a number
density of
and the tangential
velocity gradient v/r' taken from the stellar pulsation model for each value of radius.
As we discuss in H96 we ignore the influence of non-monotonic velocity gradients, which
may cause a ray of light to encounter additional surfaces in the medium at equal velocity
to an emitting point (Rybicki & Hummer 1978). D95 concluded that masers are
pumped by collisions at typically 1500 K and a number
density of ![]() 5
5 ![]() 109 cm-3,
in an environment containing large velocity gradients, perhaps in excess of
105 km s-1pc-1, and experiencing only a weak dust continuum radiation
field. D95 pointed out that these conditions were consistent with those predicted by
CE models (e.g. Willson 1987; Bowen 1988; Bowen 1989;
Bowen & Willson 1991; Fleischer et al. 1992) for a zone lying
within about a stellar radius from the photosphere.
109 cm-3,
in an environment containing large velocity gradients, perhaps in excess of
105 km s-1pc-1, and experiencing only a weak dust continuum radiation
field. D95 pointed out that these conditions were consistent with those predicted by
CE models (e.g. Willson 1987; Bowen 1988; Bowen 1989;
Bowen & Willson 1991; Fleischer et al. 1992) for a zone lying
within about a stellar radius from the photosphere.
The chief sources of error in the calculation of the populations of SiO energy levels are:
(i) the use of inaccurate rate coefficients for energy transferring collisions between SiO and collision partners. Calculated values of BG83 are for He. Collision partners in the CE are H2 and H, in unknown proportions, with a relatively small contribution from He.
(ii) use of the LVG approximation. Exact methods, omitting velocity gradients, have been used in Bujarrabal (1994a, 1994b) for SiO masers. Exact methods involving Accelerated Lambda Iteration have been developed for treating radiative transfer in molecular systems (Jones et al. 1994; Randell et al. 1995; Yates et al. 1997) and these could be used to advantage here (see Sect. 5). However, they would be inconsistent with the symmetry-breaking assumption used to simulate clumping in the present work.
(iii) a lack of any independent chemical model to calculate the SiO abundance.
The ratio of SiO is fixed at 10-4 of the total particle number density,
where the number density is represented in terms of H2 molecules. This
value was chosen on the basis of the estimation given by D95,
in which compositions for circumstellar gas and dust were assumed and then a gas to
dust mass ratio argument was used to yield an upper limit to the SiO abundance.
We note that this value is somewhat higher than the generally accepted value
of ![]() 5
5 ![]() 10-5 for the inner CE, see for example Bujarrabal et al.
(1989).
The effect of different SiO abundances upon SiO maser emission was investigated by
D95.
In the range 5
10-5 for the inner CE, see for example Bujarrabal et al.
(1989).
The effect of different SiO abundances upon SiO maser emission was investigated by
D95.
In the range 5 ![]() 10-5-2
10-5-2 ![]() 10-4, the unsaturated
maser gain coefficients were found to be essentially proportional to n(SiO).
In the
absence of any chemical model, this abundance remains unchanged throughout these
calculations for all conditions encountered in the SiO maser zones for all phases
of the star, excepting when kinetic temperatures exceed 5700 K. On the basis
of thermodynamic calculations, which indicate that SiO will be largely dissociated
above this temperature in the inner CE (Field, private communication), we include
a crude cut-off assuming
negligible abundance of SiO at those sites for which
10-4, the unsaturated
maser gain coefficients were found to be essentially proportional to n(SiO).
In the
absence of any chemical model, this abundance remains unchanged throughout these
calculations for all conditions encountered in the SiO maser zones for all phases
of the star, excepting when kinetic temperatures exceed 5700 K. On the basis
of thermodynamic calculations, which indicate that SiO will be largely dissociated
above this temperature in the inner CE (Field, private communication), we include
a crude cut-off assuming
negligible abundance of SiO at those sites for which ![]() > 5700 K.
> 5700 K.
There is good evidence that bright SiO maser spots are strongly saturated in M-Miras, as discussed in detail in D95. Populations are therefore substantially modified in the volume of gas occupied by bright masers. Observations indicate that masers fill only a very small proportion of the total volume of the maser zone (e.g. Greenhill et al. 1995) and the assumption is made here, as in H96, that saturating masers are sufficiently spatially confined that they do not affect the general pumping cycle elsewhere in the maser zone. Hence the omission of masers from the calculation of level populations described in Sect. 3.4. Maser propagation occurs through exponential growth followed by a region involving saturation, if rays achieve sufficient intensity. Maser polarization (Sects. 2.1 and 2.3; McIntosh et al. 1994; Nedoluha & Watson 1990, 1994) is not included in our calculations. Maser saturation and coupling of the maser radiation to the kinetic master equations are treated with a semi-classical formalism, in which the radiation is treated according to Maxwell's equations but the response of the molecular ensemble is calculated using quantum mechanical density matrix theory (Field & Richardson 1984; Field 1985; Field & Gray 1988). All effects of saturation and competitive gain are included in the propagation of a maser beam through the gas containing population inversions. The masing zone is assumed to amplify a black-body background at the appropriate wavelength at the local kinetic temperature of the maser zone. Our calculations amplify this background as a function of frequency within the maser line.
Propagation of maser rays
is performed by numerical integration of the set of coupled equations
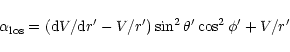 |
(4) |
![\begin{figure}
\par\mbox{
\includegraphics[angle=-90,width=4cm,clip]{f1.eps}\inc...
...f15.eps}\includegraphics[angle=-90,width=3.6cm,clip]{f20.eps} }
\par\end{figure}](/articles/aa/full/2002/16/aa1648/img39.gif) |
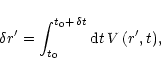
Figure 3:
Time series of v=1 J=1-0 (43-GHz) SiO maser lineshapes calculated at intervals of
16.6 days throughout the stellar cycle (of period 332.0 days). Where " |
| Open with DEXTER | |
Data are presented in a manner as far as possible similar to that of observational work described in Sect. 2. The appearance of synthetic SiO maser lineshapes and images at 43 and 86-GHz in the v=1 state is discussed, and the predicted proper motions of bright maser components are described. Unfortunately, there is uncertainty in establishing the relation between the model phase of our simulated data with stellar optical phase. This comes about as the exact optical phase at which a pulsation-driven shock front emerges from the stellar photosphere (model phase 0.0) is unknown. In order to compare the results of our simulations with variability observations, we calibrate our results against the data for TX Cam in Sect. 4.1, point (v).
We now consider the points in Sect. 2.1 relating to long term variability and discuss how observed and calculated features correspond. Figure 3 shows, using the v=1 J=1-0 (43-GHz) maser as an example, how time series of maser spectra can be output from the variability simulations for transitions in the range v=1-3, J=1-0 up to and including J=10-9. These data may be combined to produce cycle-averaged spectra, as used by NO86, and these are shown in Fig. 4 for v=1, 43 and 86-GHz lineshape calculations. The variation of peak maser lineshape intensity as a function of stellar phase for 43 and 86 GHz masers is shown in Fig. 5.
(i) The general forms of the data in Figs. 3 and 4 are similar to those found in the most extensive data available (NO86, MBA88).
(ii) For much of the cycle, Fig. 5 shows that the peak
intensity of the 86-GHz masers is greater than
that of the 43-GHz masers at the corresponding epoch, as typically
observed for Miras (Pardo et al. 1998). During epochs
of bright maser emission (Epochs 13-20), the ratio of the peak lineshape
intensities, v=1 J=2-1/v=1 J=1-0 ![]() 1-3. Cho et al. (1998)
find a comparable typical value of
1-3. Cho et al. (1998)
find a comparable typical value of ![]() 1-2.
1-2.
(iii) In Alcolea et al. (1999), maser minimum
typically passes to maximum over ![]() 0.5 periods (i.e. the asymmetry factor
f is 0.5) for the v=1 43-GHz data. Our actual values are 0.35 and 0.3 stellar periods
for v=1 43-GHz and v=1 86-GHz masers respectively. However, within the typical
statistical uncertainties, given the number of emitting components contributing to the
lineshape at each phase, our data is consistent with observations. In Fig. 5,
maser minimum may occur between Epochs 7-11 and the maximum between Epochs 15-17.
0.5 periods (i.e. the asymmetry factor
f is 0.5) for the v=1 43-GHz data. Our actual values are 0.35 and 0.3 stellar periods
for v=1 43-GHz and v=1 86-GHz masers respectively. However, within the typical
statistical uncertainties, given the number of emitting components contributing to the
lineshape at each phase, our data is consistent with observations. In Fig. 5,
maser minimum may occur between Epochs 7-11 and the maximum between Epochs 15-17.
![\begin{figure}
\par\includegraphics[angle=-90,width=8.2cm,clip]{MS1648f4.ps}\end{figure}](/articles/aa/full/2002/16/aa1648/img41.gif) |
Figure 4: Cycle-averaged v=1 J=1-0 (43-GHz) and v=1 J=2-1 (86-GHz) SiO maser lineshapes generated from the model M-Mira. |
| Open with DEXTER | |
(iv) The FWHM of periods of bright simulated maser intensity are 0.2 periods for the 43-GHz masers and 0.25 for 86-GHz masers. These values underestimate observed values which lie in the approximate range 0.3-0.7 for the Miras in Alcolea et al. (1999).
(v) By equating the model phase of maser
minimum light with the observed
optical phase of 0.67 (Sect. 2.4) for the observations of v=1 43-GHz
masers in TX Cam, we derive the optical maximum of our model star to correspond
to a model phase of 0.78, i.e. Epoch 16-17. Maser
maximum for v=1 J=1-0 emission, which occurs at Epoch 17 (phase 0.85) in our simulations,
therefore peaks somewhere between the optical and IR peaks if the IR peak is
delayed by 0.1 periods with respect to its optical counterpart. The current model is
therefore not inconsistent with a small (<0.1 period) phase difference between low-frequency maser and IR peaks.
Although the mean observed phase lag between optical and maser maximum light
is ![]() 0.1-0.2, we noted in Sect. 2.1 (ii)
that this value is very variable between stars and between different
cycles of the same star. Indeed, for
some cycles of some of the stars studied in Alcolea et al. (1999),
for example R Cas and U Her, there is also negligible phase lag between stellar
and maser maxima.
0.1-0.2, we noted in Sect. 2.1 (ii)
that this value is very variable between stars and between different
cycles of the same star. Indeed, for
some cycles of some of the stars studied in Alcolea et al. (1999),
for example R Cas and U Her, there is also negligible phase lag between stellar
and maser maxima.
(vi) The contrast (ratio of maximum to minimum
peak lineshape intensity during the cycle) in our simulations is
175 at 43-GHz and 850 at 86-GHz. As the observed contrasts
are typically less than ![]() 10
10![]() of these values, this is a clear
failing of our simulations, though we note that very large contrasts
have been observed in o Cet (NO86): see Sect. 2.1.(v).
In Fig. 3
it is evident that maser emission is almost
eradicated between Epochs 6 to 11 (0.25 stellar periods). We
discuss the reasons why the model fails in this respect in Sect. 5.
of these values, this is a clear
failing of our simulations, though we note that very large contrasts
have been observed in o Cet (NO86): see Sect. 2.1.(v).
In Fig. 3
it is evident that maser emission is almost
eradicated between Epochs 6 to 11 (0.25 stellar periods). We
discuss the reasons why the model fails in this respect in Sect. 5.
![\begin{figure}
\par\includegraphics[angle=-90,width=8.2cm,clip]{MS1648f5.ps}\end{figure}](/articles/aa/full/2002/16/aa1648/img42.gif) |
Figure 5: Peak lineshape intensity "light curves'' for v=1 J=1-0 (43-GHz) and v=1 J=2-1 (86-GHz) synthetic spectra. The estimation of stellar optical maximum is described in Sect. 4.1, point (v). |
| Open with DEXTER | |
(vii) Figure 4 shows that the bulk of emission originates
from velocity extents of ![]() 12 km s-1, with broader low
intensity wings extending from around -15 to +15 km s-1, as observed
by Herpin et al.(1998).
Herpin et al.(1998) consider a number of processes which may give
rise to this emission, such as turbulence and asymmetric mass loss. Since
this CE model does not
include turbulence and is spherically symmetric, it appears that the wings can arise
simply through weak emission originating from regions of the CE which are infalling
or outflowing at relatively high velocity.
12 km s-1, with broader low
intensity wings extending from around -15 to +15 km s-1, as observed
by Herpin et al.(1998).
Herpin et al.(1998) consider a number of processes which may give
rise to this emission, such as turbulence and asymmetric mass loss. Since
this CE model does not
include turbulence and is spherically symmetric, it appears that the wings can arise
simply through weak emission originating from regions of the CE which are infalling
or outflowing at relatively high velocity.
(viii) The cycle-averaged peaks of both spectra in Fig. 4 occur close to the
stellar velocity, peaking 0.3 km s-1 to the blue of V*.
The cycle-averaged
spectral peak at v=1, J=1-0 was 0.3 km s-1 to the red of V* in
Cho et al. (1996), compared
to the blueshift of ![]() 1 km s-1 found by NO86.
Adopting the data calibration in (v), we find that in our simulated data
v=1 J=1-0 emission is redshifted with respect to V* for an optical phase range
of 0.73-0.98 and blue-shifted from 0.23-0.63. This does not agree with
the statistical result of Cho et al. (1996) in Sect. 2 (vi).
1 km s-1 found by NO86.
Adopting the data calibration in (v), we find that in our simulated data
v=1 J=1-0 emission is redshifted with respect to V* for an optical phase range
of 0.73-0.98 and blue-shifted from 0.23-0.63. This does not agree with
the statistical result of Cho et al. (1996) in Sect. 2 (vi).
![\begin{figure}
\par\includegraphics[width=17cm,clip]{MS1648f6.ps}\end{figure}](/articles/aa/full/2002/16/aa1648/img43.gif) |
Figure 6:
Time series of v=1 J=1-0 (43-GHz) synthetic maser images. The vertical axis
is the log of the velocity-integrated maser intensity,
|
| Open with DEXTER | |
The present model cannot deal with the very short term variability
of a few days or less reported in Pijpers et al.(1994),
which the authors attribute to short wavelength sound waves generated
through convection, a phenomenon not included in the present stellar
pulsation model (see Pijpers & Hearn 1989). However
conditions in the CE do change significantly between model epochs,
on timescales of ![]() 17 days.
This is clearly illustrated by Figs. 3 and 5.
17 days.
This is clearly illustrated by Figs. 3 and 5.
H96 showed that masers at model phase zero (Epoch 1) were disposed in an
approximate ring around the host star at a radius of ![]() 1 R*
from the photosphere.
The present work shows that this ring expands, contracts, undergoes severe disruption and
reappears according to the stellar phase.
Figure 6 shows the time series of synthetic images resulting
from our simulations at 43-GHz, which can be displayed for any transition.
The interval between
epochs in Fig. 6 is 16.6 days, corresponding
to 0.05 stellar periods. The choice of 1500 maser sites in order to generate
these images was based on numerical experiments at Epoch 1. It would now appear
that a smaller number might have been more appropriate, since the ring
structures in Epochs 14-18 are rather more complete than observations
(of TX Cam) currently suggest.
Figure 7 shows a VLBA image
of the 43-GHz masers in TX Cam, for comparison with our simulated data.
Figure 8 shows maser ring radii for 43 and 86-GHz masers
as a function of the stellar pulsation phase.
At all events a number of useful conclusions
can be drawn from these data.
1 R*
from the photosphere.
The present work shows that this ring expands, contracts, undergoes severe disruption and
reappears according to the stellar phase.
Figure 6 shows the time series of synthetic images resulting
from our simulations at 43-GHz, which can be displayed for any transition.
The interval between
epochs in Fig. 6 is 16.6 days, corresponding
to 0.05 stellar periods. The choice of 1500 maser sites in order to generate
these images was based on numerical experiments at Epoch 1. It would now appear
that a smaller number might have been more appropriate, since the ring
structures in Epochs 14-18 are rather more complete than observations
(of TX Cam) currently suggest.
Figure 7 shows a VLBA image
of the 43-GHz masers in TX Cam, for comparison with our simulated data.
Figure 8 shows maser ring radii for 43 and 86-GHz masers
as a function of the stellar pulsation phase.
At all events a number of useful conclusions
can be drawn from these data.
(i) In Fig. 6, it is evident that tangential amplification is the norm, but that an occasional feature may form over the disk of the star, as at Epoch 17 at 43-GHz. Data for TX Cam indeed show that an occasional maser spot may form over the disk of the star, as shown in Fig. 7.
(ii) The radius of the 43-GHz "ring'' of masers varies between 1.93-2.3 AU in Fig. 8. The average radius of the maser ring declines between Epochs 1-6, at a mean rate of 0.2 AU in 83 days, corresponding to 4.2 km s-1 (cf. infall of 4 km s-1 in R Aqr over a similar duration of the stellar cycle). Contraction of the ring is followed by a larger shock-driven expansion at a rate of 3.2 km s-1 (cf. dominant expansion in the TX Cam observations, at a typical velocity of 3.65 km s-1). In our simulations, expansion of the ring is accompanied by a period of bright maser emission, induced by the temperature and density enhancements of the post-shock gas.
(iii) The radius of the v=1 86-GHz ring of masers is consistently similar, to within 0.1 AU, to that of the v=1 43-GHz ring throughout the stellar cycle. Gray & Humphreys (2000) show that this is not the case for masers in different vibrational states. The radial motions of the rings are highly coupled as bright v=1, 43 and 86-GHz maser emission often originates from shared components in the CE. This is supported by observational data of Colomer et al. (1996) and Doeleman et al. (1998), although their multi-transition results were not made simultaneously.
![\begin{figure}
\par\includegraphics[width=8.5cm,clip]{MS1648f7.ps}\end{figure}](/articles/aa/full/2002/16/aa1648/img44.gif) |
Figure 7:
A spectrally-averaged VLBA |
| Open with DEXTER | |
(iv) More sites in the CE produce
maser emission at 43-GHz (16![]() of the 1500 sites at Epoch 15) than at
86-GHz (7.5
of the 1500 sites at Epoch 15) than at
86-GHz (7.5![]() at the same epoch). However, of the components which do emit,
v=1 J=2-1 emission is typically
significantly stronger than that of at v=1 J=1-0, leading to the more
intense images and lineshapes in our data. (There is a general
trend in our data for fewer emitting components as a function of increasing
J-value for the transition.) It is not clear why the v=1 J=2-1 should be the stronger.
Results in D95 also suggested that 43 and 86-GHz emission in v=1 form under similar
conditions. As discussed in D95, competition betwen masers and cycling of
populations between the v=1 and 2 and J=1 and 2 states result in a complicated
interplay whose outcome determines whether the 43 or 86-GHz line will emerge as
a strong maser.
at the same epoch). However, of the components which do emit,
v=1 J=2-1 emission is typically
significantly stronger than that of at v=1 J=1-0, leading to the more
intense images and lineshapes in our data. (There is a general
trend in our data for fewer emitting components as a function of increasing
J-value for the transition.) It is not clear why the v=1 J=2-1 should be the stronger.
Results in D95 also suggested that 43 and 86-GHz emission in v=1 form under similar
conditions. As discussed in D95, competition betwen masers and cycling of
populations between the v=1 and 2 and J=1 and 2 states result in a complicated
interplay whose outcome determines whether the 43 or 86-GHz line will emerge as
a strong maser.
(v) In our simulated data, the passage of a shock front through the maser zone causes minimum maser light. The combination of physical conditions in the zone are unsuitable for yielding bright maser emission, in particular, the high temperatures which dissociate SiO. Although temperatures in real stars are unlikely to be as high as in this model, we believe that the general picture provided here is the correct one. That is to say a shock front disrupts the existing maser ring and new features then form in the gas in the wake of the shock i.e. a new maser ring will appear to form which has a smaller angular extent than the previous ring.
![\begin{figure}
\par\includegraphics[angle=-90,width=8.8cm,clip]{MS1648f8.ps}\end{figure}](/articles/aa/full/2002/16/aa1648/img45.gif) |
Figure 8: Mean ring radius for v=1 J=1-0 (43-GHz) and v=1 J=2-1 (86-GHz) masers, generated by the model M-Mira variable, as a function of stellar phase. The ring radius is determined by taking the average radius over the fifty brightest components at each epoch. The uncertainty in these values is typically about 0.13 AU. |
| Open with DEXTER | |
These simulations have some rather severe limitations, which we discuss below. However, a significant conclusion of the present work is that coupling a SiO maser model to a pulsating AGB stellar model, keeping the stellar IR radiation field constant throughout the cycle, reproduces qualitatively much of the available observational data. This is particularly evident in the location, tangential amplification and proper motion of SiO masers (although clearly our spherically symmetric model will not reproduce asymmetrical effects) in the CE. The essential point is that shocks in the inner CE have an effect on SiO maser emission which, given the lack of time-dependent chemistry and efficient molecular cooling in our present simulations, could explain much of the SiO maser variability phenomenon. Of course the inclusion of a varying stellar IR radiation field, in addition to the improvements outlined above, is essential for modelling fully the environments provided by such stars. We note that it is not yet established whether SiO masers are predominantly radiatively or collisionally pumped.
A number of important quantitative shortcomings are evident in our simulations, which may be summarised as follows. The duration of the period of bright maser emission is underestimated, the contrast in the maser lightcurve is overestimated, maser emission is very weak for a significant portion of the stellar cycle and in observed data, red-shifted emission dominates for the greater portion of the stellar cycle, whereas in the simulated data blue-shifted emission dominates. In this discussion we should recall that the model parameters set out in Table 1 are appropriate to o Ceti, and these represent an arbitrary choice which may not necessarily yield the behaviour which may be characterised as "typical'' of M-Miras.
An important problem remains the difficulty in relating accurately
the phase of our model star to stellar optical phase. As we have stated, the current
hydrodynamic model is not really capable of deciding this issue because it has a
fixed-temperature photosphere. VLBI observations, however, are at present consistent
with the view that the shock wave in the envelope arrives at the maser zone in a
reasonably well-constrained phase range for a group of objects with very different
stellar parameters. Assuming that the observed maser ring in a VLBI experiment corresponds
well to the radius of the shock at the time the shock impacts the maser zone - as is
the case in our model - we deduce from the five stars in Table 2, that the mean phase,
![]() of shock arrival is 0.71 in the modellers' definition, with a standard deviation on the
mean,
of shock arrival is 0.71 in the modellers' definition, with a standard deviation on the
mean,
![]() ,
equal to only 0.029
periods.
In the case of R Cas, Phillips et al. (2001)
give sufficient data to make a reasonable estimate of the root-mean-square
uncertainty in the time required for the shock to reach the maser
zone. The error in the angular
measure is dominated by the uncertainty in the stellar diameter, quoted as
30
,
equal to only 0.029
periods.
In the case of R Cas, Phillips et al. (2001)
give sufficient data to make a reasonable estimate of the root-mean-square
uncertainty in the time required for the shock to reach the maser
zone. The error in the angular
measure is dominated by the uncertainty in the stellar diameter, quoted as
30 ![]() 6 mas. The fractional error in the angular distance to be crossed
by a shock travelling to the maser ring, of diameter 57 mas, is
therefore 6/27 = 0.22. To this we add the fractional error in the distance
to R Cas, about 0.2 from the authors' figures, to get 0.44. This level of
uncertainty is certainly large,
but we are basing our results on a group of five, not on a single source.
Assuming that 0.44 is a reasonable fractional error for all five objects,
we obtain a root-mean-square uncertainty on the mean for the five objects
in Table 2 of 0.15 periods. This is certainly larger than the standard
deviation on the mean, but is still usefully restrictive.
This information is quite independent of any assumed pumping scheme, as it is based
only on observation.
Given that most objects have a roughly fixed delay from shock impact to maser maximum, and
a further constant phase shift links the modellers' and optical phase definitions
(see Sect. 4.1.5) then we expect a fairly constant phase shift between the peaks
of the optical
(or IR) light curves and the maser peak. Observationally, this shift is close to 0.0
in the IR case for most, but not all objects. This link would be quite natural if the
shock and IR photosphere are dynamically linked in many objects. Such a link is plausible
because much of the opacity in the 3-10
6 mas. The fractional error in the angular distance to be crossed
by a shock travelling to the maser ring, of diameter 57 mas, is
therefore 6/27 = 0.22. To this we add the fractional error in the distance
to R Cas, about 0.2 from the authors' figures, to get 0.44. This level of
uncertainty is certainly large,
but we are basing our results on a group of five, not on a single source.
Assuming that 0.44 is a reasonable fractional error for all five objects,
we obtain a root-mean-square uncertainty on the mean for the five objects
in Table 2 of 0.15 periods. This is certainly larger than the standard
deviation on the mean, but is still usefully restrictive.
This information is quite independent of any assumed pumping scheme, as it is based
only on observation.
Given that most objects have a roughly fixed delay from shock impact to maser maximum, and
a further constant phase shift links the modellers' and optical phase definitions
(see Sect. 4.1.5) then we expect a fairly constant phase shift between the peaks
of the optical
(or IR) light curves and the maser peak. Observationally, this shift is close to 0.0
in the IR case for most, but not all objects. This link would be quite natural if the
shock and IR photosphere are dynamically linked in many objects. Such a link is plausible
because much of the opacity in the 3-10 ![]() m range is derived from water molecules.
The shock would provide a dense layer which could be optically thick for part of the
stellar cycle. Observational support for this view comes from observations by
Yamamura et al. (1999) who found that the warmer of two water layers, located
at around two nominal stellar radii in o Cet was optically thick. The high temperature
suggests the layer is shock-heated, and the mid-IR photosphere would therefore lie
somewhere in the post-shock gas.
m range is derived from water molecules.
The shock would provide a dense layer which could be optically thick for part of the
stellar cycle. Observational support for this view comes from observations by
Yamamura et al. (1999) who found that the warmer of two water layers, located
at around two nominal stellar radii in o Cet was optically thick. The high temperature
suggests the layer is shock-heated, and the mid-IR photosphere would therefore lie
somewhere in the post-shock gas.
| Approximate Phases of Shock Arrival | ||||
| Object |
|
R* (AU) | P (d) | Phase |
| U Her1 | 4.3 | 2.4 | 455 | 0.65 |
| TX Cam2 | 4.9 | 1.8 | 557 | 0.77 |
| IRC+100113 | 5.5 | 1.8 | 650 | 0.79 |
| R Aqr4 | 3.0 | 1.14 | 387 | 0.66 |
| R Cas5 | 4.56 | 2.4 | 430 | 0.69 |
A significant source of error in these calculations is likely to be the lack of molecular coolants such as CO in this model. The shocks in the present work (see Fig. 1a) are quite close to being adiabatic. The effect of coolants, such as CO is not included and cooling of the shocks in the present model takes place broadly on the hydrodynamic timescale. This timescale depends on the phase of the star and lies in the approximate range of 60-100 days. If the effects of cooling by CO are included (Cuntz & Muchmore 1994; Woitke et al. 1996), the shocks cool on a radiative timescale of only 1-2 days and the shocks are much closer to isothermality than those used in the present work. This means that SiO maser emission would not be severely weakened for a large portion of the stellar cycle, as it is in the current work, partly due to the dissociation of SiO. We would therefore expect more accurate shock conditions, and possibly time-varying IR radiation, to reduce the maser dynamic range from the high levels found in the simulations. Time-dependent chemistry is also a requirement for providing the abundance of SiO and of other coolant species.
A number of the discrepancies mentioned above may also arise from the use of a spherical
pulsation model. This yields too clean-cut behaviour of the CE. Variations in the
physical conditions in the CE almost certainly do not take place in the same manner
equally in all directions. Moreover clumping of material (Sect. 4.1)
due to thermal
instabilities is inherently spatially inhomogeneous. Given non-spherical behaviour
(Sect. 2.4), the CE at any one phase of stellar pulsation will
exhibit a spread of physical conditions for any given radius, rather than the unique
set used here. This will increase the duration of bright emission and reduce the contrast
between maximum and minimum maser brightness. In this connection the VLBA data on TX Cam
at a variety of phases show that the entire maser ring never fades away in its entirety
as our present models suggest (Diamond, private communication). The rings wax and wane in
intensity but ![]() 50% of the ring generally remains visible. An example of a prediction
of the model that is verified by observations of maps at different stellar phases is
that maser emission is not exclusively tangential and that an occasional maser spot
may indeed be found over the disk of the host star, as we predict.
50% of the ring generally remains visible. An example of a prediction
of the model that is verified by observations of maps at different stellar phases is
that maser emission is not exclusively tangential and that an occasional maser spot
may indeed be found over the disk of the host star, as we predict.
To improve our understanding of the extended atmospheres of AGB stars, the following are
necessary. The relationship between the optical and model phases should be reliably fixed
by a combination of interferometry observations and theory. The hydrodynamic pulsation
model should in future incorporate a varying IR radiation field, which in turn requires
the hydrodynamic model to incorporate an accurate prediction of the radius of the IR photosphere as any phase. Additionally, we require
some chemical modelling of SiO formation, of the H,
H2
balance and of coolant molecules such as CO and H2O. As noted above, this is
significant in determining the radiative timescale for cooling of the shocks in the CE.
Chemical modelling also has implications both for the relative amplification factors at
different phases and for the nature of the collisional pumping mechanism, since H and
H2 have significantly different rate coefficients for rotationally and
rovibrationally inelastic collisions with SiO in the new calculations by
Jimeno et al. (1999). In addition,
a time-dependent description of silicate, that is, olivine dust formation
should be introduced, noting that dust formation also affects the local thermal
balance. At present, the importance of including magnetic field effects in the CE is unclear.
With respect to the maser model,
accelerated lambda iteration methods should be used to replace LVG
(Jones et al. 1994; Randell et al. 1995; Yates et al. 1997).
Accelerated lambda iteration methods
have the important characteristic that they can incorporate the velocity,
temperature and number density structure of the CE explicitly into the calculation
of the populations of SiO rovibrational levels. These methods require development
for a spherical geometry for molecular systems and are computationally expensive,
though not prohibitively. New rate coefficients for collisional energy transfer between
H2 and SiO must also be computed. The outstanding observational
requirement is for more sets of VLBI images disposed at equal intervals of ![]() 0.1
in phase (near-)simultaneously for several SiO maser transitions towards suitable
Mira long-period variables.
0.1
in phase (near-)simultaneously for several SiO maser transitions towards suitable
Mira long-period variables.
Acknowledgements
EMLH thanks the Swedish Foundation for International Co-operation in Science (STINT) for the financial support of this project. DF would like to thank the Aarhus Centre for Atomic Physics (ACAP) for support during the period of this work.