A&A 385, 1073-1077 (2002)
DOI: 10.1051/0004-6361:20020151
Intermittent behavior in the transition
region and the low corona of the quiet Sun
S. Patsourakos1,2 - J.-C. Vial3
1 - US Naval Research Laboratory, Space Science Division,
Washington, DC 20375, USA
2 -
Mullard Space Science Laboratory,
University College London,
Holmbury St Mary, Dorking, Surrey,
RH5 6NT, UK
3 - Institut d'Astrophysique Spatiale, Université Paris XI - CNRS,
Bât. 121, 91405 Orsay Cedex, France
Received 12 June 2001 / Accepted 24 January 2002
Abstract
We present an analysis of light-curves
obtained in the O IV
and Ne VIII
transition region and low
corona lines, that were simultaneously
recorded in a quiet Sun region by SUMER/SOHO.
By using the flatness spectrum of
the observed light-curves we searched
for intermittency signatures.
It was found that a significant proportion of
points in the observed area exhibit
clear indications of intermittency,
irrespectively of their intrinsic
intensity. Our findings give favor
to an impulsively heated transition region
and corona via intermittent-type MHD
turbulence.
Key words: Sun: corona - Sun: transition region - Sun: UV radiation
A widely-accepted
solution to the coronal heating problem remains still elusive
even though considerable theoretical and observational
effort has been and is still being made. One of the main-stream
schools for coronal heating
asserts that the heating has an impulsive nature
in time and space and results from a swarm of nanoflares
(e.g. Parker 1988).
Searching for signatures of coronal heating
processes in emissions formed under transition region (TR)
and lower
corona conditions could be advantageous
because the effects of rapid variations
originally taking place in the corona can be more easily detected
in the TR given its smaller than the corona
spatial scales and the relatively small reaction times of
TR plasmas to changes of their thermodynamic properties.
Hence the TR and the low corona may be
quite often viewed as a gauge of the activity taking
place in the corona.
A common characteristic of a number of models
which build on the idea of a nanoflare-heated corona,
is the onset of an intermittent spatio-temporal behavior
(e.g.,
Galsgaard & Nordlund 1996;
Einaudi et al. 1996;
Georgoulis et al. 1998;
Dmitruk & Gomez 1999; Galtier 1999).
As such, it is very important to search for signatures
of intermittency in signals from the TR and low corona,
to get insight into coronal and TR
heating. We are fortunate to pursue
such studies now, since very high quality
space-borne observations are currently been available.
It is indeed the
aim of the present paper to search for
signatures
of intermittency
in high temporal and spatial resolution
time-series of transition region and lower corona
spectral lines intensities. This paper is organized as
follows: in Sect. 2 we describe our observations
and data while Sect. 3 is dedicated to a description
of the tools used to search for intermittency
signatures. Finally,
in Sect. 4 we discuss our results and give our conclusions.
![\begin{figure}
\par\includegraphics[width=9cm,clip]{3367f1.eps}\end{figure}](/articles/aa/full/2002/15/aah3367/Timg1.gif) |
Figure 1:
Time-"solar-y'' diagrams for a) the O IV
intensity (top panel, logarithmic scaling in intensity)
b) the O IV
intensity which has been
normalized by the minimum value
of the light-curve at each spatial pixel (middle panel, linear scaling in
intensity) and c) O IV sample light-curve for
spatial pixel 100 along the slit (bottom panel). |
| Open with DEXTER |
Observations were made using the SUMER spectrometer
on SOHO (Wilhelm et al. 1995; Wilhelm et al. 1997;
Lemaire et al. 1997) on 8 February
1998 in a quiet Sun region around the Sun center.
A
 entrance-slit,
with a pixel size of about 1 arcsec along the slit
was used,
and spectral windows 50 pixels wide
(to ensure that the
full line plus some continuum were
obtained) centered in the O IV lines at
787.7 and 790.2 Å and
the Ne VIII lines at 770.4 and 780.3 Å
were extracted every 35 s.
The solar rotation was compensated
every 143 s by moving
the slit
to the west
with
entrance-slit,
with a pixel size of about 1 arcsec along the slit
was used,
and spectral windows 50 pixels wide
(to ensure that the
full line plus some continuum were
obtained) centered in the O IV lines at
787.7 and 790.2 Å and
the Ne VIII lines at 770.4 and 780.3 Å
were extracted every 35 s.
The solar rotation was compensated
every 143 s by moving
the slit
to the west
with
 steps.
Thus the same region on the Sun was observed for
a total duration of 7.6 hours.
steps.
Thus the same region on the Sun was observed for
a total duration of 7.6 hours.
We first applied standard
corrections to the raw data including
flat-fielding, destretching, removal
of the local gain depression and correction
for non-linearities in the instrument response in order
to get rid of a number of instrumental
peculiarities (Wilhelm et al. 1997). By
integrating
over the
line profiles (after a background was
subtracted) we produced light-curves for
each point along the slit. For our analysis
we focus on the O IV and Ne VIII
lines at 790.2 and 770.4 Å
since they are brighter than the other
O IV and Ne VIII lines, for
ensuring an exploitable signal-to-noise ratio.
These two lines
offer a good temperature coverage of the transition
region and the lower corona since they have formation
temperatures of
 and
and
 K correspondingly.
For our analysis we use a 235 pixels long
portion of the slit.
K correspondingly.
For our analysis we use a 235 pixels long
portion of the slit.
An example of the obtained light-curves is given in Fig. 1
for O IV.
Along the slit
one can observe (Fig. 1, top panel)
an alternation of bright and dark portions
reminiscent of network and cell elements which roughly
speaking preserve
their identity during the duration of our observations.
We can note the existence of intensity bursts that are unevenly
spaced in time.
The above remark can be better evidenced in the middle panel of
Fig. 1 where we plot the
light-curves
normalized to their minimum values
in order to better visualize such bursts
irrespectively to their intrinsic
intensity. It can be seen that
these bursts seem to occur both in dark and bright regions.
Finally, we show (bottom panel of Fig. 1)
a sample light-curve at a point selected randomnly alon the slit.
We can readily note the existence of spikes in the above time-series
all over its duration.
The above behavior is indicative of
intermittency with switches between bursts
and quiescent phases taking place randomly in time.
In order to materialize the hints
for intermittency we had in the previous
section, a more rigorous analysis method
is needed. A standard tool to infer
for intermittency is the
flatness spectrum of the
examined signal (Frisch 1995).
Following Frisch (1995) we can define
the flatness  (fourth order) spectrum
of a high-pass filtered version
(fourth order) spectrum
of a high-pass filtered version
 of the initial light-curve i(t)
corresponding to a temporal scale
of the initial light-curve i(t)
corresponding to a temporal scale  as:
as:
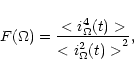 |
(1) |
where the brackets denote averaging over the duration
of the light-curve and t is the time. For building a
version of the original light-curves
at each spatial scale been selected,
we applied
a wavelet transform
to
the original light-curves
(e.g., Farge 1992). Such a transform can be viewed
as a generalization of the Fourier transform,
where a filter (here the wavelet) with an adjustable resolution
is applied to the data. Because of
their localising properties both in time and
temporal scale, wavelet transforms are particulary suitable for
analysing signals rapidly varying in time
(e.g., Lawrence et al. 1999). We note here that the wavelet filter does not
act the same way as a high-pass filter does, since it
isolates features at the selected scale rather than selecting
all the features that are larger than the selected scale.
The wavelet acts as a magnifying lens,
enhancing features comparable to
its resolution (for our case the
selected temporal scale).
For our case it is sufficient to use the
simplest wavelet: the Haar. For
a given temporal scale
the Haar wavelet
is defined as a filter function
which equals to - 1 in the interval
 ,
1 in the interval
,
1 in the interval
 and 0 otherwise.
In the following we should keep in mind
that a Gaussian signal has a constant
with the temporal scale flatness spectrum, with a value of 3
(Frisch 1995).
On the other hand an intermittent signal is characterized by
a flatness spectrum with values larger
than the Gaussian value.
and 0 otherwise.
In the following we should keep in mind
that a Gaussian signal has a constant
with the temporal scale flatness spectrum, with a value of 3
(Frisch 1995).
On the other hand an intermittent signal is characterized by
a flatness spectrum with values larger
than the Gaussian value.
The flatness spectrum analysis,
as a probe of intermittent behavior
both in space and time,
has been extensively used in a great number
of problems including
turbulent flows (e.g., Frisch 1995 and references
within), solar sunspot number (Lawrence et al. 1995), photospheric flow fields
(Lawrence et al. 1999)
magnetic and kinetic energy
as well as the dissipation rate of modeled coronal
loops (Dmitruk et al. 1998),
and solar wind magnetic field and velocity fluctuations
(Bruno et al. 1999).
The temporal flatness spectrum
for the O IV line is
presented
in Fig. 2 (top panel).
It can be seen that a very significant fraction
of the observed region,
for temporal scales from 35 min down to around
1 min (the smallest temporal scale
we can access because of the temporal resolution
of our observations), has larger than 3 value
of the corresponding flatness spectrum and thus
they are in an intermittent state.
Moreover almost the whole observed region
exhibits is an intermittent state
at temporal scales smaller than
5 min.
The
flatness spectrum does not consist
of points randomly scattered in the
spatial position - temporal scale space;
rather they are organized as vertical (to
the spatial position) spikes. These spikes
typically have a width of  5 arcsec
and are characterized by a decrease of the
value of the flatness spectrum
with the temporal scale. The latter
is a typical property of intermittent activity
which is more pronounced at small temporal
scales. We can finally note that
those spikes do not preferentially
lie in a particular kind
of spatial structure (see the upper and
the bottom panel of Fig. 2); they
can be found either in bright or dark portions
along the slit which could correspond to network
and cell. Thus we may
conclude that the intermittency is a common characteristic
of the different structures found in the transition region,
irrespectively of their intensity.
We found basically the same behavior in the Ne VIII line.
However in the Ne VIII flatness spectrum
the
spikes are somehow
less and do not always coincide
with their equivalents in O IV. This can be explained
by a "localization'',
in a very restricted temperature band,
of the processes behind the intermittent activity.
Another possibility can be the smaller
radiative times in O IV than in Ne VIII.
In order to better visualize the behavior of the intermittency
throughout the totality of the observed field,
we present in Fig. 3 the spatially-averaged
temporal flatness spectra for O IV and Ne VIII.
In both lines the flatness increases with decreasing
temporal scale, although we can witness (as already been made
above), that in Ne VIII the intermittence is significantly
not as strong as in O IV.
Let us note here that we found that
Fourier high-pass filtering and other types of
wavelets (Mexican Hat and Morlet; see Torrence
5 arcsec
and are characterized by a decrease of the
value of the flatness spectrum
with the temporal scale. The latter
is a typical property of intermittent activity
which is more pronounced at small temporal
scales. We can finally note that
those spikes do not preferentially
lie in a particular kind
of spatial structure (see the upper and
the bottom panel of Fig. 2); they
can be found either in bright or dark portions
along the slit which could correspond to network
and cell. Thus we may
conclude that the intermittency is a common characteristic
of the different structures found in the transition region,
irrespectively of their intensity.
We found basically the same behavior in the Ne VIII line.
However in the Ne VIII flatness spectrum
the
spikes are somehow
less and do not always coincide
with their equivalents in O IV. This can be explained
by a "localization'',
in a very restricted temperature band,
of the processes behind the intermittent activity.
Another possibility can be the smaller
radiative times in O IV than in Ne VIII.
In order to better visualize the behavior of the intermittency
throughout the totality of the observed field,
we present in Fig. 3 the spatially-averaged
temporal flatness spectra for O IV and Ne VIII.
In both lines the flatness increases with decreasing
temporal scale, although we can witness (as already been made
above), that in Ne VIII the intermittence is significantly
not as strong as in O IV.
Let us note here that we found that
Fourier high-pass filtering and other types of
wavelets (Mexican Hat and Morlet; see Torrence  Compo
1998) also provide a decreasing flatness with temporal scale.
By a series of Monte-Carlo simulations we found that instrumental
effects such as flat-field and photon counting noise
as well as pointing jitter do not have a significant bearing on the derived
flatness spectra (we found a mean difference of 0.003 between the simulated
and the derived from the observations flatness spectra).
Compo
1998) also provide a decreasing flatness with temporal scale.
By a series of Monte-Carlo simulations we found that instrumental
effects such as flat-field and photon counting noise
as well as pointing jitter do not have a significant bearing on the derived
flatness spectra (we found a mean difference of 0.003 between the simulated
and the derived from the observations flatness spectra).
![\begin{figure}
\par\includegraphics[width=6.8cm,clip]{3367f2.eps}\end{figure}](/articles/aa/full/2002/15/aah3367/Timg14.gif) |
Figure 2:
Temporal flatness spectrum of the O IV line intensity
along the slit
(top panel-logarithmic scaling).
The horizontal color-bar corresponds to the logarithm of
the flatness.
The overplotted contours indicate points with flatness below 3.
Time-averaged O IV intensity
along the slit (bottom panel). |
| Open with DEXTER |
![\begin{figure}
\par\includegraphics[width=8.8cm,clip]{3367f4.eps}\end{figure}](/articles/aa/full/2002/15/aah3367/Timg15.gif) |
Figure 3:
Spatially averaged temporal flatness spectra for O IV (continuous line)
and for Ne VIII (dashed line). |
| Open with DEXTER |
The main result of this work is that
intermittent activity is quite
ubiquitous throughout the TR
of the quiet Sun and in
fact increases when the time scales under consideration
get smaller and smaller.
This lends considerable support to a series
of theoretic models of coronal heating
(see the references in the introduction)
which find
their route to the Parker's nanoflare heated corona
via MHD turbulence. All these
models lead to an intermittent behavior
in the time-variation of a number of physical
parameters including the dissipated energy.
The radiative losses are related to the
dissipated
energy since one part of it is lost as radiation.
Thus,
we should expect a correlation
between the observed line intensities and the dissipated energy
and consequently intermittent bursts
in the observed light-curves, even though a smoothing may
be expected in the observed light-curves due to the limited
(and not infinitely small)
time it takes a plasma to react to modifications
of its thermodynamic properties by radiation.
Such bursts could be related
to well-known types of transient events
such as explosive events (e.g., Dere et al. 1987; Innes et al. 1997;
Patsourakos
Vial
2001), microflares
(e.g., Porter et al. 1987), blinkers (e.g., Harrison 1997)
etc.,
with however the above events
been presumably just the "tip of the iceberg'' of a whole hierarchy of
events (e.g., Parker 1988)
that are currently non-resolved by our instrumentation, given also
the fact that such events are not too numerous to account for the
almost omni-present observed intermittency.
Another point which deserves some comment here is the fact
that the models above
are originally intended to model
large scale coronal loops. However we can assert that
they could be applied also to the quiet Sun, via the
interaction of small loops in the
frame of the "magnetic carpet'' concept (Schrijver et al. 1997)
for example (see also the relevant discussion in Aletti et al. 2000).
It is just the macroscopic spatial scales
of the structures involved which are different: the
underlying physical processes could be the same.
It is very tempting to draw a link between these small
loops and the spikes observed in the flatness
spectrum.
What it is really needed from MHD turbulence models
is that they could be
able to cope with the plasma local thermodynamics,
in order to reproduce the spectral emission of the plasma
which provides a common ground for comparisons between
observations and models.
We note that most of MHD turbulence
simulations assume incompressibility which by definition
does not cater for variations of local thermodynamic parameters
(i.e., density and temperature) which are essential elements
for determining the radiative signatures of the plasma.
Some first steps
trying to reconcile this deficiency,
have been taken
for a number of simplistic cases by Walsh
Galtier (2000).
Very interestingly these authors found, that for
some of the cases they considered, bursts appear
in both the plasma temperature and density
as it was anticipated above. These bursts result from
intermittent energy release followed by its dissipation. To note
here that the bursts in the dissipated energy are by far more
stronger in magnitude than the bursts in density and temperature,
which may make feasible
the observational detection only for the stronger among them.
Our results are broadly consistent with
the work of Aletti et al. (2000).
These authors
found that the intensity distributions
of the quiet Sun coronal snapshot images they analyzed,
show departures
from Gaussianity at large intensities even with
a degraded spatial resolution. They
interpreted
the above findings as
suggestive of a forced turbulent system characterized
by an intermittent behavior,
having dissipation scales much more smaller than the spatial resolution.
The relevance of an MHD turbulence regime
in the quiet Sun has also been demonstrated in two
recent articles by Berghmans et al. (1998)
and by Chae et al. (1998) by totally independent
means than ours.
They analyzed
respectively
temporal/spatial intensity power spectra
and non-thermal velocities in the quiet Sun
and found that they are consistent with predictions from
MHD turbulence theory.
As a matter of fact, our findings
in favor of intermittent MHD turbulence could have a significant bearing
on the way that observational
data are investigated for scaling properties
(e.g., exponents)
of MHD turbulence. Higher
order than 2 (power spectrum) moments
may need to be considered.
What is clearly needed for the
future is on the one hand a more
realistic coupling between heating and the
hydrodynamics and
on the other hand an extension of our study
to other structures (e.g. active regions)
and to bi-dimensional spatial fields seeking for
spatio-temporal intermittency in 2-D.
Acknowledgements
S. Patsourakos acknowledges
post-doctoral support by the PPARC.
The research of S. Patsourakos was supported in part by NASA and ONR.
We would like to thank the referee, Dr. L. Milano
for his comments/suggestions that helped to improve this paper.
The authors wish to thank S. Galtier, M. Georgoulis,
U. Frisch, P. Lemaire, A. Mangeney and M. Velli
for very useful and enlightening
discussions during the course of this work.
The SUMER project is financially supported by DLR, CNES, NASA and the ESA
Prodex programme (Swiss contribution). SOHO is a mission of international
cooperation between ESA and NASA.
Wavelet software was provided by C. Torrence and G. Compo, and is available at URL:
http://paos.colorado.edu/research/wavelets.
- Aletti, V., Velli, M., Bocchialini, K., et al.
2000, ApJ, 544, 550
In the text
NASA ADS
- Berghmans, D., Clette, F.,
Moses, D. 1998,
A&A, 336, 1039
In the text
NASA ADS
- Bruno, R., Bavassano, B., Pietropaolo, E., et al.
1999, GRL, 26, 3185
In the text
- Chae, J., Schühle, U.,
Lemaire, P. 1998, ApJ, 505, 957
In the text
NASA ADS
- Dere, K. P., Bartoe, J.-D. F.,
Brueckner, G. E., et al. 1987,
Sol. Phys., 114, 223
In the text
NASA ADS
- Dmitruk, P., Gomez, D.,
DeLuca, E. E. 1998, ApJ, 505, 974
In the text
NASA ADS
- Farge, M. 1992, Ann. Rev. Fluid Mech.,
24, 395
In the text
NASA ADS
- Frisch, U. 1995, Turbulence (Cambridge University Press)
In the text
- Galsgaard, K.,
Nordlund, A. 1996, J.
Geophys. Res., 101, 13445
In the text
- Galtier, S. 1999, ApJ, 521, 483
In the text
NASA ADS
- Georgoulis, M. K., Velli, M., Einaudi, G. 1998, ApJ, 497, 957
In the text
NASA ADS
- Einaudi, G., Velli, M., Politano, H., Pouquet, A. 1996, ApJ, 457, L113
In the text
NASA ADS
- Harrison, R. A. 1997, Sol. Phys., 175, 467
In the text
NASA ADS
- Innes, D. E., Inhester, B.,
Axford, W. I.,
Wilhelm, K. 1997, Nature, 386, 811
In the text
- Lawrence, J. K., Cadavid, A. C., Ruzmaikin, A. A. 1995, ApJ, 455, 366
In the text
NASA ADS
- Lawrence, J. K., Cadavid, A. C., Ruzmaikin, A. 1999, ApJ, 513, 506
In the text
NASA ADS
- Lemaire, P., Wilhelm, K., Curdt, W., et al.
1997, Sol. Phys., 170, 105
In the text
NASA ADS
- Parker, E. N. 1988, ApJ, 330, 474
In the text
NASA ADS
- Patsourakos, S.,
Vial, J.-C. 2001,
Sol. Phys., 203, 39
In the text
NASA ADS
- Porter, J. G., Moore, R. L., Reichmann, E. J.,
et al.
1987, ApJ, 323, 380
In the text
NASA ADS
- Schrijver, C. J., Title, A. M.,
Van Ballegooijen, A. A., et al. 1997, ApJ, 487, 424
In the text
NASA ADS
- Walsh, R. W.,
Galtier, S. 2000,
Sol. Phys., 197, 57
In the text
NASA ADS
- Wilhelm, K., Curdt, W., Marsch, E., et al.
1995, Sol. Phys., 162, 189
In the text
NASA ADS
- Wilhelm, K., Lemaire, P., Curdt, W., et al.
1997, Sol. Phys., 170, 75
In the text
NASA ADS
Copyright ESO 2002
![\begin{figure}
\par\includegraphics[width=9cm,clip]{3367f1.eps}\end{figure}](/articles/aa/full/2002/15/aah3367/img1.gif)
![\begin{figure}
\par\includegraphics[width=6.8cm,clip]{3367f2.eps}\end{figure}](/articles/aa/full/2002/15/aah3367/img14.gif)
![\begin{figure}
\par\includegraphics[width=8.8cm,clip]{3367f4.eps}\end{figure}](/articles/aa/full/2002/15/aah3367/img15.gif)