A&A 385, 884-895 (2002)
DOI: 10.1051/0004-6361:20020178
T. Fujii 1,2,![]() - Y. Nakada 1,3 - M. Parthasarathy 2,4
- Y. Nakada 1,3 - M. Parthasarathy 2,4
1 - Institute of Astronomy, University of Tokyo, 2-21-1 Osawa, Mitaka, Tokyo 181-0015, Japan
2 - National Astronomical Observatory of Japan, 2-21-1 Osawa, Mitaka, Tokyo 181-8588, Japan
3 - Kiso Observatory, Institute of Astronomy, University of Tokyo, Mitake, Kiso, Nagano 397-0101, Japan
4 - Indian Institute of Astrophysics, Bangalore 560034, India
Received 27 March 2000 / Accepted 20 December 2001
Abstract
BVRIJHK photometric observations are presented for 27 post-AGB candidates.
Almost all objects show a double peaked SED curve
in the optical to far-infrared wavelengths.
Seventeen objects were classified as post-AGB stars on the basis
of their spectral type, location in the IRAS color-color diagram and SED.
The physical parameters of the observed post-AGB stars,
the inner radius of the detached shell, the mass of the shell and
the distance were derived using the simple dust shell model.
We compared our observational sequence of post-AGB objects to
the theoretical evolutionary sequence (Schönberner 1983; Blöcker 1995)
in the stellar temperatures versus age diagram.
We found that two post-AGB stars, IRAS 05040+4820 and 08187-1905,
have low stellar temperature
with a large dynamical age of the dust shell.
They appear to provide the first observational evidence
that some low-mass stars bypass the
planetary nebulae stage because of
their slow increase in stellar temperature.
Key words: stars: AGB and post-AGB - stars: circumstellar matter - stars: evolution - stars: mass-loss - infrared: stars - ISM: Planetary Nebulae: general
Low to intermediate-mass stars cross the HR diagram horizontally from
the tip of the asymptotic giant branch (AGB) to
the planetary nebula (PN) region after they terminate a
rapid mass-loss phase.
This transition phase is called post-AGB phase of evolution.
From an analysis of the IRAS point source catalog, several
post-AGB stars have
been identified (Parthasarathy & Pottasch 1986,
1989; Pottasch et al. 1988).
The spectral energy distribution (SED) of post-AGB stars is double peaked.
One peak is at far-infrared wavelengths due to
the cold dust-shell (100-200 K) and the other peak is
at shorter wavelengths,
optical or near-infrared, from the obscured central star.
The cold dust-shell was observed by IRAS.
Most of the post-AGB stars, proto-planetary nebulae (PPNe) and
PNe were found within the IRAS color box defined
by F(12 ![]() m)/F(25
m)/F(25 ![]() m) < 0.3
and F(25
m) < 0.3
and F(25 ![]() m)/F(60
m)/F(60 ![]() m) > 0.3 (van der Veen & Habing 1988;
Pottasch et al. 1988).
They are well separated from other types of objects.
Based on the IRAS color-color diagrams
(Pottasch et al. 1988; Preite-Martinez 1988) one can conclude
that there is a good chance that an object is
a PN, a PPN or a post-AGB star if it is within the box defined
by the colors mentioned above.
An occasional HII region, Seyfert galaxy or T-Tau star is
not excluded from this range.
m) > 0.3 (van der Veen & Habing 1988;
Pottasch et al. 1988).
They are well separated from other types of objects.
Based on the IRAS color-color diagrams
(Pottasch et al. 1988; Preite-Martinez 1988) one can conclude
that there is a good chance that an object is
a PN, a PPN or a post-AGB star if it is within the box defined
by the colors mentioned above.
An occasional HII region, Seyfert galaxy or T-Tau star is
not excluded from this range.
Like PNe, PPNe are composed of post-AGB central stars and detached circumstellar envelopes of gas and dust; however, unlike PNe, their central stars are too cool to photoionize the envelopes. The terms PPNe and post-AGB stars are often used to describe the objects evolving from the tip of the AGB to PNe. Often one uses the term PPNe to describe the circumstellar shells of post-AGB stars that are not yet photoionized.
Since the post-AGB objects span a wide range in the spectral type of their central star as well as the obscuration of their dust shell, the analysis of their SED needs a combination of the optical and near-infrared photometry in addition to the IRAS data. In order to understand the nature of the SED in the shorter wavelength, optical and near-infrared photometry has been performed for some of the post-AGB stars. Manchado et al. (1989) and García-Lario et al. (1990, 1997) carried out JHK photometric survey of several IRAS sources with colors like PNe. The SEDs of eight post-AGB candidates were studied based on BVRIJHK photometry by Hrivnak et al. (1989). They showed that multi-color photometry in combination with spectral types of the IRAS sources enables one to estimate the parameters of the stars and their circumstellar dust envelopes.
In order to increase the number of well-determined post-AGB stars and to classify them using SEDs from optical to far-infrared wave length, we have initiated a program to carry out systematic optical and near-infrared photometry of post-AGB candidates. We have selected several post-AGB candidates based on the above IRAS colors that are observable from Kiso Observatory. In this paper we report the BVRIJHK photometric observations and analysis of 27 post-AGB candidates.
![\begin{figure}
\par\includegraphics[angle=-90,width=6.7cm,clip]{fig1.eps}
\end{figure}](/articles/aa/full/2002/15/aa9778/img11.gif) |
Figure 1:
The positions of program IRAS sources in the
van der Veen & Habing (1988) IRAS color-color diagram.
The IRAS colors are defined as
|
| Open with DEXTER | |
| ID | IRAS Name | Association |
|
|
|
|
VAR a | lb | bb | qindexc |
| No. | SAO or HD | [Jy] | [Jy] | [Jy] | [Jy] | [deg.] | [deg.] | |||
| 1 | 02086+7600 | 0.25 | 2.68 | 7.41 | 10.49 | 9 | 127.9 | 14.2 | 3333 | |
| 2 | 02143+5852 | 5.90 | 18.06 | 5.39 | 8.97 | 94 | 133.9 | -1.9 | 3331 | |
| 3 | 02528+4350 | 0.56 | 2.38 | 3.00 | 2.22 | 0 | 145.4 | -13.3 | 3333 | |
| 4 | 04269+3550 | 2.83 | 9.92 | 21.29 | 15.58 | 19 | 164.9 | -8.6 | 3333 | |
| 5 | 04296+3429 | 12.74 | 45.94 | 15.45 | 9.22 | 11 | 166.2 | -9.1 | 3331 | |
| 6 | 05040+4820 | SAO 40039 | 0.25 | 7.20 | 20.20 | 11.00 | - | 159.8 | 4.8 | 1333 |
| 7 | 05089+0459 | 7.37 | 21.89 | 11.10 | 3.78 | 14 | 196.3 | -19.5 | 3333 | |
| 8 | 05113+1347 | 3.78 | 15.30 | 5.53 | 1.67 | 10 | 188.9 | -14.3 | 3331 | |
| 9 | 05170+0535 | SAO 112630 | 0.60 | 4.42 | 14.06 | 9.38 | 31 | 196.8 | -17.5 | 3333 |
| 10 | 05238-0626 | 0.59 | 1.74 | 1.16 | 1.87 | 0 | 208.9 | -21.8 | 3321 | |
| 11 | 05341+0852 | 4.51 | 9.85 | 3.96 | 8.01 | 0 | 196.2 | -12.1 | 3331 | |
| 12 | 05355-0117 | HD 290764 | 0.68 | 3.89 | 10.38 | 9.00 | 0 | 205.5 | -16.9 | 3333 |
| 13 | 05381+1012 | 0.85 | 2.93 | 1.39 | 9.44 | 13 | 195.5 | -10.6 | 3331 | |
| 14 | 06013-1452 | 1.86 | 4.34 | 3.11 | 1.25 | 0 | 221.2 | -17.2 | 3331 | |
| 15 | 06059-0632 | SAO 132875 | 0.38 | 4.41 | 9.64 | 6.52 | 12 | 213.9 | -12.5 | 3322 |
| 16 | 06060+2038 | HD 252325 | 2.27 | 27.08 | 112.3 | 18.39 | 15 | 189.8 | 0.4 | 3321 |
| 17 | 06284-0937 | SAO 133356 | 0.32 | 2.60 | 0.40 | 369.1 | - | 219.3 | -8.9 | 1311 |
| 18 | 06338+5333 | SAO 25845 | 0.46 | 0.38 | 0.40 | 1.15 | 3 | 162.0 | 19.6 | 3211 |
| 19 | 06530-0213 | 6.11 | 27.41 | 15.05 | 4.10 | 8 | 215.4 | -0.1 | 3333 | |
| 20 | 07077-1825 | 0.80 | 6.66 | 0.40 | 211.4 | 0 | 231.5 | -4.4 | 3311 | |
| 21 | 07131-0147 | 2.59 | 4.22 | 3.96 | 3.68 | 1 | 217.4 | 4.5 | 3333 | |
| 22 | 07171+1823 | 0.41 | 1.38 | 0.70 | 1.00 | - | 199.5 | 14.4 | 1331 | |
| 23 | 07253-2001 | 6.30 | 15.16 | 6.05 | 8.05 | 8 | 234.9 | -1.5 | 3331 | |
| 24 | 07430+1115 | 7.68 | 29.93 | 10.67 | 2.53 | 9 | 208.9 | 17.1 | 3333 | |
| 25 | 08187-1905 | HD 70379 | 0.71 | 17.62 | 12.31 | 3.68 | 0 | 240.6 | 9.8 | 3333 |
| 26 | 23304+6147 | 11.36 | 59.07 | 26.60 | 30.89 | 8 | 113.9 | 0.6 | 3331 | |
| 27 | (BD+39 |
SAO 72704 | - | - | - | - | - | 98.4 | -16.7 |
|
Notes: BD+39 a VAR: percent likelihood of variability. b l, b: Galactic longitude and latitude, respectively. c qindex: Flux density quality (1 = upper limit, 2 = moderate quality, 3 = good quality). From left to right, each figure stand for IRAS photometric band 12 |
| ID | IRAS Name | B | V | J | H | K | Obs. date | Obs. date | ||
| No. | [mag] | [mag] | [mag] | [mag] | [mag] | [mag] | [mag] | Optical | NearIR | |
1 |
02086+7600 | 13.54 | 12.74 | >11.14 | Oct. 19/1997 | |||||
| 2 | 02143+5852 | 14.96 | 13.74 | 12.96 | 12.15 | 10.58 | 9.51 | 8.79 | Jan. 11/1996 | Oct. 19/1997 |
| 3 | 02528+4350 | 11.11 | 10.82 | 10.67 | 10.46 | 10.20 | 9.99 | 9.62 | Jan. 11/1996 | Oct. 19/1997 |
| 4 | 04269+3550 | 12.00 | 9.65 | 8.35 | Oct. 19/1997 | |||||
| 5 | 04296+3429 | 16.18 | 14.17 | 12.89 | 11.65 | 9.67 | 8.80 | 8.44 | Dec. 02/1995 | Feb. 24/1997 |
| 16.41 | 14.23 | 12.98 | 11.74 | 9.55 | 8.68 | 8.28 | Dec. 12/1995 | Nov. 11/1997 | ||
| 6 | 05040+4820 | 10.14 | 9.58 | 9.20 | 8.81 | 8.24 | 8.03 | 7.91 | Dec. 02/1995 | Oct. 19/1997 |
| 10.12 | 9.54 | 9.20 | 8.86 | Dec. 12/1995 | ||||||
| 7 | 05089+0459 | 16.20 | 14.48 | 13.12 | 11.65 | 10.14 | 9.26 | 8.92 | Feb. 07/1996 | Feb. 24/1997 |
| 10.09 | 9.12 | 8.84 | Oct. 17/1997 | |||||||
| 8 | 05113+1347 | 14.67 | 12.40 | 11.27 | 10.26 | 8.96 | 8.43 | 8.05 | Dec. 02/1995 | Feb. 24/1997 |
| 14.76 | 12.49 | 11.32 | 10.35 | 9.02 | 8.44 | 8.25 | Dec. 12/1995 | Oct. 17/1997 | ||
| 9 | 05170+0535 | 9.72 | 9.11 | 8.77 | 8.44 | Dec. 02/1995 | ||||
| 9.76 | 9.18 | 8.83 | 8.50 | Dec. 12/1995 | ||||||
| 10 | 05238-0626 | 10.96 | 10.52 | 10.23 | 9.94 | 9.61 | 9.31 | 9.03 | Dec. 02/1995 | Oct. 19/1997 |
| 11 | 05341+0852 | 15.44 | 13.58 | 12.43 | 11.44 | 9.97 | 9.36 | 9.05 | Dec. 02/1995 | Nov. 11/1997 |
| 15.53 | 13.63 | 12.51 | 11.49 | Dec. 12/1995 | ||||||
| 12 | 05355-0117 | 10.16 | 9.81 | 9.61 | 9.32 | Mar. 06/1996 | ||||
| 13 | 05381+1012 | 11.50 | 10.59 | 10.04 | 9.52 | 8.80 | 8.44 | 8.18 | Dec. 02/1995 | Oct. 19/1997 |
| 11.47 | 10.57 | 10.02 | 9.52 | Dec. 13/1995 | ||||||
| 14 | 06013-1452 | 10.34 | 10.22 | 10.17 | 10.02 | 9.87 | 9.72 | 9.34 | Mar. 06/1996 | Mar. 24/1997 |
| 15 | 06059-0632 | 9.33 | 8.84 | 8.59 | 8.30 | Mar. 06/1996 | ||||
| 16 | 06060+2038 | 11.36 | 10.76 | 10.32 | 9.91 | Mar. 06/1996 | ||||
| 17 | 06284-0937 | 9.42 | 8.99 | 8.78 | 8.53 | Feb. 07/1996 | ||||
| 18 | 06338+5333 | 9.32 | 8.87 | 8.57 | 8.25 | Dec. 12/1995 | ||||
| 19 | 06530-0213 | 16.26 | 13.99 | 12.63 | 11.41 | Feb. 07/1996 | ||||
| 20 | 07077-1825 | 11.25 | 10.78 | 10.43 | 10.12 | Jan. 11/1996 | ||||
| 21 | 07131-0147 | 16.40 | 14.53 | 13.03 | 11.58 | 9.78 | 9.09 | 8.30 | Dec. 13/1995 | Feb. 26/1997 |
| 22 | 07171+1823 | 12.70 | 12.73 | 12.62 | 12.74 | Jan. 11/1996 | ||||
| 23 | 07253-2001 | 14.07 | 13.34 | 12.82 | 12.32 | Dec. 13/1995 | ||||
| 24 | 07430+1115 | 14.22 | 12.38 | 11.38 | 10.50 | 8.95 | 8.29 | 7.87 | Dec. 12/1995 | Feb. 26/1997 |
| 25 | 08187-1905 | 9.70 | 9.03 | 8.56 | 8.20 | Dec. 13/1995 | ||||
| 26 | 23304+6147 | 15.65 | 13.19 | 11.80 | 10.49 | 8.54 | 7.86 | 7.54 | Feb. 07/1996 | Oct. 19/1997 |
| 27 | (BD+39 |
9.46 | 9.25 | 9.07 | 8.90 | 8.50 | 8.36 | 8.19 | Nov. 29/1995 | Oct. 19/1997 |
| Notes.
The errors of magnitude are
|
| ID | IRAS Name | Spectral | Chem. a | Tstar | (B-V)0 |
|
E(B-V) | AV1 b | AV2 c | ref. d | Object type |
| No. | Type | Type | [K] | [mag] | [mag] | [mag] | [mag] | [mag] | |||
| 1 | 02086+7600 | YSO? | |||||||||
| 2 | 02143+5852 | F(5Ib e) | 6900 | 0.33 | 1.22 | 0.89 | 2.75 | 2.0 | A | P-AGB | |
| 3 | 02528+4350 | Galaxy | |||||||||
| 4 | 04269+3550 | YSO? | |||||||||
| 5 | 04296+3429 | G0Ia | C | 5550 | 0.75 | 2.07 | 1.32 | 4.10 | 2.23 | B | P-AGB |
| 6 | 05040+4820 | A4Ia | 8750 | 0.07 | 0.57 | 0.50 | 1.55 | 1.0 | C | P-AGB | |
| 7 | 05089+0459 | M(0Ib e) | 3650 | 1.64 | 1.73 | 0.09 | 0.27 | 0.37 | A | P-AGB | |
| 8 | 05113+1347 | G8Ia | C | 4590 | 1.17 | 2.27 | 1.10 | 3.41 | 1.67 | B | P-AGB |
| 9 | 05170+0535 | G0Ve | D | PMS | |||||||
| 10 | 05238-0626 | F2II | 7380 | 0.30 | 0.44 | 0.14 | 0.44 | 0.37 | E | P-AGB | |
| 11 | 05341+0852 | F4Iab | C | 7060 | 0.29 | 1.88 | 1.59 | 4.93 | 1.21 | F | P-AGB |
| 12 | 05355-0117 | A5III | G | ||||||||
| 13 | 05381+1012 | G(2Ib e) | 4850 | 0.86 | 0.90 | 0.04 | 0.13 | 1.30 | B | P-AGB | |
| 14 | 06013-1452 | Ae | G | Herbig Ae/Be | |||||||
| 15 | 06059-0632 | B3 | G | PMS | |||||||
| 16 | 06060+2038 | B1V | G | ii II region | |||||||
| 17 | 06284-0937 | B3ne | H | Herbig Ae/Be | |||||||
| 18 | 06338+5333 | F7IVw | 6250 | 0.50 | 0.45 | -0.05 | 0.0 f | 0.31 | G | P-AGB | |
| 19 | 06530-0213 | F0Iab | C | 7700 | 0.17 | 2.28 | 2.11 | 6.53 | 2.0 | G | P-AGB |
| 20 | 07077-1825 | O6 | G | ii II region | |||||||
| 21 | 07131-0147 | M5III | 3330 | 1.63 | 1.87 | 0.24 | 0.76 | 2.0 | I | P-AGB, Bipolar-PPN | |
| 22 | 07171+1823 | B(5Ib e) | 13600 | -0.10 | -0.04 | 0.06 | 0.19 | 0.25 | J | P-AGB | |
| 23 | 07253-2001 | F5Ie | 6900 | 0.33 | 0.73 | 0.40 | 1.23 | 1.0 | E | P-AGB | |
| 24 | 07430+1115 | G5 0-Ia | C | 4850 | 1.03 | 1.84 | 0.81 | 2.50 | 0.06 | K | P-AGB |
| 25 | 08187-1905 | F6Ib/II | 6630 | 0.42 | 0.67 | 0.25 | 0.78 | 0.33 | G | P-AGB | |
| 26 | 23304+6147 | G2Ia | C | 5200 | 0.87 | 2.46 | 1.59 | 4.93 | 2.2 | B | P-AGB |
| 27 | BD+39 |
B8(Ib e) | 11200 | -0.04 | 0.22 | 0.26 | 0.79 | 0.37 | G | P-AGB |
|
a
C: carbon-rich object.
b Derived from intrinsic and observed B-V, it contains interstellar and circumstellar extinction. c Derived from interstellar extinction maps. d References for spectral types; (A) Meixner et al. (1999), (B) Hrivnak (1995), (C) Hardorp et al. (1959), (D) Zuckerman et al. (1995), (E) Reddy and Parthasarathy (1996), (F) Parthasarathy (1993), (G) SIMBAD database, (H) van den Ancker et al. (1998), (I) Scarrott et al. (1990), (J) Vijapurkar et al. (1998), (K) Hrivnak and Kwok (1999). e Assumption. f We assumed AV=0.0, since |
![\begin{figure}
\par\includegraphics[width=5.6cm,clip]{fig2.eps} \end{figure}](/articles/aa/full/2002/15/aa9778/img39.gif) |
Figure 2: (J-H)0 vs. (H-K)0 color-color diagram of the 12 observed IRAS sources. We used average magnitudes for the objects which were observed twice. We corrected the interstellar and circumstellar reddening for all stars. Blackbody at temperatures ranging from 2000 to 1000 K are marked on the solid line. The dotted line shows the super-giant (SG) sequence and the dashed line shows the main-sequence (MS) (Cox 2000). The location of Miras and PNe (Glass & Feast 1982; Whitelock 1985) in the color-color diagram are also indicated. |
| Open with DEXTER | |
![\begin{figure}
\par\includegraphics[width=5.6cm,clip]{fig3.eps} \end{figure}](/articles/aa/full/2002/15/aa9778/img40.gif) |
Figure 3: (B-V)0 vs. (V-I)0 color-color diagram of the 17 observed IRAS sources. We used average magnitudes for the objects which were observed twice. The thick line indicates the color-color sequence of super-giants (Cox 2000). |
| Open with DEXTER | |
In order to derive the parameters of the stars, we need to estimate the
reddening in the line of sight of these sources.
First, we used two methods to obtain reddening:
(1) from spectral types of stars, (2) from interstellar extinction maps.
While one can estimate both interstellar and circumstellar reddening by using
the first method, one can obtain interstellar reddening alone by using the
latter method.
Method (1): AV1;
for most post-AGB candidates, their spectral types are available in the literature.
From the spectral type of the star we know the intrinsic (B-V)0,
and from the observed
![]() we estimated
the reddening E(B-V) (
we estimated
the reddening E(B-V) (
![]() ).
To derive the AV value, we adopted
RV = 3.1, i.e.
).
To derive the AV value, we adopted
RV = 3.1, i.e.
![]() .
For the objects whose spectral subclass and/or luminosity class
were not determined, we assume a moderate one.
The values of intrinsic (B-V)0 and stellar effective temperature
.
For the objects whose spectral subclass and/or luminosity class
were not determined, we assume a moderate one.
The values of intrinsic (B-V)0 and stellar effective temperature
![]() were quoted from the lists
of Schmidt-Kaler (1982). The AV1 values contain the contribution from
the interstellar and circumstellar reddening.
were quoted from the lists
of Schmidt-Kaler (1982). The AV1 values contain the contribution from
the interstellar and circumstellar reddening.
Method (2): AV2;
we estimated AV values using their galactic latitudes
and longitudes and corresponding interstellar extinction maps
(Neckel & Klare 1980; Burstein & Heiles 1982;
Schlegel et al. 1998).
The spectral type, chemical type (carbon-rich or not),
![]() ,
E(B-V), two values of AV(AV1 and AV2) and
the object type cited from the literature are given in Table 3.
In general one can estimate the circumstellar reddening from these two
values of AV.
However, for some stars, the AV2 (interstellar) is
larger than the AV1 (interstellar plus circumstellar).
This contradiction may be due to uncertainty of interstellar extinction maps
and uncertainty of circumstellar extinction law.
This may also be due to uncertainty in spectral types in some cases.
In particular the AV value derived from the map depends on the distance to the star
and the spatial resolution of these maps is not sufficiently high.
Therefore, it is dangerous to blindly accept the AV value obtained from the map in some cases.
Indeed, we could not find dust shell parameters
for some stars if we fixed the value of interstellar extinction and the stellar temperature simultaneously.
For this reason, we did not adopt AV2 to plot SED diagrams and model calculations.
We estimated interstellar reddening from model calculations, treating extinction as a
parameter. We describe how to estimate interstellar AV in Sect. 3.
,
E(B-V), two values of AV(AV1 and AV2) and
the object type cited from the literature are given in Table 3.
In general one can estimate the circumstellar reddening from these two
values of AV.
However, for some stars, the AV2 (interstellar) is
larger than the AV1 (interstellar plus circumstellar).
This contradiction may be due to uncertainty of interstellar extinction maps
and uncertainty of circumstellar extinction law.
This may also be due to uncertainty in spectral types in some cases.
In particular the AV value derived from the map depends on the distance to the star
and the spatial resolution of these maps is not sufficiently high.
Therefore, it is dangerous to blindly accept the AV value obtained from the map in some cases.
Indeed, we could not find dust shell parameters
for some stars if we fixed the value of interstellar extinction and the stellar temperature simultaneously.
For this reason, we did not adopt AV2 to plot SED diagrams and model calculations.
We estimated interstellar reddening from model calculations, treating extinction as a
parameter. We describe how to estimate interstellar AV in Sect. 3.
We adopted AV1 in plotting optical and near-infrared color-color diagrams
to see positions of dereddened post-AGB central stars.
We have corrected the photometric data for interstellar and circumstellar
reddening using
standard extinction laws derived by Rieke & Lebofsky (1985).
For ![]() and
and ![]() bands,
we interpolated values given in the mentioned above paper and adopted them.
Strictly, it is not correct to apply a standard extinction law to
correct for circumstellar extinction since these two (interstellar and circumstellar) extinction laws
are not guaranteed to be the same.
However, little is known about circumstellar extinction laws.
Therefore, we presumed
interstellar and circumstellar extinction laws to be similar here.
bands,
we interpolated values given in the mentioned above paper and adopted them.
Strictly, it is not correct to apply a standard extinction law to
correct for circumstellar extinction since these two (interstellar and circumstellar) extinction laws
are not guaranteed to be the same.
However, little is known about circumstellar extinction laws.
Therefore, we presumed
interstellar and circumstellar extinction laws to be similar here.
The objects for which the evolutionary status is not clear were excluded from further analysis and discussion. The IRAS name of these excluded objects are 02086+7600, 02528+4350, 04269+3550, 05170+0535, 05355-0117, 06013-1452, 06059-0632, 06060+2038, 06284-0937 and 07077-1825. The reasons for excluding these objects from the list of post-AGB candidates are given in Sect. 4.2 (notes on individual objects).
Figures 2 and 3 show the location of the program stars in the (J-H)0, (H-K)0 and (B-V)0, (V-I)0 color-color diagram with the sequence of super-giants (Cox 2000), respectively. The position of the stars in the color-color diagrams indicate the consistency of optical, near-infrared colors and spectral types.
 |
(1) |
The central star was assumed to be a blackbody source with
a temperature
![]() and the luminosity
and the luminosity
![]() .
The core-mass luminosity relation gave 0.625
.
The core-mass luminosity relation gave 0.625 ![]() for the mass of the central star (Blöcker 1995),
if we neglect the very thin envelope around the core.
Flux from the star is given by:
for the mass of the central star (Blöcker 1995),
if we neglect the very thin envelope around the core.
Flux from the star is given by:
 |
(2) |
A constant expansion velocity of the AGB shell
(
![]() )
and
constant mass-loss rate in the AGB phase are assumed.
In this case, the mass density in the shell is
inversely proportional to the square of distance from the central star.
The number density distribution of dust grains is given by:
)
and
constant mass-loss rate in the AGB phase are assumed.
In this case, the mass density in the shell is
inversely proportional to the square of distance from the central star.
The number density distribution of dust grains is given by:
 |
(3) |
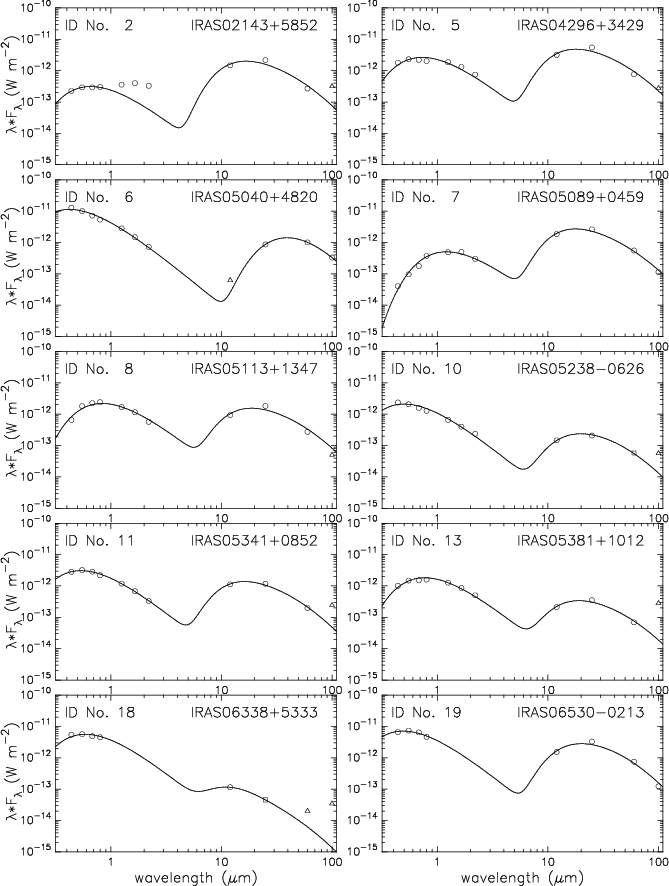 |
Figure 4: Reddening-corrected (using AV values in Table 4) spectral energy distribution of program stars. The full line indicates the calculated SED curve using parameters in Table 4. Open boxes denote IRAS flux density quality = 2 and open triangles indicate IRAS flux density quality = 1. Continued in Fig. 5. |
| Open with DEXTER | |
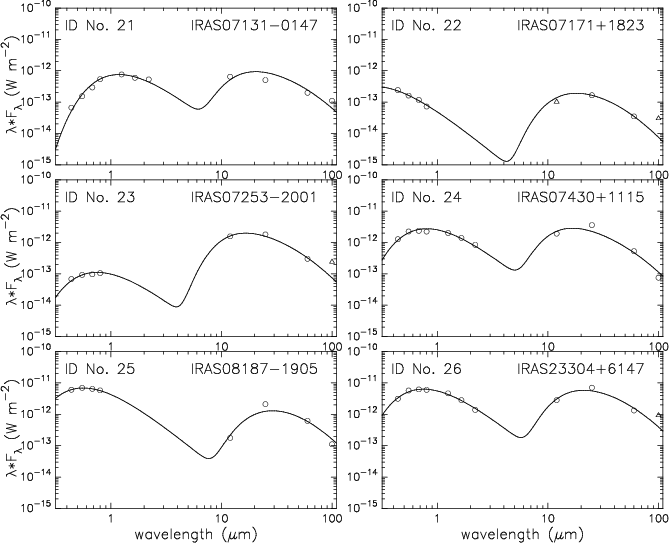 |
Figure 5: SED of program stars. The same as Fig. 4. |
| Open with DEXTER | |
We assume the shell is optically thin at all wavelengths and
the dust grains are in thermal equilibrium with the radiation from
the central star.
Light scattering by the dust grains is neglected.
Frequency dependence of the dust grain absorption cross-section is
assumed as a power-law function of wavelength, which allows an
analytical form of the temperature distribution of the dust grains.
For the dust grain parameters,
we assumed the average grain radius
![]() and the mass density of the
grains
and the mass density of the
grains
![]() and
absorption efficiency
and
absorption efficiency
![]() .
The temperature distribution is given by:
.
The temperature distribution is given by:
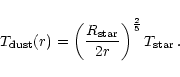 |
(4) |
 |
(6) |
We set the dust-to-gas mass ratio to be
![]() .
The dust temperature
.
The dust temperature
![]() is determined at the inner boundary
of the dust shell.
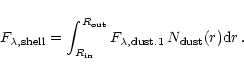
Derived parameters of post-AGB candidates are shown in Table 4.
The interstellar extinction-corrected SEDs
with a model fitting curve
are shown in Figs. 4 and 5.
is determined at the inner boundary
of the dust shell.
Derived parameters of post-AGB candidates are shown in Table 4.
The interstellar extinction-corrected SEDs
with a model fitting curve
are shown in Figs. 4 and 5.
The IRAS data points for which flux density quality was equal to 1 were not used for fitting.
BD+39![]() 4926 was not included
since it is not a IRAS source.
For IRAS 02143+5852, near-infrared data points were not used for
calculation because of the near-infrared excess.
4926 was not included
since it is not a IRAS source.
For IRAS 02143+5852, near-infrared data points were not used for
calculation because of the near-infrared excess.
The fitting parameter
![]() is transformed to
is transformed to
![]() ,
the dynamical time of the dust shell, by being divided by the assumed
expansion velocity of the dust shell.
While an average value of
,
the dynamical time of the dust shell, by being divided by the assumed
expansion velocity of the dust shell.
While an average value of
![]() is used,
the observed values in PPNe are found over some range,
for example from 10 to 20
is used,
the observed values in PPNe are found over some range,
for example from 10 to 20
![]() (Hu et al. 1994),
and this is translated into an uncertainty in the dynamical time of the
dust shell.
(Hu et al. 1994),
and this is translated into an uncertainty in the dynamical time of the
dust shell.
![]() in Col. 6 of Table 4 is
obtained from
in Col. 6 of Table 4 is
obtained from
![]() divided by the dust-to-gas mass ratio.
We assume the duration time of AGB mass-loss phase is to be 10000 yr,
therefore one can easily derive the mass-loss rate in AGB phase
by dividing
divided by the dust-to-gas mass ratio.
We assume the duration time of AGB mass-loss phase is to be 10000 yr,
therefore one can easily derive the mass-loss rate in AGB phase
by dividing
![]() by 104 yr.
by 104 yr.
![\begin{figure}
\par\includegraphics[angle=-90,width=8.5cm,clip]{fig6.eps} \end{figure}](/articles/aa/full/2002/15/aa9778/img74.gif) |
Figure 6:
V0-[25] vs. [25]-[60] color-color diagram of
the 16 observed IRAS sources which are post-AGB objects.
Horizontal and vertical axes mean
|
| Open with DEXTER | |
Distances of post-AGB candidates were also estimated using the equation
![]() and
and
![]() .
For all the post-AGB candidates, we used
.
For all the post-AGB candidates, we used
![]() which correspond to
which correspond to
![]() .
The value of the bolometric correction
.
The value of the bolometric correction
![]() of each object
was quoted from Schmidt-Kaler (1982) according to its
spectral type.
The AV values used are given in Table 3 (AV1).
The last column of Table 4 shows estimated distances.
The values of D calculated by two different methods
agree within a factor of 1.5 except for IRAS 05089+0459.
The observed optical to near-infrared energy distribution of this
object is very similar to that of an early M star,
requiring little extinction AV1 for this star.
A strong contrast between the small extinction and the large
far-infrared excess suggests an oblique torus or disk model
for IRAS 05089+0459, but further observations are needed to
confirm this hypothesis.
of each object
was quoted from Schmidt-Kaler (1982) according to its
spectral type.
The AV values used are given in Table 3 (AV1).
The last column of Table 4 shows estimated distances.
The values of D calculated by two different methods
agree within a factor of 1.5 except for IRAS 05089+0459.
The observed optical to near-infrared energy distribution of this
object is very similar to that of an early M star,
requiring little extinction AV1 for this star.
A strong contrast between the small extinction and the large
far-infrared excess suggests an oblique torus or disk model
for IRAS 05089+0459, but further observations are needed to
confirm this hypothesis.
Carbon-rich objects show large differences between the two extinction values AV2 and AV3 (Table 4). We found that the carbon-rich objects all have a large AV. One possible explanation is that the circumstellar extinction law of the carbon-rich dust shell is very different from the assumed one, and another possibility is, as in the case of IRAS 05089+0459, the shape of the dust shell deviates from spherical symmetry.
| ID | IRAS Name | Tstar a | Tdust | tdyn | Mdust+gas b | AV3 c | Dfit d | DMV e |
| No. | [K] | [K] | [yr] | [ |
[mag] | [pc] | [pc] | |
| 2 | 02143+5852 | 6900 | 205 | 338 | 0.740 | 1.66 | 16900 | 16400 |
| 5 | 04296+3429 | 5550 | 193 | 354 | 0.420 | 4.36 | 7090 | 10200 |
| 6 | 05040+4820 | 8750 | 97 | 2460 | 0.254 | 1.31 | 4010 | 3930 |
| 7 | 05089+0459 | 3650 | 189 | 303 | 1.08 | 1.18 | 13900 | 40500 |
| 8 | 05113+1347 | 4590 | 185 | 358 | 0.240 | 2.34 | 8530 | 5470 |
| 10 | 05238-0626 | 7380 | 183 | 464 | 0.040 | 0.56 | 9310 | 10700 |
| 11 | 05341+0852 | 7060 | 210 | 323 | 0.090 | 4.12 | 7420 | 5620 |
| 13 | 05381+1012 | 4850 | 183 | 377 | 0.072 | 0.26 | 9910 | 11900 |
| 18 | 06338+5333 | 6250 | 267 | 167 | 0.002 | 0.00 | 5810 | 5860 |
| 19 | 06530-0213 | 7700 | 182 | 480 | 0.129 | 5.40 | 4880 | 3260 |
| 21 | 07131-0147 | 3330 | 171 | 371 | 0.554 | 1.74 | 13900 | 19200 |
| 22 | 07171+1823 | 13600 | 203 | 488 | 0.111 | 0.00 | 22800 | 22000 |
| 23 | 07253-2001 | 6900 | 206 | 335 | 1.270 | 0.00 | 22300 | 27500 |
| 24 | 07430+1115 | 4850 | 201 | 300 | 0.242 | 2.51 | 7460 | 8570 |
| 25 | 08187-1905 | 6630 | 135 | 937 | 0.168 | 0.38 | 5070 | 4540 |
| 26 | 23304+6147 | 5200 | 173 | 453 | 0.366 | 4.33 | 4880 | 4310 |
|
a
Same values in Table 3.
|
The observed stars have double peaked SEDs, suggesting the existence of
the detached cold shell around the central star. Our model calculations
actually showed the
![]() larger than
larger than
![]() ,
about 100 times larger than the usual radial size of the dust-forming region of the AGB stars.
Similar values were estimated by Hrivnak et al. (1989).
As expected from the variety of relative
strength of the infrared peak to
the visible one, the optical thickness of the dust shell changes from
object to object. Figure 6 shows the observed stars on
the
V0-[25] to
[25]-[60] diagram.
A sequence of stars along the horizontal axis in the right part of
the diagram presents the change of the optical depth of the shell.
,
about 100 times larger than the usual radial size of the dust-forming region of the AGB stars.
Similar values were estimated by Hrivnak et al. (1989).
As expected from the variety of relative
strength of the infrared peak to
the visible one, the optical thickness of the dust shell changes from
object to object. Figure 6 shows the observed stars on
the
V0-[25] to
[25]-[60] diagram.
A sequence of stars along the horizontal axis in the right part of
the diagram presents the change of the optical depth of the shell.
Figure 7 compares the stellar temperature with the
dynamical time of the dust shell.
The theoretical evolutionary tracks of the post-AGB stars with different core masses
by Schönberner (1983) and Blöcker (1995) are plotted
in Fig. 7.
A common feature of all those theoretical tracks is that
the detached shell appears when the stellar temperature goes up to 5000 or 6000 K.
This means that they assumed AGB superwind mass-loss (
![]() )
terminates at these temperatures.
In general, the agreement between the observational results and the
theoretical evolutionary tracks is satisfactory. However, the
observations appear to fit with a somewhat lower core mass
indicating a somewhat lower luminosity than that used in the models.
Six objects among our samples are distributed below the line of
)
terminates at these temperatures.
In general, the agreement between the observational results and the
theoretical evolutionary tracks is satisfactory. However, the
observations appear to fit with a somewhat lower core mass
indicating a somewhat lower luminosity than that used in the models.
Six objects among our samples are distributed below the line of
![]() ;
two of them, IRAS 05089+0459 and 07131-0147, are peculiar M type stars
while the remainders are all G type.
The temperatures we used here were cited from different authors and
there are uncertainties in the spectral sub-class.
Overall, our observational results are in agreement with the
theoretical post-AGB models (Fig. 7) (Blöcker 1995; Schönberner 1983).
The same kind of figures are shown by van der Veen et al. (1989) and Schönberner & Blöcker (1993).
Figure 7 is consistent with their figures.
;
two of them, IRAS 05089+0459 and 07131-0147, are peculiar M type stars
while the remainders are all G type.
The temperatures we used here were cited from different authors and
there are uncertainties in the spectral sub-class.
Overall, our observational results are in agreement with the
theoretical post-AGB models (Fig. 7) (Blöcker 1995; Schönberner 1983).
The same kind of figures are shown by van der Veen et al. (1989) and Schönberner & Blöcker (1993).
Figure 7 is consistent with their figures.
![\begin{figure}
\par\includegraphics[width=9cm,clip]{fig7.eps}
\par\end{figure}](/articles/aa/full/2002/15/aa9778/img88.gif) |
Figure 7:
Comparison of the stellar temperature with dynamical
time of the dust shell, assuming constant expansion
velocity (
|
| Open with DEXTER | |
In Fig. 7, two stars exist apart from the main group.
One is IRAS 05040+4820 and the other is IRAS 08187-1905.
In spite of their relatively low stellar temperatures, the dynamical ages of their
dust shells are large.
These dust shells most likely will disperse into the interstellar space
before the stellar temperature rises to ionize the
surrounding gases.
We note that they are on the evolutionary track of
![]() indicating low mass for their parent stars,
probably one solar mass or less.
Renzini (1981) predicted the fate of a
low mass star to become a white dwarf bypassing the PN stage.
Scarcity of PNe in globular clusters supports his
hypothesis, but no direct evidence has been
found as far as we know. The above two IRAS sources are the
first sample of Renzini's "lazy'' AGB remnants.
indicating low mass for their parent stars,
probably one solar mass or less.
Renzini (1981) predicted the fate of a
low mass star to become a white dwarf bypassing the PN stage.
Scarcity of PNe in globular clusters supports his
hypothesis, but no direct evidence has been
found as far as we know. The above two IRAS sources are the
first sample of Renzini's "lazy'' AGB remnants.
It is a member of the dark cloud L1333,
which is a molecular cloud in Cassiopeia (Obayashi et al. 1998).
It is identified with CO core No. 4 and is most likely a young stellar
object (YSO) embedded in a CO core.
The far-infrared luminosity of this source was estimated to be about 1 ![]() at a distance
of 180 pc. The 12
at a distance
of 180 pc. The 12 ![]() m to 25
m to 25 ![]() m flux ratio is significantly
smaller than that of a typical T Tau star.
m flux ratio is significantly
smaller than that of a typical T Tau star.
Van de Steene & Pottasch (1995) considered it as a possible
planetary nebula, however they have not found radio continuum
emission from this source. Slysh et al. (1994) searched for
OH maser emission and it was detected at 1667 and 1665 MHz with
a velocity of
![]() .
Preite-Martinez (1988) considered
it as a possible new PN.
It may be a ultra-compact ii II region,
or a post-AGB star, or a YSO. We need BVRI observations
and a low resolution spectrum to understand the evolutionary
stage of this object.
.
Preite-Martinez (1988) considered
it as a possible new PN.
It may be a ultra-compact ii II region,
or a post-AGB star, or a YSO. We need BVRI observations
and a low resolution spectrum to understand the evolutionary
stage of this object.
IRAS 02143+5852
Manchado et al. (1989) and García-Lario et al. (1997)
made JHK photometric observations and our JHK photometric magnitudes
are in agreement with theirs. Omont et al. (1993) considered
it as a carbon-rich PPN, however no
CO and HCN emission is detected. It is a F type post-AGB
supergiant (Meixner et al. 1999).
Meixner et al. (1999)
imaged it at 11.7 ![]() m and it is not resolved.
m and it is not resolved.
IRAS 02528+4350
Because of its IRAS colors, it was classified as a post-AGB
candidate. However,
Nakanishi et al. (1997) recently found it to be a galaxy with a
redshift of
![]() .
Crawford et al. (1996) also
consider it as an ultraluminous infrared galaxy, however no radio
emission is detected. The JHK photometric observations of
Manchado et al. (1989), García-Lario et al. (1997)
are in agreement with ours. They and Van de Steene &
Pottasch (1995) considered it as a PPN/PN. However in the light
of recent work of Nakanishi et al. (1997), it is a galaxy and not
a post-AGB star.
.
Crawford et al. (1996) also
consider it as an ultraluminous infrared galaxy, however no radio
emission is detected. The JHK photometric observations of
Manchado et al. (1989), García-Lario et al. (1997)
are in agreement with ours. They and Van de Steene &
Pottasch (1995) considered it as a PPN/PN. However in the light
of recent work of Nakanishi et al. (1997), it is a galaxy and not
a post-AGB star.
IRAS 04269+3550
Van de Steene & Pottasch (1995) considered it as a PN
candidate, however they did not detect radio continuum emission.
Wouterloot et al. (1993) searched for H2O, OH,
CH3OH and CO and did not detect any of these emissions.
Preite-Martinez (1988) considered it as a possible new PN.
From our JHK photometry and IRAS data, the SED of this object seems to
be a single peaked curve
rather than a double peaked curve.
It maybe a post-AGB star obscured by the thick dust-shell.
To confirm the object type, we need other observations, such as spectroscopy.
IRAS 04296+3429
The unidentified emission feature at 21 ![]() was first discovered
in the IRAS LRS spectra of four carbon-rich post-AGB stars (Kwok et al. 1989), including IRAS 04296+3429.
It also possesses a strong 30
was first discovered
in the IRAS LRS spectra of four carbon-rich post-AGB stars (Kwok et al. 1989), including IRAS 04296+3429.
It also possesses a strong 30 ![]() m emission
(Szczerba et al. 1999). In the optical spectrum
emission bands (0, 0) and (0, 1) of the Swan system of the
C2 molecule were detected (Klochkova et al. 1999). The effective
temperature of the star from high resolution spectrum was
estimated to be 6300 K. The star is metal-poor ([Fe/H]=-0.9)
and overabundant in carbon and s-process elements (Decin et al. 1998;
Klochkova et al. 1999), van Winckel & Reyniers (2000)
similar to that
of other 21
m emission
(Szczerba et al. 1999). In the optical spectrum
emission bands (0, 0) and (0, 1) of the Swan system of the
C2 molecule were detected (Klochkova et al. 1999). The effective
temperature of the star from high resolution spectrum was
estimated to be 6300 K. The star is metal-poor ([Fe/H]=-0.9)
and overabundant in carbon and s-process elements (Decin et al. 1998;
Klochkova et al. 1999), van Winckel & Reyniers (2000)
similar to that
of other 21 ![]() m post-AGB stars such as IRAS 05341+0852
(Reddy et al. 1997).
m post-AGB stars such as IRAS 05341+0852
(Reddy et al. 1997).
IRAS 05113+1347
It is a 21 ![]() m carbon-rich post-AGB star (Kwok et al. 1995).
It shows C2, C3 and 11.3
m carbon-rich post-AGB star (Kwok et al. 1995).
It shows C2, C3 and 11.3
![]() emission features.
emission features.
IRAS 05170+0535
Van den Ancker et al. (1998) classified it as a low mass
young stellar object. Coulson et al. (1998) considered it as a
Vega-excess star. The G0Ve spectrum and Hipparcos parallax suggests
that it is not a post-AGB star. It is most likely a young G dwarf
at the end of the T Tauri phase. The Hipparcos parallax yields a
distance of 180 pc and a luminosity of about 1.23 ![]() .
.
IRAS 05238-0626
Its spectral type is F2II (Reddy & Parthasarathy 1996).
The photometric observations made by García-Lario et al. (1997)
and Torres et al. (1995) are in agreement with our observations.
IRAS 05341+0852
It is a post-AGB star with 21 ![]() m emission. Reddy et al. (1997),
van Winckel & Reyniers (2000)
found it to be metal-poor and overabundant in carbon
and s-process elements. It appears to have evolved from the AGB carbon star
stage to post-AGB stage only recently.
Our BVRI data of this star is in good agreement with the photometric data of
Hrivnak & Kwok (1999). However, our JHK data differ
by about 0.2 mag from the JHK data reported by
Hrivnak & Kwok (1999). They classified the low
resolution spectrum of this star and assigned a spectral type G2 0-Ia.
m emission. Reddy et al. (1997),
van Winckel & Reyniers (2000)
found it to be metal-poor and overabundant in carbon
and s-process elements. It appears to have evolved from the AGB carbon star
stage to post-AGB stage only recently.
Our BVRI data of this star is in good agreement with the photometric data of
Hrivnak & Kwok (1999). However, our JHK data differ
by about 0.2 mag from the JHK data reported by
Hrivnak & Kwok (1999). They classified the low
resolution spectrum of this star and assigned a spectral type G2 0-Ia.
IRAS 05355-0117
Its optical counterpart is HD 290764. Its spectral type
is A5III (Schild & Cowley 1971). It is considered as
a ![]() Scuti star with a full amplitude of 0.016 mag.
However, the presence of cold detached dust shell is not consistent with
the
Scuti star with a full amplitude of 0.016 mag.
However, the presence of cold detached dust shell is not consistent with
the ![]() Scuti type variability. It is likely a pre-main-sequence
star in the Orion stellar ring.
High resolution spectroscopic analysis may
help us to understand the evolutionary stage of this star.
Scuti type variability. It is likely a pre-main-sequence
star in the Orion stellar ring.
High resolution spectroscopic analysis may
help us to understand the evolutionary stage of this star.
IRAS 06013-1452
It is a high galactic latitude Ae star. Thé et al. (1994)
listed it in the catalog of Herbig Ae/Be stars. García-Lario
et al. (1997) also classified it as a Herbig Ae/Be star.
IRAS 06059-0632
It is a B3 star in the direction of
Orion OB1 association (de Geus et al. 1990).
It is listed in the Hipparcos cataloge (
![]() ).
This source is probably a nearby pre-main-sequence star and not a post-AGB
supergiant.
).
This source is probably a nearby pre-main-sequence star and not a post-AGB
supergiant.
IRAS 06060+2038
It is a low galactic latitude IRAS source with B1V star
in the direction of Gemini OB1 molecular cloud complex.
It is in the Sharpless 252 which is an extended ii II region
(Haikala 1994).
IRAS 06284-0937
Van den Ancker et al. (1998) considered it as a Herbig Ae/Be star.
It is in the Hipparcos cataloge (
![]() ).
It may be a variable star (NSV 2998).
).
It may be a variable star (NSV 2998).
IRAS 07077-1825
It is a O6 star listed in the LS catalog as LS 207 (Reed & Beatty 1995) and
is in the direction of the Sharpless 301 which is an extended
ii II region (Moffat et al. 1979).
IRAS 07131-0147
It is a bipolar object with a M5III central star
(Scarrott et al. 1990).
The evolutionary status of this star is not clear. The M5III spectral
type suggests that it may be a first ascent red giant and may
not be a post-AGB star.
IRAS 07171+1823
It is found to be very low excitation planetary nebula
with a hot (B-type) post-AGB central star (Vijapurkar et al. 1998).
It shows
nebular emission lines of [ii II] and [ii II]. The Balmer lines
are also in emission. It is a high galactic latitude hot-post-AGB
star.
IRAS 07430+1115
It is a high galactic latitude carbon-rich post-AGB star (Hrivnak & Kwok 1999). Our BVRI photometry of this star is in agreement within 0.25 mag with the photometric data reported by Hrivnak & Kwok (1999). The difference may be due to small amplitude light variations of this star.
Acknowledgements
We would like to thank Dr. B. J. Hrivnak for careful reading of this manuscript and valuable comments. We used the SIMBAD database operated at CDS, Strasbourg, France. M.P. thanks Prof. Keiichi Kodaira, Prof. Shuji Deguchi, Prof. Norio Kaifu and Prof. Hiroshi Karoji for their kind encouragement, support and hospitality.