A&A 385, 724-732 (2002)
DOI: 10.1051/0004-6361:20020148
Z. G. Zhang1 - S. Svanberg1 - P. Palmeri2 - P. Quinet2,3 - E. Biémont2,3
1 - Department of Physics, Lund Institute of Technology,
PO Box 118, 22100 Lund, Sweden
2 -
Astrophysique et Spectroscopie, Université de Mons-Hainaut,
7000 Mons, Belgium
3 -
IPNAS, Bât. B15, Université de Liège, Sart Tilman,
4000 Liège, Belgium
Received 04 July 2001 / Accepted 20 December 2001
Abstract
Selective lifetime measurements by time-resolved laser-induced fluorescence
spectroscopy for 5 levels belonging to the 4f35d configuration of doubly
ionized neodymium provide a first and useful experimental test of the
relativistic Hartree-Fock calculations in this ion of astrophysical interest.
As a consequence, the accuracy of the transition probabilities deduced
in the present work is well assessed. These new data are expected to help
astrophysicists in the future to refine the analysis of the composition
of chemically peculiar stars which frequently show large overabundances
of lanthanides when compared to the solar system standards.
Key words: atomic data - atomic processes - stars: chemically peculiar
Natural neodymium appears in the form of seven stable isotopes. According to nucleosynthesis theories, the isotopes 143 (12.2%), 144 (23.8%), 145 (8.3%) and 146 (17.2%) are produced either by the r or s process while the isotope 142 (27.1%) results from the s process and the isotopes 148 (5.8%) and 150 (5.6%) are formed by a pure r process.
Singly-ionized neodymium (Nd II) is frequently observed in astrophysical spectra (Merril 1956; Jaschek & Jaschek 1995): it has been identified in M and MS stars e.g. by Smith & Lambert (1985) and in Bp stars e.g. by Cowley & Crosswhite (1978). Some Nd II lines appear very strongly in the stars of the Cr-Eu-Sr subgroup (Adelman 1973) or in Am stars (Smith 1973, 1974). The analysis of Nd II lines leads to strong overabundances in Ba stars (Lambert 1985) or in S-type stars (Bidelman 1953). Nd II is also observed in the solar photospheric spectrum (Anders & Grevesse 1989).
Doubly ionized neodymium (Nd III), which is expected to be the dominant species in hotter stars, has been identified in the spectra of some CP stars like HR 465, HD 51418 and HD 200311 (Cowley 1976; Aikman et al. 1979; Bidelman et al. 1995) and in the spectrum of HD 192913 and HD 43819, Bp stars of the Si subgroup (Cowley & Crosswhite 1978; Ryabchikova et al. 1990). Some Nd III lines have also been found in the spectrum of HD 101065, a rapidly oscillating star also known as Przybylski's star (Cowley et al. 1998, 2000). However, the difficulty of analyzing the third spectrum of most rare earth elements (REE), including Nd III, in low resolution IUE spectra has been discussed by Cowley & Greenberg (1988) in relation to the uncertainties affecting the solar model and in relation to the lack of reliable gf-values. The new high-resolution, high signal-to-noise HST spectra now available (Leckrone et al. 1999) allow the identification of many features belonging to the doubly ionized lanthanides that emphasize the need for accurate radiative parameters for all the REE. These data are particularly important for the study of CP stars that frequently show large overabundances of lanthanides when compared to the solar system values (see e.g. Cowley 1984) and for the metal-poor galactic halo stars in relation to the early history of the galaxy (see e.g. Sneden et al. 1996).
Doubly ionized neodymium (Nd III, Z=60) belongs to the Ce I isoelectronic
sequence and has [Xe]4f4 5I4 as the ground state. Up to now,
according to the NIST compilation (Martin et al. 1978;
http://physics.nist.gov/cgi-bin/AtData), only 29 levels of this ion have
been experimentally determined. They belong to the 4f4 and to the 4f3(4I![]() ,
4F
,
4F![]() )5d configurations. They were deduced from the 9500 lines observed
between 181.0 and 871.5 nm by Crosswhite (1975, 1976). This spectrum is thus
very poorly known and in need of completion.
)5d configurations. They were deduced from the 9500 lines observed
between 181.0 and 871.5 nm by Crosswhite (1975, 1976). This spectrum is thus
very poorly known and in need of completion.
Previous transition probability calculations in Nd III are extremely scarse.
To our knowledge, the only available data have been obtained by Cowley & Bord (1998)
who calculated gf-values for the analysis of the spectra of ![]() Equulei
and HR 6870, and by Bord (2000) who performed HFR calculations having in mind
the analysis of the chemically peculiar stars HD 122970 and HD 101065.
No experimental measurements (lifetimes or transition probabilities) are available
so far for Nd III. In view of the complexity of the configurations involved
in the REE, experimental transition probabilities or radiative lifetimes are
however indispensable to test the validity of the theoretical models.
Equulei
and HR 6870, and by Bord (2000) who performed HFR calculations having in mind
the analysis of the chemically peculiar stars HD 122970 and HD 101065.
No experimental measurements (lifetimes or transition probabilities) are available
so far for Nd III. In view of the complexity of the configurations involved
in the REE, experimental transition probabilities or radiative lifetimes are
however indispensable to test the validity of the theoretical models.
The above considerations concerning the need for and the lack of radiative atomic data for the Nd2+ ion justify the present effort to improve the situation. In fact, to meet our objectives, i.e. the determination of a large number of transition probabilities of astrophysical interest as accurately as possible, we have compared laser lifetime measurements for 5 levels with theoretical values resulting from configuration interaction calculations. Although the theoretical approach used was similar to that considered by Bord (2000), the present calculation considers configuration interactions (that are vital in the complex spectrum considered here) in a more detailed way, with the consequence that the deduced transition probabilities are expected to be more accurate.
The present work is part of an extensive program of lifetime measurements in doubly ionized REE carried out at the Lund Laser Centre (LLC) in Sweden and of transition probability calculations at the Liège and Mons universities. So far, the results obtained concern about 50000 transitions of the following ions: La III (Li & Jiang 1999), La III - Lu III (Biémont et al. 1999), Ce III (Li et al. 2000), Gd III (Zhang et al. 2000), Er III (Biémont et al. 2001a), Pr III (Palmeri et al. 2001; Biémont et al. 2001b), Tm III (Li et al. 2001), Yb III (Biémont et al. 2001c), Ho III (Biémont et al. 2001d) and Eu III (Zhang et al. 2001). These new atomic data are progressively incorporated in a database of astrophysical interest, D.R.E.A.M., which is available on a web site at the address: http://www.umh.ac.be/~astro/dream.shtml and is also accessible directly through anonymous ftp at the address: umhsp02.umh.ac.be/pub/ftp_astro/dream.
The five levels of Nd III, considered in the present experiment,
belong to the configuration 4f35d and their lifetimes were measured
using two-step excitation time-resolved laser-induced fluorescence technique.
The experimental schemes followed for the measurements are summarized in Table 1.
|
Levels
|
Lower level | Upper level | Excitation | Laser | Observed |
| (cm-1) | (cm-1) |
|
mode
|
|
|
|
4f3(4F |
0.0 | 27788.2 | 359.762 | 359.8 | |
| 4f3(4F |
1137.8 | 28745.3 | 362.117 | 362.1 | |
| 4f3(4F |
2387.6 | 30232.3 | 359.032 | 359.0 | |
| 4f3(4F |
3714.9 | 31394.6 | 361.173 | 361.2 | |
| 4f3(4F |
5093.3 | 32832.6 | 360.397 | 360.4 |
The experimental set-up used in the present experiment is illustrated in Fig. 1. Nd2+ ions were produced in a laser-induced plasma using 532 nm wavelength laser pulses emitted with a 10 Hz repetition rate and 10 ns duration Nd:YAG laser (laser B) (Continuum surelite) with variable pulse energy (0-50 mJ). In order to obtain the suitable excitation, 8 ns pulses emitted by another Nd:YAG laser (laser A) (Continuum NY-82) were sent to a stimulated Brillouin scattering (SBS) compressor to shorten the pulses down to 1 ns. The laser was used to pump a dye laser (Continuum Nd-60). DCM dye was used in the experiments, and the frequency-doubling of the dye laser and further stimulated Raman scattering were obtained using a KDP crystal and a hydrogen cell.
![\begin{figure}
\par\includegraphics[width=8.8cm,clip]{fig1.eps} %\end{figure}](/articles/aa/full/2002/14/aa1642/img14.gif) |
Figure 1: Experimental set-up used for the lifetime measurements for Nd III. |
| Open with DEXTER | |
The time-resolved signal was averaged with a digital transient recorder (Tektronix model DSA 602) and the fluorescence decay curve was sent to a personal computer for lifetime determination. The lifetime evaluation was performed by fitting the fluorescence decay signal curve with an exponential function with adjustable parameters. For each level, more than 20 curves were averaged. The five lifetimes measured are reported in Table 2.
In order to be sure that the Nd2+ lines of interest were considered, the modification of the fluorescence signal as a function of the delay time was investigated. Possible flight-out-of-view effects are carefully avoided by enlarging the slit of the monochromator and choosing a suitable delay time.
As a further refinement, a magnetic field of about 60 Gauss was added in the plasma zone by a pair of Helmholtz coils in order to eliminate possible Zeeman quantum beat effects but also to weaken the background associated with the ablation laser and the plasma recombination processes.
In order to obtain a sufficiently high signal-to-noise ratio, a decay curve was obtained by averaging fluorescence photons from more than 2000 pulses. A typical decay curve is shown in Fig. 2.
![\begin{figure}
\par\includegraphics[width=8.8cm,clip]{fig2.eps}
\end{figure}](/articles/aa/full/2002/14/aa1642/img15.gif) |
Figure 2: A typical experimental time-resolved fluorescence signal from the level at 31394.6 cm-1 of Nd III. The lifetime deduced from the fit was 70 ns. The departure from the straight line for values larger than 300 ns is due to the increasing importance of noise. |
| Open with DEXTER | |
It has been shown in many previous papers (see e.g. the references quoted at the end of Sect. 1) that, for heavy ions such as singly or doubly ionized REE, the consideration of both intravalence and core-valence correlation is essential for atomic structure calculations. The detailed consideration of configuration interaction effects in complex configurations with an open f shell severely limits the choice of a theoretical method for performing the calculations for the 4f4-4f35d transitions in Nd III. In particular, the use of a fully ab initio relativistic approach like the MCDF method must be ruled out in view of the huge number of relativistic states involved and in view of the unrealistic amount of computer time needed for the calculations. In fact, up to now, the various attempts to use the MCDF method for complex situations such as the one considered here have failed. A versatile alternative, which has appeared usable and leads to accurate results (i.e. generally in agreement within a few percent with experimental data obtained with laser techniques) in many different situations, is the relativistic Hartree-Fock technique (HFR) as described and coded by Cowan (1981) but modified for the inclusion of core-polarization effects (see e.g. Palmeri et al. 2000). The lack of convergence problems and the reasonable computer time needed has led us to adopt this approach here.
Detailed comparisons between theoretical calculations and experiment in Er III (Biémont et al. 2001a) and Tm III (Li et al. 2001) have emphasized the fact that the 4f-5d transitions deserve special attention in lanthanides in relation to the fact that 4f electrons are deeply imbedded inside the 5s25p6 closed shells of the xenon core. A difficulty arises because the analytical core-polarization and core-penetration corrections to the dipole operator are no longer valid (see e.g. Quinet et al. 1999). A possible solution is to apply an empirical scaling factor to the uncorrected <4f|r|5d> radial matrix element. Although this semi-empirical approach could be useful, it was not followed in the present work. Instead, we have preferred to introduce in the model explicit interactions between the configurations of interest (i.e. 4f4 and 4f35d) and some higher configurations with three, two or one electron(s) in the 4f subshell. More precisely, configuration interaction was explicitly retained among the configurations 4f4 + 4f36p + 4f35f + 4f36f + 4f25d2 + 4f26s2 + 4f26p2 + 4f25d6s and 4f35d + 4f36d + 4f36s + 4f25d6p + 4f26s6p + 4f5d3 + 4f5d26s + 4f5d6s2. These configuration lists extend considerably those considered by Bord (2000) (i.e. 4f4+ 4f25d2 + 4f25d6s + 4f36p and 4f35d + 4f36s) and are expected to include the most important effects due to intravalence and core-valence correlation. The core-core correlation could a priori be tested by considering the one- and two-electron excitations from the 5s and 5p subshells to 4f but this was prevented, in the present work, by the computer limitations.
 |
The HFR method was combined with a least-squares optimization routine minimizing
the discrepancies between observed and calculated energy levels.
More precisely, the average energy (
![]() )
and the spin-orbit integral
(
)
and the spin-orbit integral
(![]()
![]() )
were adjusted using the five 4f4 levels within the 5I multiplet.
The average energy (
)
were adjusted using the five 4f4 levels within the 5I multiplet.
The average energy (
![]() ), the Slater parameters (
), the Slater parameters (![]() ,
,
![]() )
and the spin-orbit integrals (
)
and the spin-orbit integrals (![]()
![]() ,
,
![]()
![]() )
were optimized using the twenty-four
experimental 4f35d levels taken from the NIST compilation (Martin et al. 1978).
The effective interaction operators (
)
were optimized using the twenty-four
experimental 4f35d levels taken from the NIST compilation (Martin et al. 1978).
The effective interaction operators (![]() ,
,
![]() and
and ![]() )
could not be
included in the fitting procedure of 4f35d levels because of the lack of
experimental level values in this configuration. The radial parameters adopted
in the present calculations are reported in Table 3. For the other configurations
(for which no experimental levels are available), a scaling factor of 0.85 was
applied to the
)
could not be
included in the fitting procedure of 4f35d levels because of the lack of
experimental level values in this configuration. The radial parameters adopted
in the present calculations are reported in Table 3. For the other configurations
(for which no experimental levels are available), a scaling factor of 0.85 was
applied to the ![]() ,
,
![]() and
and ![]() integrals in order to partly take
into account interaction with distant configurations not included explicitly
in the physical model, according to a well-established procedure.
In addition, the average energies were adjusted to reproduce the energies
predicted by Brewer (1971) for the lowest level of each configuration,
i.e. 4f36p 5K5 (
integrals in order to partly take
into account interaction with distant configurations not included explicitly
in the physical model, according to a well-established procedure.
In addition, the average energies were adjusted to reproduce the energies
predicted by Brewer (1971) for the lowest level of each configuration,
i.e. 4f36p 5K5 (
![]() cm-1), 4f25d2 5L6(
cm-1), 4f25d2 5L6(
![]() cm-1), 4f25d6s 5K5 (
cm-1), 4f25d6s 5K5 (
![]() cm-1),
4f26s2 3H4 (
cm-1),
4f26s2 3H4 (
![]() cm-1), 4f26p2 5I4(
cm-1), 4f26p2 5I4(
![]() cm-1), 4f36s 5I
cm-1), 4f36s 5I
![]() (
(
![]() cm-1),
4f25d6p 5L
cm-1),
4f25d6p 5L
![]() (
(
![]() cm-1) and 4f26s6p 5I
cm-1) and 4f26s6p 5I
![]() (
(
![]() cm-1).
cm-1).
The calculated energy levels are compared with experiments, when available,
in Table 4 for odd-parity levels below 33000 cm-1. In view of the
very good agreement between theory and experiment (the mean deviation is 0.23%),
the new calculated levels are expected to be reliable to a few tens of percent and,
consequently, can be used to support future analysis and identification work.
We report also in Table 4 the calculated Landé g-factors.
They agree well with the values calculated by Bord (2000):
![]() for 34 odd levels, the largest discrepancies appearing, as expected, for the
strongly perturbed levels:
for 34 odd levels, the largest discrepancies appearing, as expected, for the
strongly perturbed levels:
![]() ,
27788.2 and 29397.3 cm-1.
There are no other g-factors available for comparison.
,
27788.2 and 29397.3 cm-1.
There are no other g-factors available for comparison.
| Config. | Parameter | Ab initio | Fit | Fit/ab initio |
| (cm-1) | (cm-1) | |||
| 4f4 |
|
35392 | ||
| F2(4f,4f) | 92635 | 78740 | 0.850
|
|
| F4(4f,4f) | 57680 | 49028 | 0.850
|
|
| F6(4f,4f) | 41373 | 35167 | 0.850
|
|
|
|
849 | 780 | 0.919 | |
| 4f35d |
|
43230 | ||
| F2(4f,4f) | 101378 | 64485 | 0.636 | |
| F4(4f,4f) | 63552 | 65286 | 1.027 | |
| F6(4f,4f) | 54705 | 28855 | 0.631 | |
|
|
947 | 898 | 0.948 | |
|
|
831 | 755 | 0.909 | |
| F2(4f,5d) | 26408 | 16541 | 0.626 | |
| F4(4f,5d) | 13021 | 8809 | 0.677 | |
| G1(4f,5d) | 12823 | 9161 | 0.714 | |
| G3(4f,5d) | 10202 | 4251 | 0.417 | |
| G5(4f,5d) | 7735 | 9805 | 1.268 |
| Config. | J |
|
|
|
|
Eigenvector composition
|
| (cm-1) | (cm-1) | (cm-1) | ||||
| 4f35d | 6 | 15290 | 0.724 | 93% (4I |
||
| 4f35d | 5 | 15262.2 | 15322 | -60 | 0.683 | 90% (4I |
| 4f35d | 6 | 16938.1 | 16944 | -6 | 0.910 | 95% (4I |
| 4f35d | 7 | 17077 | 0.915 | 96% (4I |
||
| 4f35d | 7 | 18656.3 | 18628 | 28 | 1.053 | 97% (4I |
| 4f35d | 4 | 18883.7 | 18819 | 65 | 0.625 | 88% (4I |
| 4f35d | 8 | 18980 | 1.043 | 98% (4I |
||
| 4f35d | 3 | 19211.0 | 19271 | -60 | 0.547 | 77% (4I |
| 4f35d | 5 | 19740 | 0.887 | 40% (4I |
||
| 4f35d | 4 | 20144.3 | 20082 | 62 | 0.871 | 64% (4I |
| 4f35d | 2 | 20218 | 0.343 | 94% (4I |
||
| 4f35d | 8 | 20410.9 | 20373 | 38 | 1.149 | 96% (4I |
| 4f35d | 5 | 20388.9 | 20388 | 1 | 0.936 | 56% (4I |
| 4f35d | 3 | 20560 | 0.870 | 77% (4I |
||
| 4f35d | 6 | 20822 | 1.029 | 33% (4I |
||
| 4f35d | 9 | 20975 | 1.133 | 99% (4I |
||
| 4f35d | 4 | 21183 | 1.034 | 51% (4I |
||
| 4f35d | 5 | 21886.8 | 21878 | 9 | 1.021 | 61% (4I |
| 4f35d | 6 | 22047.8 | 22048 | 0 | 1.088 | 60% (4I |
| 4f35d | 9 | 22197.0 | 22171 | 26 | 1.217 | 95% (4I |
| 4f35d | 4 | 22438 | 0.934 | 39% (4I |
||
| 4f35d | 7 | 22702.9 | 22665 | 37 | 1.151 | 61% (4I |
| 4f35d | 5 | 22787 | 1.215 | 71% (4I |
||
| 4f35d | 6 | 22918 | 0.991 | 47% (4I |
||
| 4f35d | 10 | 23041 | 1.199 | 99% (4I |
||
| 4f35d | 7 | 23694 | 0.891 | 82% (4I |
||
| 4f35d | 6 | 23819.3 | 23953 | -134 | 1.075 | 38% (4I |
| 4f35d | 3 | 24034 | 0.771 | 72% (4I |
||
| 4f35d | 7 | 24003.2 | 24093 | -90 | 1.196 | 33% (4I |
| 4f35d | 6 | 24481 | 1.295 | 79% (4I |
||
| 4f35d | 8 | 24686.4 | 24605 | 81 | 1.230 | 84% (4I |
| 4f35d | 5 | 24653 | 1.067 | 51% (4I |
||
| 4f35d | 7 | 25039 | 1.123 | 45% (4I |
||
| 4f35d | 0 | 25883 | 33% (4F |
|||
| 4f35d | 8 | 25894 | 1.020 | 84% (4I |
||
| 4f35d | 7 | 26120 | 1.139 | 43% (4I |
||
| 4f35d | 6 | 26503.2 | 26564 | -61 | 1.178 | 48% (4I |
| 4f35d | 4 | 26608 | 1.049 | 79% (4I |
||
| 4f35d | 1 | 26787 | 1.489 | 42% (4F |
||
| 4f35d | 2 | 27295 | 1.446 | 41% (4S |
||
| 4f35d | 8 | 27391.4 | 27300 | 91 | 1.138 | 71% (4I |
| 4f35d | 3 | 27569.8 | 27433 | 137 | 1.085 | 26% (4F |
| 4f35d | 2 | 27525 | 0.395 | 83% (4F |
||
| 4f35d | 3 | 27788.2 | 27749 | 39 | 0.873 | 53% (4F |
| 4f35d | 9 | 28109 | 1.114 | 83% (4I |
||
| 4f35d | 3 | 28532 | 0.921 | 85% (4F |
||
| 4f35d | 4 | 28657 | 1.249 | 29% (4F |
||
| 4f35d | 4 | 28745.3 | 28839 | -94 | 1.102 | 56% (4F |
| 4f35d | 5 | 29204 | 1.194 | 84% (4I |
||
| 4f35d | 0 | 29361 | 43% (4F |
|||
| 4f35d | 4 | 29440 | 1.132 | 78% (4F |
||
| 4f35d | 5 | 29397.3 | 29519 | -122 | 1.036 | 31% (4F |
| 4f35d | 6 | 29626 | 1.018 | 23% (2H |
||
| 4f35d | 1 | 29840 | 1.273 | 29% (4F |
||
| 4f35d | 2 | 29991 | 1.191 | 20% (4F |
||
| 4f35d | 5 | 30232.3 | 30198 | 34 | 1.142 | 49% (4F |
| 4f35d | 1 | 30298 | 1.057 | 51% (4F |
||
| 4f36s | 4 | 30431 | 0.611 | 92% (4I |
| Config. | J |
|
|
|
|
Eigenvector composition
|
| (cm-1) | (cm-1) | (cm-1) | ||||
| 4f35d | 3 | 30702 | 1.116 | 13% (4S |
||
| 4f35d | 1 | 30768 | 1.420 | 28% (4F |
||
| 4f35d | 2 | 30860 | 1.118 | 75% (4F |
||
| 4f35d | 5 | 30898 | 1.009 | 30% (4F |
||
| 4f35d | 4 | 30918 | 0.884 | 31% (4F |
||
| 4f35d | 2 | 30921 | 1.336 | 49% (4F |
||
| 4f35d | 6 | 30931 | 1.069 | 38% (2H |
||
| 4f35d | 3 | 30989 | 1.329 | 38% (4F |
||
| 4f36s | 5 | 31268 | 0.924 | 46% (4I |
||
| 4f35d | 3 | 31371 | 1.247 | 33% (4F |
||
| 4f35d | 6 | 31394.6 | 31378 | 17 | 1.211 | 70% (4F |
| 4f35d | 2 | 31639 | 1.053 | 17% (4S |
||
| 4f35d | 3 | 31733 | 1.220 | 53% (4F |
||
| 4f35d | 7 | 31860 | 1.125 | 36% (2H |
||
| 4f35d | 4 | 31866 | 0.907 | 27% (4G |
||
| 4f35d | 1 | 31924 | 1.083 | 35% (4S |
||
| 4f35d | 4 | 32137 | 0.798 | 51% (4G |
||
| 4f35d | 0 | 32178 | 45% (4F |
|||
| 4f35d | 3 | 32218 | 1.180 | 26% (4F |
||
| 4f35d | 2 | 32323 | 1.266 | 28% (4S |
||
| 4f35d | 5 | 32330 | 1.147 | 23% (4F |
||
| 4f35d | 4 | 32336 | 1.199 | 64% (4F |
||
| 4f35d | 6 | 32444 | 1.109 | 36% (2H |
||
| 4f35d | 2 | 32589 | 1.015 | 39% (2H |
||
| 4f36s | 6 | 32792 | 1.060 | 64% (4I |
||
| 4f35d | 7 | 32832.6 | 32818 | 15 | 1.178 | 53% (4F |
| 4f35d | 1 | 32830 | 1.121 | 26% (4F |
||
| 4f35d | 4 | 32848 | 1.217 | 40% (4F |
||
| 4f36s | 5 | 32959 | 0.962 | 34% (4I |
|
|
|
|
Lower level | Upper level | log gf | gA(1) | gA(2) | |||||||||
| 328.367 | 2387.6 | (e) | 6.0 | 32832.6 | (o) | 7.0 | -3.25 | 3.50E+05 | 3.94E+05 | |||||
| 330.409 | 1137.8 | (e) | 5.0 | 31394.6 | (o) | 6.0 | -3.30 | 3.06E+05 | 3.54E+05 | |||||
| 330.677 | 0.0 | (e) | 4.0 | 30232.3 | (o) | 5.0 | -3.35 | 2.70E+05 | 2.78E+05 | |||||
| 343.335 | 3714.9 | (e) | 7.0 | 32832.6 | (o) | 7.0 | -1.65 | 1.28E+07 | 1.44E+07 | |||||
| 343.609 | 1137.8 | (e) | 5.0 | 30232.3 | (o) | 5.0 | -1.64 | 1.30E+07 | 1.34E+07 | |||||
| 344.646 | 2387.6 | (e) | 6.0 | 31394.6 | (o) | 6.0 | -1.64 | 1.29E+07 | 1.49E+07 | |||||
| 347.783 | 0.0 | (e) | 4.0 | 28745.3 | (o) | 4.0 | -1.97 | 6.00E+06 | 3.81E+06 | |||||
| 353.762 | 1137.8 | (e) | 5.0 | 29397.3 | (o) | 5.0 | -2.65 | 1.22E+06 | ||||||
| 359.032 | 2387.6 | (e) | 6.0 | 30232.3 | (o) | 5.0 | -0.77 | 8.74E+07 | 8.99E+07 | |||||
| 359.762 | 0.0 | (e) | 4.0 | 27788.2 | (o) | 3.0 | -0.91 | 6.35E+07 | 6.35E+07 | |||||
| 360.397 | 5093.3 | (e) | 8.0 | 32832.6 | (o) | 7.0 | -0.62 | 1.24E+08 | 1.40E+08 | |||||
| 361.173 | 3714.9 | (e) | 7.0 | 31394.6 | (o) | 6.0 | -0.54 | 1.46E+08 | 1.69E+08 | |||||
| 362.117 | 1137.8 | (e) | 5.0 | 28745.3 | (o) | 4.0 | -0.82 | 7.68E+07 | 4.88E+07 | |||||
| 362.612 | 0.0 | (e) | 4.0 | 27569.8 | (o) | 3.0 | -1.20 | 3.16E+07 | ||||||
| 370.132 | 2387.6 | (e) | 6.0 | 29397.3 | (o) | 5.0 | -1.05 | 4.38E+07 | ||||||
| 394.126 | 1137.8 | (e) | 5.0 | 26503.2 | (o) | 6.0 | -3.75 | 7.60E+04 | ||||||
| 414.552 | 2387.6 | (e) | 6.0 | 26503.2 | (o) | 6.0 | -2.70 | 7.83E+05 | ||||||
| 422.241 | 3714.9 | (e) | 7.0 | 27391.4 | (o) | 8.0 | -2.74 | 6.83E+05 | ||||||
| 438.698 | 3714.9 | (e) | 7.0 | 26503.2 | (o) | 6.0 | -2.38 | 1.46E+06 | ||||||
| 440.764 | 1137.8 | (e) | 5.0 | 23819.3 | (o) | 6.0 | -3.62 | 8.29E+04 | ||||||
| 448.343 | 5093.3 | (e) | 8.0 | 27391.4 | (o) | 8.0 | --1.34 | 1.51E+07 | ||||||
| 456.768 | 0.0 | (e) | 4.0 | 21886.8 | (o) | 5.0 | -3.28 | 1.66E+05 | ||||||
| 462.499 | 2387.6 | (e) | 6.0 | 24003.2 | (o) | 7.0 | -1.98 | 3.33E+06 | ||||||
| 466.468 | 2387.6 | (e) | 6.0 | 23819.3 | (o) | 6.0 | -3.28 | 1.62E+05 | ||||||
| 476.704 | 3714.9 | (e) | 7.0 | 24686.4 | (o) | 8.0 | -1.71 | 5.65E+06 | ||||||
| 478.106 | 1137.8 | (e) | 5.0 | 22047.8 | (o) | 6.0 | -1.69 | 6.03E+06 | ||||||
| 490.326 | 0.0 | (e) | 4.0 | 20388.9 | (o) | 5.0 | -1.83 | 4.13E+06 | ||||||
| 492.102 | 2387.6 | (e) | 6.0 | 22702.9 | (o) | 7.0 | -1.77 | 4.66E+06 | ||||||
| 492.757 | 3714.9 | (e) | 7.0 | 24003.2 | (o) | 7.0 | -0.83 | 4.08E+07 | ||||||
| 496.280 | 0.0 | (e) | 4.0 | 20144.3 | (o) | 4.0 | -3.45 | 9.53E+04 | ||||||
| 497.265 | 3714.9 | (e) | 7.0 | 23819.3 | (o) | 6.0 | -1.26 | 1.52E+07 | ||||||
| 508.500 | 2387.6 | (e) | 6.0 | 22047.8 | (o) | 6.0 | -0.66 | 5.71E+07 | ||||||
| 510.242 | 5093.3 | (e) | 8.0 | 24686.4 | (o) | 8.0 | -0.38 | 1.05E+08 | ||||||
| 512.699 | 2387.6 | (e) | 6.0 | 21886.8 | (o) | 5.0 | -1.08 | 2.11E+07 | ||||||
| 519.306 | 1137.8 | (e) | 5.0 | 20388.9 | (o) | 5.0 | -0.75 | 4.42E+07 | ||||||
| 520.390 | 0.0 | (e) | 4.0 | 19211.0 | (o) | 3.0 | -1.19 | 1.60E+07 | ||||||
| 525.989 | 1137.8 | (e) | 5.0 | 20144.3 | (o) | 4.0 | -1.12 | 1.83E+07 | ||||||
| 526.502 | 3714.9 | (e) | 7.0 | 22702.9 | (o) | 7.0 | -0.66 | 5.30E+07 | ||||||
| 528.676 | 5093.3 | (e) | 8.0 | 24003.2 | (o) | 7.0 | -1.51 | 7.41E+06 | ||||||
| 529.410 | 0.0 | (e) | 4.0 | 18883.7 | (o) | 4.0 | -0.65 | 5.23E+07 | ||||||
| 545.316 | 3714.9 | (e) | 7.0 | 22047.8 | (o) | 6.0 | -3.85 | 3.19E+04 | ||||||
| 563.354 | 1137.8 | (e) | 5.0 | 18883.7 | (o) | 4.0 | -2.06 | 1.82E+06 | ||||||
| 567.715 | 5093.3 | (e) | 8.0 | 22702.9 | (o) | 7.0 | -1.41 | 8.02E+06 | ||||||
| 584.507 | 5093.3 | (e) | 8.0 | 22197.0 | (o) | 9.0 | -1.13 | 1.44E+07 | ||||||
| 598.780 | 3714.9 | (e) | 7.0 | 20410.9 | (o) | 8.0 | -1.22 | 1.13E+07 | ||||||
| 614.507 | 2387.6 | (e) | 6.0 | 18656.3 | (o) | 7.0 | -1.29 | 9.05E+06 | ||||||
| 632.724 | 1137.8 | (e) | 5.0 | 16938.1 | (o) | 6.0 | -1.36 | 7.31E+06 | ||||||
| 652.664 | 5093.3 | (e) | 8.0 | 20410.9 | (o) | 8.0 | -2.36 | 6.77E+05 | ||||||
| 655.033 | 0.0 | (e) | 4.0 | 15262.2 | (o) | 5.0 | -1.44 | 5.73E+06 | ||||||
| 669.097 | 3714.9 | (e) | 7.0 | 18656.3 | (o) | 7.0 | -2.31 | 7.21E+05 | ||||||
| 687.072 | 2387.6 | (e) | 6.0 | 16938.1 | (o) | 6.0 | -2.44 | 5.13E+05 | ||||||
| 707.799 | 1137.8 | (e) | 5.0 | 15262.2 | (o) | 5.0 | -2.73 | 2.53E+05 | ||||||
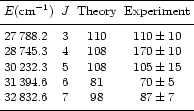
Experimental and theoretical radiative lifetimes obtained in the present work
are compared in Table 2. As seen from the table, the agreement between both
sets of values is very good, the average percentage error being 7.7% without
the 28745.3 cm-1 level, and 13.5% with it. For this level,
the calculated lifetime (
![]() ns) is a factor of 1.6 shorter
than the measurement (
ns) is a factor of 1.6 shorter
than the measurement (
![]() ns). There is no clear
reason for this discrepancy. It could possibly be attributed to a wrong
intermediate coupling representation of the calculated eigenvector,
the level appearing strongly mixed (see Table 4). However, some of the levels,
for which the agreement with experiment is good, also appear strongly mixed.
ns). There is no clear
reason for this discrepancy. It could possibly be attributed to a wrong
intermediate coupling representation of the calculated eigenvector,
the level appearing strongly mixed (see Table 4). However, some of the levels,
for which the agreement with experiment is good, also appear strongly mixed.
The computed oscillator strengths (log gf) and transition probabilities (gA)
are listed in Table 5 alongside the lower and upper experimental energy levels
of the transitions and the air wavelengths in nm. These wavelengths were derived
from the Nd III experimental levels compiled by Martin et al. (1978).
Only transitions with log gf > -4.0 are reported in Table 5.
We give in Table 5 both the HFR gA-values calculated as above described
and also the weighted transition probabilities normalized according to the
new laser lifetime measurements. The comparison between our gf-values and
the results published by Bord (2000) is illustrated in Fig. 3. As seen
from this figure, the general agreement between both sets of values is very
gratifying (as expected because two different versions of the same code were
used). Exceptions occur for the lines at 353.7622, 370.1320, 496.2798 and 545.3159 nm.
For these transitions, our log gf-values are equal to -2.65, -1.05, -3.45 and -3.85,
respectively while the Bord's results are -3.29, -2.29, -6.08 and -7.52. However,
for the latter two lines (496.2798 and 545.3159 nm), the discrepancies are
obviously related to the fact that the line strengths are affected by
severe cancellation effects. Indeed, the cancellation factor (CF), as defined by Cowan
(1981), is generally smaller than 0.01 in both calculations for these two transitions.
For the lines at 353.7622 and 370.1320 nm, the discrepancies between our calculated
oscillator strengths and Bord's results could be due to the fact that the upper
4f35d level, situated at 29397.3 cm-1, is strongly mixed
(31% (4F![]() )5d 5H
)5d 5H![]() + 14% (2H
+ 14% (2H![]() )5d 3I
)5d 3I![]() +
12% (4F
+
12% (4F![]() )5d 5G
)5d 5G![]() in our calculation) and is probably very
sensitive to small differences in the eigenvector compositions.
in our calculation) and is probably very
sensitive to small differences in the eigenvector compositions.
For the reasons stated above, the present set of transition probabilities is expected to be the most accurate presently available. The detailed results are available in the database mentioned at the end of Sect. 1.
![\begin{figure}
\par\includegraphics[width=8.8cm,clip]{Fig3.eps}
\end{figure}](/articles/aa/full/2002/14/aa1642/img50.gif) |
Figure 3: Comparison of the HFR oscillator strengths obtained in this work with those published by Bord (2000). |
| Open with DEXTER | |
The information concerning the occurence of the third spectra of the REE
in stellar sources is rather scarse and scattered through the literature
although the presence of these ions in stellar spectra has long been
recognized (Swings 1944; Adelman 1974; Cowley 1976). Some systematic
searches have nevertheless been undertaken (see e.g. Cowley & Greenberg 1988)
and, more recently, the satellite spectra have stimulated new investigations
of these ions: Copernicus spectra of ![]() 2CVn or BUSS spectra of
the same star have been investigated by Leckrone (1976) and by Hensberge et al.
(1986), respectively. IUE spectra of HD 51418 have been considered by Adelman & Shore (1981).
2CVn or BUSS spectra of
the same star have been investigated by Leckrone (1976) and by Hensberge et al.
(1986), respectively. IUE spectra of HD 51418 have been considered by Adelman & Shore (1981).
Although Nd II is expected to be the dominant species in cold CP stars, it is important to compare the abundances derived from this ion to those obtained from the consideration of Nd III lines in order to get information on eventual non-LTE effects or on possible element stratification in the stellar atmospheres (Proffitt et al. 1999). In addition, the lines of doubly ionized REE are expected to be stronger in hotter stars where the doubly ionized elements could be dominant but the identification of the lines and the abundance work, in many cases, has been performed in the past or is still prevented by the lack of reliable atomic data.
As pointed out in the introduction, Nd III has been identified or mentioned
as possibly present in a number of stars: HR 465, HD 51418, HD 200311
(Cowley 1976; Aikman et al. 1979; Bidelman et al. 1995),
HD 192913 (Cowley & Crosswhite 1978; Ryabchikova et al. 1990),
HD 101065 (Cowley et al. 1998) but the identification can
be complicated by problems of different types. The identification
of lanthanides in stars showing strong Si II lines is made difficult by
the fact that only a few stars are known which show very sharp lines.
According to Cowley (1976), Nd III is strong in the spectrum of HR 465 but,
in ![]() CrB, the coincidences are indicated as marginally significant,
the author insisting however upon the fact that the strong Nd III
lines appear shortward of the Balmer jump and, consequently, that
his study is not well suited for the detection of this ion.
CrB, the coincidences are indicated as marginally significant,
the author insisting however upon the fact that the strong Nd III
lines appear shortward of the Balmer jump and, consequently, that
his study is not well suited for the detection of this ion.
For HD 101065, Bord (2000) has deduced an abundance of neodymium 5000 larger than the solar result, a value similar to that deduced from an analysis of Nd II lines; this result has to be reduced by 0.7-0.8 dex if the surface magnetic field is taken into account. The analysis by Ryabchikova et al. (2000) of the cool roAp star HD 122970, based on the gf-values of Bord (2000), leads to an overabundance of Nd by a factor of about 275 relative to the solar abundance. We did not try to correct the results of these two analyses on the basis of the new gf-values obtained in the present work because the detailed list of the transitions considered is not available in the corresponding papers. Nevertheless, on the basis of the general agreement of the two sets of data observed in Fig. 1, the general conclusions of Bord (2000) remain valid. The main improvement due to the present work is the fact that these results are now firmly established on the basis of the laser experimental results.
In conclusion, as an extrapolation of the present work, it is expected that, in the future, the new transition probabilities now available for Nd III will make possible more reliable quantitative analysis of stellar spectra of CP stars.
Acknowledgements
This work was financially supported by the Swedish Natural Science Research Council and by the EU-TMR access to Large-Scale facility programme (contract HPRI-CT-1999-00041). Financial support from the Belgian FNRS is acknowledged by E.B., P.P. and P.Q.