A&A 384, 743-762 (2002)
DOI: 10.1051/0004-6361:20011779
R. M. Athreya1,5,6 - Y. Mellier1,2 - L. van Waerbeke3 - R. Pelló4 - B. Fort1 - M. Dantel-Fort2
1 - Institut d'Astrophysique de Paris, 98bis boulevard
Arago, 75014 Paris, France
2 -
Observatoire de Paris, DEMIRM, 61 Av. de
l'Observatoire, 75014 Paris, France
3 -
Canadian Institute for Theoretical Astrophysics, 60 St
George Str., Toronto, M5S 3H8, Canada
4 -
Observatoire Midi-Pyrénées, UMR 5572, 14 avenue
Édouard Belin, 31400 Toulouse, France
5 -
European Southern Observatory, Alonso de Cordova 3107, Vitacura, Casilla
19001, Santiago, Chile
6 -
Departamento de Astronomia y Astrofisica, Pontificia Universidad
Catolica, Casilla 104, Santiago 22, Chile
Received 4 October 1999 / Accepted 5 December 2001
Abstract
We present a gravitational lensing analysis of the cluster of
galaxies MS 1008-1224 (z=0.31), based on very deep observations obtained using
the VLT with FORS1 and ISAAC during the science verification phase. Two
different mass reconstruction algorithms were applied to the B-, V-, R- and
I-band data to obtain similar projected mass distributions in all the bands.
The FORS1 (BVRI) and ISAAC (JK) data were combined to determine the photometric
redshift distribution of galaxies within the ISAAC field and to estimate the
mass. We inferred from weak shear a
minimum mass
of
![]()
![]() on large scales (within
on large scales (within ![]() 700 h-1 kpc, diameter) which agrees well with the X-ray mass mass
estimate. The Mass-to-light ratios are also in excellent agreement. The
observed mass profile is consistent with Pseudo-Isothermal Sphere models as
well as a Navarro, Frenk and White model.
In the inner regions the lensing mass is about twice as high as the X-ray
mass which supports the long-held view that complex physical processes occuring
in the innermost parts of lensing-clusters are mainly responsible for the
X-ray-lensing mass discrepancy. We found that the central part of the cluster
comprises two mass peaks whose center of mass is located 10-20 arcsec north of
the cD galaxy. A similar offset between the cD and the peak of the X-ray
distribution has been reported before. The optical, X-ray and the mass
distributions show that MS 1008-1224 is composed of several subsystems which
are probably undergoing a merger. It is likely that the gas is not in
equilibrium in the innermost regions which vitiates the X-ray mass estimate
there.
We discovered that MS 1008-1224 shows a remarkable case of cluster-cluster
lensing. The photometric redshifts show an excess of galaxies located 30 arcsec south-west of the cD galaxy at a redshift of
700 h-1 kpc, diameter) which agrees well with the X-ray mass mass
estimate. The Mass-to-light ratios are also in excellent agreement. The
observed mass profile is consistent with Pseudo-Isothermal Sphere models as
well as a Navarro, Frenk and White model.
In the inner regions the lensing mass is about twice as high as the X-ray
mass which supports the long-held view that complex physical processes occuring
in the innermost parts of lensing-clusters are mainly responsible for the
X-ray-lensing mass discrepancy. We found that the central part of the cluster
comprises two mass peaks whose center of mass is located 10-20 arcsec north of
the cD galaxy. A similar offset between the cD and the peak of the X-ray
distribution has been reported before. The optical, X-ray and the mass
distributions show that MS 1008-1224 is composed of several subsystems which
are probably undergoing a merger. It is likely that the gas is not in
equilibrium in the innermost regions which vitiates the X-ray mass estimate
there.
We discovered that MS 1008-1224 shows a remarkable case of cluster-cluster
lensing. The photometric redshifts show an excess of galaxies located 30 arcsec south-west of the cD galaxy at a redshift of ![]() 0.9. This distant
cluster is therefore also lensed by MS 1008-1224, which, if confirmed with
spectroscopic data, would make this the first known case of magnification of a
distant cluster by another one.
0.9. This distant
cluster is therefore also lensed by MS 1008-1224, which, if confirmed with
spectroscopic data, would make this the first known case of magnification of a
distant cluster by another one.
Key words: cosmology: dark matter - gravitational lensing - galaxies: clusters: individual: MS 1008-1224
The analysis of the distribution of dark matter in clusters of galaxies provides
an important insight into the history of structure formation in the Universe.
Their epoch of formation and their evolution with redshift are
dependent on cosmological parameters and the nature of (dark) matter.
In particular, it is widely believed that the existence of even a few massive
clusters at redshift
![]() will be a strong indicator of a low mass
density universe (e.g. Bahcall et al. 1997).
will be a strong indicator of a low mass
density universe (e.g. Bahcall et al. 1997).
It is essential that we develop reliable tools to probe the amount and distribution of each matter component and follow their evolution with redshift. Gravitational lensing and bremsstrahlung emission from hot intra-cluster gas are two processes which help us in addressing these issues. Unfortunately, the results from these two approaches have not always been consistent with each other.
Indeed, X-ray mass estimates show discrepancies with weak- and strong-lensing mass estimates of clusters of galaxies. The reasons for the discrepancy are not yet fully understood (see Mellier 1999 for a review). The total mass inferred from lensing exceeds the X-ray mass by a factor of about two for some clusters including well studied ones like A2218 (Miralda-Escudé & Babul 1995). Investigations of a dozen clusters by Smail et al. (1997), Allen (1998) and Lewis et al. (1999) have not provided conclusive answers. Allen (1998) compared cooling flow and non-cooling flow clusters and observed that the former do not show the mass discrepancy. This result suggests that the assumptions regarding the dynamical and thermal state of the hot intra-cluster gas, a key ingredient for the X-ray mass estimate, are not realistic enough for a satisfactory model of non-cooling flow (i.e. presumably non-relaxed) clusters of galaxies. This interpretation was reinforced by Böhringer et al. (2000) and Allen et al. (2001) who found an excellent agreement between the X-ray data from ROSAT and Chandra and the strong- and weak-lensing analyses of the relaxed cluster A2390. However, Lewis et al. (1999) found significant discrepancies even in some cooling flow clusters between the X-ray and lensing mass, particularly with strong-lensing estimates.
It is likely that this mass discrepancy is the result of several less-than-valid assumptions. For example, the comparison between X-ray and weak gravitational lensing is done by extrapolating the best fit of the X-ray profile far beyond the region where data are reliable, where uncertainties are obviously significant and the shape of the (assumed) analytical profile used for extrapolation has a considerable impact on the mass estimate (Lewis et al. 1999; Böhringer et al. 1999).
Lensing mass estimates are not free from bias either. N-body simulations by Cen (1997) and Metzler et al. (1999) show that projection effects of in-falling filaments of matter towards the cluster centre can significantly bias the projected mass density inferred from weak lensing analysis to values higher than those derived from X-ray. Estimates of the bias are typically between 10 and 20 per cent but projection effects due to structures along the line of sight can overestimate the total mass by about 30 per cent (Reblinsky & Bartelmann 1999). It is therefore important to improve the accuracy of weak-lensing mass estimates by minimising systematic errors in particular. This will help us in identifying the assumptions in the X-ray analysis which are responsible for the mass discrepancy as opposed to errors which have their origins in the lensing analysis.
Very deep observations of clusters of galaxies in multiple bands and with
sub-arcsecond seeing can considerably improve the reliability of mass estimates
from weak lensing; the depth increases the number density of lensed galaxies
thereby improving the resolution of the mass reconstruction; multicolour
observations allow estimation of photometric redshifts and hence the redshift
distribution of background sources; finally, sub-arcsecond seeing makes for a
better determination of object shapes and accurate PSF correction. Rarely are
all of these stringent requirements satisfied simultaneously in ground based
observations. Fortunately, the observations obtained during the Science
Verification Programme![]() for the FORS1 (FOcal Reducer/low dispersion
Spectrograph; Appenzeller et al. 1998) and the ISAAC (Infrared Spectrometer and
Array Camera; Moorwood et al. 1999) instruments mounted on the first VLT unit,
UT1/ANTU, at Paranal provide an excellent dataset on the lensing cluster MS
1008-1224. The quality (seeing and depth in 6 bands) of these images
are among the best data ever obtained from the ground for weak lensing mass
reconstruction of a cluster.
for the FORS1 (FOcal Reducer/low dispersion
Spectrograph; Appenzeller et al. 1998) and the ISAAC (Infrared Spectrometer and
Array Camera; Moorwood et al. 1999) instruments mounted on the first VLT unit,
UT1/ANTU, at Paranal provide an excellent dataset on the lensing cluster MS
1008-1224. The quality (seeing and depth in 6 bands) of these images
are among the best data ever obtained from the ground for weak lensing mass
reconstruction of a cluster.
MS 1008-1224 is a galaxy cluster selected from the Einstein Medium Sensitivity
Survey (Gioia & Luppino 1994). It is one of the 16 EMSS clusters observed by Le Fèvre et al. (1994) in which they found strong-lensing features. The cluster is
at redshift z=0.3062 (Lewis et al. 1999) and is dominated by a cD galaxy. The
X-ray luminosity is ![]() (0.3-3.5 keV
(0.3-3.5 keV
![]() ergs-1 (From
Lewis et al. 1999, with H0=100 km s-1 Mpc-1 and q0=0.1) and its
temperature inferred from ASCA observation is
ergs-1 (From
Lewis et al. 1999, with H0=100 km s-1 Mpc-1 and q0=0.1) and its
temperature inferred from ASCA observation is
![]() keV (Mushotzky &
Scharf 1997). According to Lewis et al. (1999), the X-ray contours are circular
and are centered 15 arcsec to the north of the cD and also show an
extension towards the north.
keV (Mushotzky &
Scharf 1997). According to Lewis et al. (1999), the X-ray contours are circular
and are centered 15 arcsec to the north of the cD and also show an
extension towards the north.
The paper is organized as follows: Sect. 2 details the optical properties of the VLT images. Section 3 deals in some detail with the photometric redshift estimation of galaxies in the field of MS 1008-1224. The mass reconstructions, from weak shear analysis as well as from depletion produced by magnification bias, are presented in Sect. 4. The results are discussed in Sect. 5. Finally, a summary of this study is provided in Sect. 6.
In this paper we have used
H0=100 h-1 km s-1 Mpc-1,
![]() ,
,
![]() .
This corres- ponds to a scale of 1 arcmin = 176 h-1 kpc at the redshift of the cluster.
.
This corres- ponds to a scale of 1 arcmin = 176 h-1 kpc at the redshift of the cluster.
The observations were all carried out by the Science Verification Team at ESO.
The
![]()
![]() 8 field of FORS1 was centred on the cD galaxy
in MS 1008-1224 and images were obtained in the B, V, R and I bands. ISAAC
was used to obtain 2
8 field of FORS1 was centred on the cD galaxy
in MS 1008-1224 and images were obtained in the B, V, R and I bands. ISAAC
was used to obtain 2
![]()
![]()
![]() 5 images of the central region
of the FORS1 field in the J and K bands.
The details of the data processing, from the image acquisition to co-addition
and calibration, may be found at the ESO web site (see URL in the previous
section) while a summary of the image characteristics are presented in Table 1.
5 images of the central region
of the FORS1 field in the J and K bands.
The details of the data processing, from the image acquisition to co-addition
and calibration, may be found at the ESO web site (see URL in the previous
section) while a summary of the image characteristics are presented in Table 1.
| Filter | Exp. Time | Seeing | SB-Lim | Scale |
| (s) | ('') | (mag/arcsec2) | (''/pix) | |
| B | 4950 | 0.72 | 28.25 | 0.2 |
| V | 5400 | 0.65 | 27.90 | 0.2 |
| R | 5400 | 0.64 | 27.44 | 0.2 |
| I | 4050 | 0.55 | 26.37 | 0.2 |
| J | 2880 | 0.68 | - | 0.147 |
| K | 3600 | 0.45 | - | 0.147 |
Source detection and photometry were performed in a standard manner using
SExtractor (version 2.1.0; Bertin & Arnoults 1996). The magnitude
distributions of galaxies are shown in Fig. 1.
![\begin{figure}
\par\includegraphics[width=7.2cm,clip]{ms1776f1.eps}
\end{figure}](/articles/aa/full/2002/12/aa1776/img39.gif) |
Figure 1: Histograms of the magnitude distribution of the MS 1008-1224 field: B (top left), V (top right), R (middle left), I (middle right), J (bottom left), K (bottom right). |
| Open with DEXTER | |
Photometric redshifts (hereafter
![]() )
were computed using the standard
fitting procedure hyperz (Bolzonella et al. 2000) which
compares the observed spectral energy distribution (SED) of a
given galaxy, obtained from photometry, to a set of template spectra. Redshifts
are then computed using a standard
)
were computed using the standard
fitting procedure hyperz (Bolzonella et al. 2000) which
compares the observed spectral energy distribution (SED) of a
given galaxy, obtained from photometry, to a set of template spectra. Redshifts
are then computed using a standard ![]() minimization. hyperz
explores the parameter space defined by the age and metallicity
of the stellar population, the IMF, the reddening law and the reddening value.
When tested against the HDF spectroscopic sample
minimization. hyperz
explores the parameter space defined by the age and metallicity
of the stellar population, the IMF, the reddening law and the reddening value.
When tested against the HDF spectroscopic sample
![]() errors
from hyperz were found to be
errors
from hyperz were found to be
![]() at
at ![]() ,
and
,
and
![]() for more distant galaxies (see Bolzonella et al. 2000
for more details).
for more distant galaxies (see Bolzonella et al. 2000
for more details).
For this work, we used a set of 8 template families from the new Bruzual &
Charlot evolutionary code (GISSEL98; Bruzual & Charlot 1993) with a Miller &
Scalo IMF. The families spanned a wide range of ages for the stellar population
and included: a single burst (coeval stellar population), a constant
star-forming rate, and six ![]() -models (exponentially decaying SFR) designed to
match the sequence of colours from E-S0 to Sd galaxies (255 spectra in all). The
reddening law was taken from Calzetti et al. (2000) with values of AV
between 0 and 1.2 mag, the upper value being twice the mean E(B-V)
reported by Steidel et al. (1999) for galaxies up to
-models (exponentially decaying SFR) designed to
match the sequence of colours from E-S0 to Sd galaxies (255 spectra in all). The
reddening law was taken from Calzetti et al. (2000) with values of AV
between 0 and 1.2 mag, the upper value being twice the mean E(B-V)
reported by Steidel et al. (1999) for galaxies up to ![]() .
The Lyman
forest blanketing was modelled according to Madau (1995).
hyperz computes error bars
corresponding to 69, 90 and 99 per cent confidence levels computed by means of
the
.
The Lyman
forest blanketing was modelled according to Madau (1995).
hyperz computes error bars
corresponding to 69, 90 and 99 per cent confidence levels computed by means of
the
![]() increment for a single parameter (Avni 1976). We only
considered a
increment for a single parameter (Avni 1976). We only
considered a
![]() estimate when the best fit template had
estimate when the best fit template had ![]() 1. It
may be noted that errors in the photometry of the MS 1008-1224 field were more
significant than uncertainties in the template spectra used.
1. It
may be noted that errors in the photometry of the MS 1008-1224 field were more
significant than uncertainties in the template spectra used.
The accuracy and robustness of
![]() were investigated using simulated
catalogues of galaxies with realitics SEDs. The error budget and
were investigated using simulated
catalogues of galaxies with realitics SEDs. The error budget and
![]() accuracy were then analysed as a function of the ESO-BVRIJK filter set, the
photometric errors and the redshift range of the simulated galaxies.
accuracy were then analysed as a function of the ESO-BVRIJK filter set, the
photometric errors and the redshift range of the simulated galaxies.
First, catalogues were produced for the two sets of filters, BVRI (FORS1 images
alone) and BVRIJK (field common to FORS1 and ISAAC images), assuming a uniform
redshift distribution and a Gaussian photometric error distribution of fixed
sigma (0.1 mag), uncorrelated between the different filters.
These were used to determine (i)
![]() errors, (ii)
the fraction of sources for which hyperz returned either no solution
(
errors, (ii)
the fraction of sources for which hyperz returned either no solution
(
![]() )
or multiple solutions and (iii) the fraction of sources with
spurious values (i.e., errors much larger than the normal dispersion at
that redshift). The uniform distribution of simulated galaxies across the
redshift range provided a sufficient number of objects for a robust estimation
of the errors at all redshifts.
)
or multiple solutions and (iii) the fraction of sources with
spurious values (i.e., errors much larger than the normal dispersion at
that redshift). The uniform distribution of simulated galaxies across the
redshift range provided a sufficient number of objects for a robust estimation
of the errors at all redshifts.
We then performed a second set of simulations using a pure
luminosity evolution (PLE) model. The redshift distribution and the photometric
errors (a function of magnitude and filter) in this second simulation were
tailored to mimic the VLT observations of the MS 1008-1224 field in a
more realistic manner. In particular, we focussed on (simulated) galaxies in the
range
![]() (shear analysis sample) and
(shear analysis sample) and
![]() (depletion analysis sample). Galaxies were assigned magnitudes and colours
randomly according to the PLE model of Pozzetti et al. (1998) which had been
designed to reproduce the deep B counts (Williams et al. 1996).
(depletion analysis sample). Galaxies were assigned magnitudes and colours
randomly according to the PLE model of Pozzetti et al. (1998) which had been
designed to reproduce the deep B counts (Williams et al. 1996).
The results from the simulations are shown in Fig. 2 (uniform redshift
distribution) and Fig. 3 (PLE distribution).
![\begin{figure}
\par\includegraphics[angle=-90,width=7.2cm,clip]{ms1776f2a.eps}\\ [4mm]
\includegraphics[angle=-90,width=7.2cm,clip]{ms1776f2b.eps}
\end{figure}](/articles/aa/full/2002/12/aa1776/img58.gif) |
Figure 2:
Photometric versus model redshift for a simulated catalogue
of galaxies uniformly distributed in redshift and a |
| Open with DEXTER | |
![\begin{figure}
\par\includegraphics[angle=-90,width=7.2cm,clip]{ms1776f3a.eps}\\ [4mm]
\includegraphics[angle=-90,width=7.2cm,clip]{ms1776f3b.eps}
\end{figure}](/articles/aa/full/2002/12/aa1776/img59.gif) |
Figure 3:
Photometric versus model redshift for a simulated catalogue
of galaxies simulated to match the data in hand, with a PLE number counts model
and photometric errors scaling with magnitude.
Error bars of
|
| Open with DEXTER | |
The redshift (
![]() )
distribution of sources in the ISAAC field is shown
in Fig. 4.
)
distribution of sources in the ISAAC field is shown
in Fig. 4.
![\begin{figure}
\par\includegraphics[width=7.8cm,clip]{ms1776f4.eps}
\end{figure}](/articles/aa/full/2002/12/aa1776/img63.gif) |
Figure 4:
Photometric redshift distribution of galaxies inside
the ISAAC field obtained from BVRIJK data. The peak corresponds to the cluster
MS 1088-1224. Only those galaxies which fit the hyperz models with
|
| Open with DEXTER | |
The cluster of galaxies comprising MS 1008-1224 is an "in-situ'' control
sample for checking the accuracy of our
![]() estimation. Indeed, the
cluster shows up as a prominent spike in the
estimation. Indeed, the
cluster shows up as a prominent spike in the
![]() distribution
(Fig. 4) between z = 0.25 and 0.4 (
distribution
(Fig. 4) between z = 0.25 and 0.4 (
![]() )
which
confirms both the efficacy of the method as well as our error estimates from
simulations. An additional, and unexpected, check was provided by the discovery
of a background cluster at
)
which
confirms both the efficacy of the method as well as our error estimates from
simulations. An additional, and unexpected, check was provided by the discovery
of a background cluster at
![]() .
That a number of galaxies were
clustered in redshift space as well as on the sky suggested that their
.
That a number of galaxies were
clustered in redshift space as well as on the sky suggested that their
![]() value was reasonably accurate.
value was reasonably accurate.
We also simulated cluster fields at z = 0.31 as targets for the hyperz
program. The clusters were generated with galaxies distributed according to a
King model with central line-of-sight velocity dispersion of 1000 kms-1,
a core radius of 500 kpc and a Schecter luminosity distribution in the range
![]() .
The mixture included 70 per cent ellipticals and S0
galaxies, 28 per cent spirals and 2 per cent star-forming galaxies. The other
parameters (IMF, SFR, models etc.) were as described before. The photometric
accuracy (as a function of magnitude) and limiting magnitudes were chosen to
match the observed values for MS 1008-1224. The apparent magnitudes in all
filters were computed through GISSEL98. This simulated cluster catalogue was
added to a PLE field catalogue to simulate the observed catalogue.
.
The mixture included 70 per cent ellipticals and S0
galaxies, 28 per cent spirals and 2 per cent star-forming galaxies. The other
parameters (IMF, SFR, models etc.) were as described before. The photometric
accuracy (as a function of magnitude) and limiting magnitudes were chosen to
match the observed values for MS 1008-1224. The apparent magnitudes in all
filters were computed through GISSEL98. This simulated cluster catalogue was
added to a PLE field catalogue to simulate the observed catalogue.
Figure 5 shows the cluster sequence on the observed Colour-Magnitude
plot R-I vs. R.
![\begin{figure}
\par\includegraphics[width=7.5cm,clip]{ms1776f5a.eps}\\ [4mm]
\includegraphics[angle=-90,width=8.8cm,clip]{ms1776f5b.eps}
\end{figure}](/articles/aa/full/2002/12/aa1776/img67.gif) |
Figure 5:
Top: a Colour-Magnitude (R-I vs. R) plot for the
field of MS 1008-1224. The cluster sequence formed by galaxies belonging to
MS 1008-1224 is clearly visible as a horizontal strip at
|
| Open with DEXTER | |
Simulations indicated that the error in
![]() for cluster members was
for cluster members was
![]() 0.04 (
0.04 (![]() )
which is similar to the width of the peak obtained for
real data (Fig. 4). It may be noted that this accuracy is much
better than
)
which is similar to the width of the peak obtained for
real data (Fig. 4). It may be noted that this accuracy is much
better than
![]() because of the presence of
appropriately located spectral features which make identification of red cluster
galaxies particularly easy in this redshift range. It is also clear that the
cluster redshift distribution is skewed, the lower redshift side of the peak
being considerably steeper than its counterpart. So we defined the foreground
galaxy sample as those at
because of the presence of
appropriately located spectral features which make identification of red cluster
galaxies particularly easy in this redshift range. It is also clear that the
cluster redshift distribution is skewed, the lower redshift side of the peak
being considerably steeper than its counterpart. So we defined the foreground
galaxy sample as those at
![]() and the background sample (for
lensing analysis) as those at (conservatively)
and the background sample (for
lensing analysis) as those at (conservatively)
![]() .
hyperz
detected 75 per cent of the simulated cluster galaxies in the range
.
hyperz
detected 75 per cent of the simulated cluster galaxies in the range
![]() with BVRIJK.
with BVRIJK.
One of the problems with using the BVRI photometry for
![]() is the
contamination of lower redshift bins by interlopers from z > 1 and this could
be higher than 1 in 3 sources. On the contrary, the simulated Colour-Magnitude
diagram in Fig. 4 indicated that the cluster luminosity is
dominated (80-90 per cent) by emission from red ellipticals on the cluster
sequence. Carlberg et al. (1996) estimated that the red galaxies on the
cluster sequence underestimate the cluster luminosity by about 15 per cent,
similar to what we see in our simulated data. So we used galaxies from the
entire FORS1 field on the cluster sequence of the Colour-Magnitude diagram
(
is the
contamination of lower redshift bins by interlopers from z > 1 and this could
be higher than 1 in 3 sources. On the contrary, the simulated Colour-Magnitude
diagram in Fig. 4 indicated that the cluster luminosity is
dominated (80-90 per cent) by emission from red ellipticals on the cluster
sequence. Carlberg et al. (1996) estimated that the red galaxies on the
cluster sequence underestimate the cluster luminosity by about 15 per cent,
similar to what we see in our simulated data. So we used galaxies from the
entire FORS1 field on the cluster sequence of the Colour-Magnitude diagram
(
![]() ,
17.5 < R < 24.0) for calculating the luminosity
distribution and applied the
,
17.5 < R < 24.0) for calculating the luminosity
distribution and applied the ![]() correction determined above.
correction determined above.
The number and luminosity density distributions of cluster galaxies
are shown in Fig. 6.
![\begin{figure}
\par\includegraphics[width=10cm,clip]{ms1776f6.eps}
\end{figure}](/articles/aa/full/2002/12/aa1776/img74.gif) |
Figure 6:
Galaxy number and R-band luminosity density
distribution in the galaxy cluster MS 1008-1224. The densities were computed
from galaxies on the cluster sequence on the Colour-Magnitude plot (see Fig. 5 and the text) and smoothed with a 50'' Gaussian. The average
galaxy number density is 5.9 gal arcmin-1. The
number density contours plotted (left) are 12.0, 24.0, 36.0, 72.0, 144.0, 215.0,
280.0, 360.0, 720.0, 1080.0, 1440.0, and 1800.0 gal arcmin-2. So, the
density contrast reaches 305 in the cluster center with respect to the average
value. The average luminosity over the field is
|
| Open with DEXTER | |
We used photometric redshifts to calculate the average lensing distance
modulus to convert the gravitational convergence (shear analysis) into a mass
estimate. Thus missing the ![]() objects from BVRI photometry would have
resulted in a considerable error in the absolute mass estimate. Therefore we
assumed that the redshift distribution in the ISAAC field (i.e. those sources
which had BVRIJK magnitudes) was representative of the whole FORS1 field.
objects from BVRI photometry would have
resulted in a considerable error in the absolute mass estimate. Therefore we
assumed that the redshift distribution in the ISAAC field (i.e. those sources
which had BVRIJK magnitudes) was representative of the whole FORS1 field.
The redshift of background sources affects the mass estimate only through the
angular scale distance which has a weak redshift dependence at z > 0.5 in
most cosmologies. So
![]() is not of much concern,
especially when compared to other sources of
error discussed in the section on shear analysis. We also used the
is not of much concern,
especially when compared to other sources of
error discussed in the section on shear analysis. We also used the
![]() distribution to determine the foreground source contamination of the lensing
sample which would have diluted the lensing signal and corrected for the same.
distribution to determine the foreground source contamination of the lensing
sample which would have diluted the lensing signal and corrected for the same.
The weak distortion of background sources produced by gravitational lenses can be used to construct the projected mass distribution of the lens (see Tyson et al. 1990; Mellier 1999; Bartelmann & Schneider 2000). The excellent quality of the FORS1 data-set, especially the depth and the seeing, enabled us to accurately correct for many of the non-gravitational distortions of the image (PSF shear/smear) and also explore in some detail issues like fidelity of reconstructed mass features. To do this two teams, using different source selection criteria and different mass reconstruction schemes, independently produced maps of the mass distribution in MS 1008-1224.
Method 1
The IMCAT weak-lensing analysis package has been made publicly available at the URL http://www.ifa.hawaii.edu/~kaiser by Kaiser and his collaborators (Kaiser et al. 1995; Luppino & Kaiser 1997). The specific version used was the one modified and kindly made available to us by Hoekstra (see Hoekstra et al. 1998). A description of the analysis including measurement of the galaxy polarization, correction for smearing by and anisotropy of the PSF and the shear polarizability of galaxies and the expression for the final shear estimate have already been given by Hoekstra et al. (1998) and references therein and will not be repeated here.
The PSF anisotropy varied across the image and was about 0.015 (shape polarisation). The variation across the image was determined and corrected (separately in each band) using 50-60 stars scattered all over the CCD. The correction resulted in a mean residual polarisation of 0.0002 (rms = 0.004) for these PSF stars.
The maximum probability algorithm of Squires & Kaiser (1996), with K = 20(number of wave modes) and
![]() (the regularisation parameter), was
used to reconstruct the mass distribution from the shear field. Our analysis
differs from that of Hoekstra et al. only in the weighting of the data at the
final stage (described next).
(the regularisation parameter), was
used to reconstruct the mass distribution from the shear field. Our analysis
differs from that of Hoekstra et al. only in the weighting of the data at the
final stage (described next).
While this method works quite well it has the disadvantage that the error weighting and the Gaussian smoothing are coupled to each other. Decreasing the Gaussian smoothing scale (to investigate finer structure in the mass map) reduces the effectiveness of the all important error weighting; in the limiting case when the Gaussian smoothing scale includes just one background source (on the average) there is no error weighting at all. Since lensing inversion is a highly non-linear process and the individual shear values were dominated by the errors on them, this resulted in the final reconstructed mass distributions being considerably dependent on the smoothing scale used. Often we could not discern any signal at all in the mass map when small smoothing scales were used.
To remedy this, apart from
![]() we also calculated the error
on it,
we also calculated the error
on it,
![]() /[
/[
![]() ]2 and used this to weight the shear
values in the mass reconstruction algorithm. This removed the dependence of
error weighting on the smoothing scale and made it possible to make mass maps
with very small smoothing scales to (i) confirm that
the lower resolution mass maps could be obtained by a post-reconstruction
smoothing of the higher resolution map which indicated that our error-weighting
and hence error estimates were correct, (ii) check the stability of the
individual features seen in the mass reconstruction and (ii) investigate the
mass distribution in better detail.
]2 and used this to weight the shear
values in the mass reconstruction algorithm. This removed the dependence of
error weighting on the smoothing scale and made it possible to make mass maps
with very small smoothing scales to (i) confirm that
the lower resolution mass maps could be obtained by a post-reconstruction
smoothing of the higher resolution map which indicated that our error-weighting
and hence error estimates were correct, (ii) check the stability of the
individual features seen in the mass reconstruction and (ii) investigate the
mass distribution in better detail.
However, it has disadvantages as well. Any hole in the shear field (caused
by a bright star, for example) is filled in with zeros by the algorithm
leading to strong ripples and negative peaks in the reconstucted image.
As a result one sometimes finds egregious artifacts which are 5-10 times
larger than the noise. In general, the noise calculated over small regions
(i.e. the "true" noise which avoids large scale correlated fluctuations) is
3-5 times smaller than an rms calculated over a large area including ripples
and all. However, this latter quantity is perhaps more appropriate for
determining the
significance of the features in the mass maps and is the value listed in the
figure captions. It must be noted that this is not the rms of a Gaussian
random distribution and hence the usual rules of thumb and relationships of
Gaussian distributions (e.g. >![]() is significant) may not always be
appropriate. We discuss below some of the ways, some heuristic and others more
solid, in which we can deduce the reliability of the features seen in the mass
reconstruction:
is significant) may not always be
appropriate. We discuss below some of the ways, some heuristic and others more
solid, in which we can deduce the reliability of the features seen in the mass
reconstruction:
(i) The Curl-map: the shear field is a function of the gradient of the
gravitational potential and so a mass map made from the curl of the shear
field (effectively replacing ![]() by
by ![]() and
and ![]() by
by
![]() )
must produce a structure-less noise map (Kaiser 1995) in the
absence of systematic errors in the shear field. Thus, such a Curl-map may be
expected to indicate the location and intensity of artifacts. Further, since
the Curl-map is essentially free of source regions most of its pixels can be
used to get a good estimate of the "large-scale'' rms discussed earlier.
)
must produce a structure-less noise map (Kaiser 1995) in the
absence of systematic errors in the shear field. Thus, such a Curl-map may be
expected to indicate the location and intensity of artifacts. Further, since
the Curl-map is essentially free of source regions most of its pixels can be
used to get a good estimate of the "large-scale'' rms discussed earlier.
(ii) Bootstrap techniques.
(iii) Compare mass maps made with different smoothing scales: features which
vary from one scale to another in an inconsistent manner are likely to be
artifacts.
(iv) Compare mass maps made with data from different bands: the shape of each
lensed galaxy is approximately (but not exactly) the same in every band though
the final shape should be different due to different PSFs and photon noise,
especially for faint sources. It is necessary that a feature, in
order to be considered real, should be of similar shape and intensity (within
errors) in all the bands. Since the noise is so much stronger than the shear
signal reproducing the same features in all the bands is an indication that
PSF corrections and noise weighting were handled appropriately. Of course, this
check is not sufficient to prove that the features are real since intrinsic
ellipticities and locations of the background galaxies are similar/same in
all the bands (see next point).
(v) Random shuffling of the Shear: the shear is sampled only at the positions
of the background sources. Therefore, this multiplicative sampling function
leaves its own convolved footprint on the mass map. However one can get a
qualitative idea of the effect by keeping the positions fixed and randomly
shuffling the observed shear values among them. Obviously this should again
result in a structure-less noise map if there were no systematics introduced
by the sampling function and the FFT.
(vi) An inspection of the location and significance (in terms of rms) of the
negative peaks on the mass map itself.
Method 2
This method also used the raw IMCAT software from Kaiser's home page (see
previous method) with some minor modifications for estimating the shear field.
The mass reconstruction was done using the maximum likelihood estimator
developed by Bartelmann et al. (1996) with the finite difference scheme
described in Appendix B of Van Waerbeke et al. (1999). The
reconstruction was not regularised and hence the resulting mass maps were
noisier than those obtained from Method 1. However, as pointed out Van Waerbeke
et al. (1999) and Van Waerbeke (2000) the advantage of method 2 is that the noise
can be described analytically in the weak lensing approximation. When galaxy
ellipticities are smoothed with a Gaussian window
 |
(1) |
 |
(2) |
The mass reconstructions from B, V, R and I data using the first method are
shown in Fig. 7 (30 arcsec smoothing scale) and Fig. 8 (15 arcsec smoothing scale).
![\begin{figure}
\par\includegraphics[width=10cm,clip]{ms1776f7.eps}
\end{figure}](/articles/aa/full/2002/12/aa1776/img98.gif) |
Figure 7:
Mass reconstruction of MS 1008-1224 from B, V, R and
I images using the algorithm of Squires & Kaiser (1996) - Method 1 in the text
- and a Gaussian smoothing of 30 arcsec. The iso-convergence contour
interval is
|
| Open with DEXTER | |
![\begin{figure}
\par\includegraphics[width=9cm,clip]{ms1776f8.eps}
\end{figure}](/articles/aa/full/2002/12/aa1776/img99.gif) |
Figure 8:
Mass reconstruction of MS 1008-1224 from B, V, R and
I images using the algorithm of Squires & Kaiser (1996) - Method 1 in the
text - and a Gaussian smoothing of 15 arcsec. The bottom-left plot is the
average of the 4 upper plots while the bottom-right is the average of the
Curl-map in each band. The iso-convergence contour interval is |
| Open with DEXTER | |
The lower resolution reconstructions (Fig. 7) are very similar in
shape as well as magnitude of the peak (![]() 5 per cent variation). The
main features are a central mass condensation which seems to be
elongated in the north-south direction, a fainter extension towards the north
and a ridge leading off towards the north-east from the main component. The
prominent cross at (222, 222) marks the location of the cD galaxy.
5 per cent variation). The
main features are a central mass condensation which seems to be
elongated in the north-south direction, a fainter extension towards the north
and a ridge leading off towards the north-east from the main component. The
prominent cross at (222, 222) marks the location of the cD galaxy.
The higher resolution image (Fig. 8) clearly resolves the principal mass component into 2 peaks separated along (mostly) the north-south direction. Once again, it may be noted that the structures are similar in all the bands. We also note that the northern peak appears to be marginally higher than the southern one in all images. This montage (Fig. 8) also includes an average of the mass maps in the 4 bands (bottom-left). The concentric circles denote the annuli within which the mass was estimated to determine the radial profile. They are centred on the centroid of the mass distribution (the black dot) determined from the average of the lower resolution maps (Fig. 7). It must be noted that averaging the mass distribution from all the 4 bands does reduce the amplitude of spurious ripples relative to the more stable mass peaks but not by a factor of 2; for one, the noise is not Gaussian and for another, averaging the shear field with data from different bands reduces the photon noise but not the noise due to intrinsic galaxy ellipticity.
Also shown on the same plot is an average of the Curl-maps made in each of the 4 bands (bottom-right). There were two very bright stars in the MS 1008-1224 field which were masked on the FORS1 images. The thick curved lines delineate the extent of these masks from where no shear data was available. These holes in the shear field led to strong spurious peaks and ripples in the mass map.
The two mass components at the centre are the most significant features in all the maps. Their stability across the different bands and smoothing scales as well as their high level of significance is a strong indicator that they are real features.
An inspection of the mass maps in Figs. 7 and 8 clearly shows that the strongest negative peak in each is in the region of the masks. Further, the north-eastern ridge mentioned earlier is along the boundary of one of the masks, its intensity varies from band to band (in contrast to the 2 principal mass components) and is very prominent in the Curl-map. So we concluded that it was a spurious feature spawned by the FFT and the masks. It was heartening to note that the strong spurious peaks generated by the masks were confined to their immediate vicinity and that much of the Curl-map, especially the lower half, mimics random noise with no strong features.
It is more difficult to determine if the faint but extensive signal leading to the north has a basis in reality. Given its faintness its considerable fluctuation from one map to another is only to be expected. But to a greater or lesser extent it is present in every single plot including others (not shown in this paper) obtained from different combinations of smoothing scale and wave-modes. So, we tentatively suggest that it is real but we shall not attempt to mine it for any further information. We only note that the cluster number and luminosity density distributions (Fig. 6) also show secondary peaks towards the north.
Another point that we shall discuss in more detail a little later is the offset between the cD galaxy and the centroid of the mass distribution.
The mass reconstructions obtained using method 2 are shown in Figs. 9 and 10 (20 and 15 arcsec smoothing scales,
respectively).
![\begin{figure}
\par\includegraphics[width=6.1cm,clip]{ms1776f9.eps}
\end{figure}](/articles/aa/full/2002/12/aa1776/img102.gif) |
Figure 9:
Mass distribution of MS 1008-1224 using Method 2
and a Gaussian smoothing of 20 arcsec. It is superposed on the full R-band
image obtained with the FORS1 on the VLT (440 arcsec on each side with
north to the top and east to the left). The cD is the
bright object located just below the central mass peak. The iso-convergence
( |
| Open with DEXTER | |
![\begin{figure}
\par\includegraphics[width=6.8cm,clip]{ms1776f10.eps}
\end{figure}](/articles/aa/full/2002/12/aa1776/img103.gif) |
Figure 10:
High resolution mass reconstruction of MS 1008-1224
using Method 2 and a smoothing scale of 15 arcsec. The final plot was
obtained by averaging the mass reconstructions in the 4 different bands. This
averaging reduces the noise due to measurement error by a factor of 2 (but not
that due to intrinsic ellipticity). The iso-convergence ( |
| Open with DEXTER | |
We compared the two methods quantitatively by carrying out a Pearson's r-test
(Press et al. 1992) on the high resolution mass reconstructions (the Fig. 8 "Mass-av'' image of method 1 and Fig. 10
"I+R+B+V'' image of method 2). We obtained an r-coefficient of 0.837 for
on-signal pixels and r = 0.298 for off-signal pixels. The smallest
rectangle enclosing the 3![]()
![]() contours of both images defined
the on-signal region while the bottom quarter of the image was used for the
off-signal region since this was the only clean area lacking the spurious
features generated by the large masks in the upper half of the images (see
Fig. 8 bottom-right plot). The on-signal correlation is
very high and as expected much higher than the off-signal correlation.
However the off-signal is still correlated because many galaxies are
common in both methods (locations and shapes are the same), which will
lead to correlated structures at the noise level throughout the map.
Joffre et al. (2000) also measured a similar high correlation in the case of
Abell 3667 even after masking the statistically significant regions of the
mass distribution.
contours of both images defined
the on-signal region while the bottom quarter of the image was used for the
off-signal region since this was the only clean area lacking the spurious
features generated by the large masks in the upper half of the images (see
Fig. 8 bottom-right plot). The on-signal correlation is
very high and as expected much higher than the off-signal correlation.
However the off-signal is still correlated because many galaxies are
common in both methods (locations and shapes are the same), which will
lead to correlated structures at the noise level throughout the map.
Joffre et al. (2000) also measured a similar high correlation in the case of
Abell 3667 even after masking the statistically significant regions of the
mass distribution.
We used Method 2 to quantify the magnitude and significance of this
offset. The best way for measuring the significance of the offset would have
been to use an independent parametric model for the mass distribution and a
parametric bootstrap method to generate a large number of mass reconstructions
with different noise realisations and then measure the dispersion of the cD-mass centroid offset. Since such a model was not available we used the
reconstructed mass map itself as the model.
Combining different realisations of the noise (using the noise model of Eq. (2)),
galaxy positions and intrinsic ellipticities we generated 5000 simulated
datasets based on the I-band data at three different smoothing scales of 20, 30
and 40 arcsec. Figure 11 illustrates the positional
stability one may expect in mass reconstructions and the numbers in Table 2 quantify the statistical significance of the offset.
![\begin{figure}
\par\includegraphics[width=7cm,clip]{ms1776f11.eps}
\end{figure}](/articles/aa/full/2002/12/aa1776/img105.gif) |
Figure 11: Probability histograms of the location of the mass centroid obtained from parametric bootstrap resampling of the I-band shear data. The left hand plots correspond to the Y-axis offset and the right hand plots to the X-axis offset. The vertical dashed line indicates the position of the cD galaxy dashed line. The results have been plotted for 3 different smoothing scales. Note that in each plot the zero of the mass centroid is its average position; thus the cD is at different locations in each plot. Note also that the vertical scale is different for each plot (only the relative height of the bars within plot is relavant). |
| Open with DEXTER | |
|
|
|
|
|
|
|
|
| Prob(
|
0.46 | 0.79 | 0.44 | 0.86 | 0.64 | 0.92 |
| Prob(
|
0.21 | 0.48 | 0.20 | 0.68 | 0.30 | 0.73 |
Clearly, mass features move around on scales of ![]() 10 arcsec and this
effect, naturally, increases with decrease of smoothing scale. One of the
lessons we draw from this analysis is that squeezing finer mass details from
the shear data is possible but at the expense of considerable flakiness in the
positions of the features. It is important to reconstruct mass maps
using various smoothing scales before attempting an interpretation of the same.
Finally, the cD galaxy is offset to the south of the mass centroid by
19+22.5-18.5 arcsec (confidence level, CL = 90%); or, the cD
is at least 5 arcsec (CL = 90%) south of the mass centroid.
10 arcsec and this
effect, naturally, increases with decrease of smoothing scale. One of the
lessons we draw from this analysis is that squeezing finer mass details from
the shear data is possible but at the expense of considerable flakiness in the
positions of the features. It is important to reconstruct mass maps
using various smoothing scales before attempting an interpretation of the same.
Finally, the cD galaxy is offset to the south of the mass centroid by
19+22.5-18.5 arcsec (confidence level, CL = 90%); or, the cD
is at least 5 arcsec (CL = 90%) south of the mass centroid.
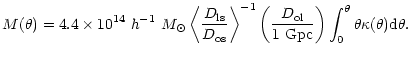
The mass from weak shear,
![]() ,
may be obtained from Aperture Mass
Densitometry or the
,
may be obtained from Aperture Mass
Densitometry or the ![]() -statistics described by Fahlman et al. (1994) and
Squires & Kaiser (1996). In brief, the average tangential shear in an annulus
is a measure of the average density contrast between the annulus and the region
interior to it; i.e. the average convergence
-statistics described by Fahlman et al. (1994) and
Squires & Kaiser (1996). In brief, the average tangential shear in an annulus
is a measure of the average density contrast between the annulus and the region
interior to it; i.e. the average convergence ![]() (
(![]()
![]() ), the ratio of the surface mass density to the critical surface
mass density for lensing, as a function of the radial distance
), the ratio of the surface mass density to the critical surface
mass density for lensing, as a function of the radial distance ![]() is given
by
is given
by
 |
(3) |
From Eq. (3), one can derive the average convergence within a series of apertures
of radii ![]() ,
,
![]()
 |
(4) |
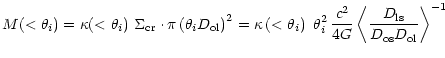 |
(5) |
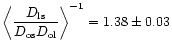 Gpc
(
Gpc
( |
(6) |
The radial profile of the shear is shown in Fig. 12.
![\begin{figure}
\par\includegraphics[width=7.9cm,clip]{ms1776f12.eps}
\end{figure}](/articles/aa/full/2002/12/aa1776/img133.gif) |
Figure 12:
Radial profile of shear in the MS 1008-1224 field.
The filled circles are the tangential shear in successive annuli centered on the
mass centroid (see Fig. 8). The open circles represent the Curlof the shear field which are expected to be (and are) distributed around zero
if the shear field was due to gravitational lensing.
The bars respresent
|
| Open with DEXTER | |
The mass profile inferred from the shear is shown in Fig. 13 as
a series of filled circles along with the error bars.
![\begin{figure}
\par\includegraphics[width=5.9cm,clip]{ms1776f13.eps}
\end{figure}](/articles/aa/full/2002/12/aa1776/img136.gif) |
Figure 13:
The mass profile from gravitational shear analysis
in MS 1008-1224. The filled circles and the
error bars ( |
| Open with DEXTER | |
The combined effect of deflection and magnification of light, results in a
modification of the number density of galaxies seen through the lensing cluster.
In the case of a circular lens, the galaxy count at a radius ![]() is
is
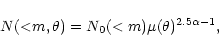 |
(7) |
We considered as foreground those galaxies at
![]() and as
background (lensed) those at
and as
background (lensed) those at
![]() (see Sect. 3.2). We
minimized misclassification by considering only those which had a good
photometric redshift solution (hyperz fit
(see Sect. 3.2). We
minimized misclassification by considering only those which had a good
photometric redshift solution (hyperz fit
![]() ). To be consistent with
the shear analysis, we considered only the
). To be consistent with
the shear analysis, we considered only the
![]() (method 1) and
(method 1) and
![]() (method 2) samples. The galaxy counts slopes for the 2 samples were found to be 0.192 and 0.233, respectively, suggesting that
depletion would be significant in the FORS1 and ISAAC data.
(method 2) samples. The galaxy counts slopes for the 2 samples were found to be 0.192 and 0.233, respectively, suggesting that
depletion would be significant in the FORS1 and ISAAC data.
Figure 14 shows the projected number density of galaxies having
good photometric redshifts from BVRIJK data and in the magnitude range
![]() .
.
![\begin{figure}
\par\includegraphics[width=6.6cm,clip]{ms1776f14.eps}
\end{figure}](/articles/aa/full/2002/12/aa1776/img140.gif) |
Figure 14:
Galaxy distribution in the ISAAC field
(X and Y are in arcsec with north to the top and east to the left).
Each point on the plot
represents the location of a galaxy from the photometric redshift sample
(
22.5 < I < 25.5 and
|
| Open with DEXTER | |
The modification of the radial distribution of galaxy counts (i.e., the
magnification bias) probes the amplitude of the projected mass density. In the
weak lensing regime the relation simplifies to:
| = | (8) | ||
| (9) |
 |
(10) |
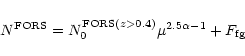
(i) The depletion extends beyond the ISAAC field.
(ii) A lensed background cluster:
we detected a significant enhancement of galaxy number density on the
bottom-right (hereafter Q4) quadrant of the ISAAC field (Fig. 14, lower panel). A visual inspection of the FORS1 images showed
faint and distorted galaxies between a radius of 50 and 80 arcsec from the
centre of depletion. We compared the photometric redshift distribution of
galaxies in Q4 with that from the other three quadrants (Q1-3). The
difference between the (area-normalised) galaxy numbers in Q4 and Q1-3
are plotted in Fig. 15.
![\begin{figure}
\par\includegraphics[width=6.8cm,clip]{ms1776f15.eps}
\end{figure}](/articles/aa/full/2002/12/aa1776/img148.gif) |
Figure 15:
A comparison of the the redshift distribution of
galaxies in the South-West quadrant (Q4) and the other 3 quadrants combined
(Q1-3). The difference in the galaxy numbers have been plotted after
normalising the numbers by the respective areas. An excess of galaxies is seen
at redshift 0.9 at a |
| Open with DEXTER | |
So we tried to determine the asymptotic zero-point for ISAAC by extrapolating
from the FORS1 field as a whole. We selected galaxies from the FORS1 field
which were fainter than the brightest cluster members and outside the cluster
sequence on the Colour-Magnitude plot. We then computed the radial galaxy number
density from the FORS1 data within the ISAAC area, excluding the the background
cluster. Figure 16 shows the depletion curves for the FORS1
field as well as for the ISAAC subsamples with photometric redshifts.
![\begin{figure}
\par\includegraphics[width=5.75cm,clip]{ms1776f16.eps}
\end{figure}](/articles/aa/full/2002/12/aa1776/img151.gif) |
Figure 16: Galaxy number density as function of the radial distance from the centre of depletion. All the curves are for the 22.5<I<25.5galaxy sample. The flat level in the FORS1 curve at large radius provided the zero-point for the full sample. The other curves were computed from galaxies inside the ISAAC field having a good photometric redshift. The thick dashed curves are straight line fits to the FORS1 and ISAAC samples in the inner regions and were used to calculate the fraction of ISAAC lensed galaxies with a good photometric redshift (see text). |
| Open with DEXTER | |
 |
(11) |
For the
![]() sample in the ISAAC field we have
sample in the ISAAC field we have
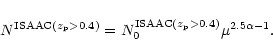 |
(12) |
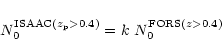 |
(13) |
 |
(14) |
In conclusion, despite the very good data set this method is still saddled with large errors. Depletion analysis is in principle very simple (just counting galaxies) and a neat way of avoiding the mass sheet degeneracy of shear analysis but is plagued by cosmic variance, background clustering and, as we have demonstrated here, the necessity of having complete redshift samples.
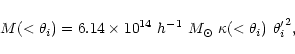
We compared our results with X-ray and virial analyses. From Fig. 4 of Lewis et al., we see that within 175 h-1 kpc (1 arcmin) radius the mass inferred from
X-ray emissivity is
![]() which is a
factor of 2 lower than the minimum estimate from our shear analysis,
which is a
factor of 2 lower than the minimum estimate from our shear analysis,
![]() (CL = 90%).
(CL = 90%).
The agreement is better on larger scales. Both estimates increase monotonically
and reach
![]() and a
lower limit of
and a
lower limit of
![]() (CL = 90%)
at
r = 350 h-1 kpc (2 arcmin). At that radius, which is the limiting
distance to which the
X-ray data are reliable, the relative discrepancy of
(CL = 90%)
at
r = 350 h-1 kpc (2 arcmin). At that radius, which is the limiting
distance to which the
X-ray data are reliable, the relative discrepancy of ![]() 20% is within the
errors. However, even if we assume that the 20% difference is real and constant
beyond
r = 350 h-1 kpc, the baryon fraction only changes from
20% is within the
errors. However, even if we assume that the 20% difference is real and constant
beyond
r = 350 h-1 kpc, the baryon fraction only changes from
![]() quoted by Lewis et al. (1999) to
quoted by Lewis et al. (1999) to
![]() .
.
We compared the mass profile inferred from the shear analysis to several model mass profiles. These model curves have been plotted on the observed mass profile in Fig. 13. We note that the tightest constraint on the profiles occur at small radii. The error bars are too large to really discriminate between the models at large radii. For this reason and others described below we have plotted several models on the data and discussed them in some detail.
One drawback is the marginal detection (
![]() )
of shear in the outermost
annulus. It may just be random fluctuation - sections of this annulus lie
outside the image or on the masks and so it contains fewer galaxies than it
otherwise would
have; indeed its error-bar is a third again as much as that of its neighbour.
On the other hand, this is perhaps an indication that the mass extends out
beyond the edge of the field. If so, we will have a radius dependence to the
mass underestimation (
)
of shear in the outermost
annulus. It may just be random fluctuation - sections of this annulus lie
outside the image or on the masks and so it contains fewer galaxies than it
otherwise would
have; indeed its error-bar is a third again as much as that of its neighbour.
On the other hand, this is perhaps an indication that the mass extends out
beyond the edge of the field. If so, we will have a radius dependence to the
mass underestimation (
![]() )
which is not expected to be significant at
small radii but could be considerable at the outer points. However, we note
that our models, which are basically constrained by the inner points, are not
very different from the observed profile at large radii. So unless profiles in
the real Universe are very different from those plotted in Fig. 13 the total mass (including the "missed'' fraction) should
lie within the upper limits of the present error-bars.
The second problem is the presence of the background cluster
described previously in the depletion analysis. Clearly, its (unknown)
contribution to the projected mass density, at
)
which is not expected to be significant at
small radii but could be considerable at the outer points. However, we note
that our models, which are basically constrained by the inner points, are not
very different from the observed profile at large radii. So unless profiles in
the real Universe are very different from those plotted in Fig. 13 the total mass (including the "missed'' fraction) should
lie within the upper limits of the present error-bars.
The second problem is the presence of the background cluster
described previously in the depletion analysis. Clearly, its (unknown)
contribution to the projected mass density, at ![]() 1 arcmin from the mass
centroid, has to be subtracted before fitting a model profile.
1 arcmin from the mass
centroid, has to be subtracted before fitting a model profile.
In the upper two panels of Fig. 13 we have plotted
Pseudo-isothermal sphere (PIS) models on the observed profile. For
![]() the PIS profile is given by:
the PIS profile is given by:
 |
(15) |
Carlberg et al. (1996) measured
![]() kms-1
and our estimate, though somewhat smaller, is consistent with theirs. Their
velocity dispersions (of MS 1008-1224 and other clusters) were in general
considerably less than previous estimates. The agreement between our value and
theirs suggests that their algorithm and prescriptions were reliable.
kms-1
and our estimate, though somewhat smaller, is consistent with theirs. Their
velocity dispersions (of MS 1008-1224 and other clusters) were in general
considerably less than previous estimates. The agreement between our value and
theirs suggests that their algorithm and prescriptions were reliable.
The universal profile (NFW) has been plotted on the observed profile in the
bottom panel of Fig. 13. The NFW profile may be expressed for
this cluster as:
 |
(16) |
Figure 17 shows the radial luminosity profile of cluster galaxies
selected from the Colour-Magnitude plot.
![\begin{figure}
\par\includegraphics[width=6.8cm,clip]{ms1776f17.eps}
\end{figure}](/articles/aa/full/2002/12/aa1776/img188.gif) |
Figure 17:
Top panel: radial distribution of the total I-band
luminosity of MS 1008-1224 galaxies located on the cluster sequence on the
Colour-Magnitude plot. The solid line is the best fit straight line (see Sect. 5). Bottom panel: the observed Mass-to-Light ratio profile of MS 1008-1224
determined from weak-lensing mass and I-band luminosity (note: the M/L value
scales with the Hubble factor h). The curves are model mass profiles divided
by the linear fit to the observed luminosity profile : the solid line represents
the NFW model plotted in bottom panel of Fig. 13 while the dotted
lines represent the PIS models in the middle panel of 13 (lower
core radius values make for flatter curves at small radii).
The vertical bars represent |
| Open with DEXTER | |
The light profile is remarkably linear. Hoesktra et al. (1998) found similar
results for Cl1358+62. The best fit to the profile gave a slope of
![]() arcmin and a y-intercept of
arcmin and a y-intercept of
![]() (CL = 90%) which is
consistent with zero.
(CL = 90%) which is
consistent with zero.
The radial profile of the mass-to-light ratio, M/L, is also shown in Fig. 17. At
r = 350 h-1 kpc (2 arcmin) from the cluster center,
![]() .
Extrapolating the outermost data points provides a
value of
.
Extrapolating the outermost data points provides a
value of
![]() at
r = 700 h-1 kpc (4 arcmin). This
value must be scaled to a value appropriate for the r-band used in Carlberg et al. We find that our equivalent estimate of
at
r = 700 h-1 kpc (4 arcmin). This
value must be scaled to a value appropriate for the r-band used in Carlberg et al. We find that our equivalent estimate of
![]() is in
good agreement with the value of (
is in
good agreement with the value of (
![]() from the CNOC analysis
(all errors
from the CNOC analysis
(all errors ![]() ).
).
There is not much additional information (beyond that provided by the mass
profile) to be had by fitting model profiles to this quantity. However, this
plot brings out in a more obvious way the points we made when discussing the
mass profile. The NFW model provides a better fit to the M/L profile than the
PIS models because for a linear luminosity profile the M/L for the NFW model
has the functional form
![]() which has a maximum at some
intermediate point. The strong constraint exercised by the innermost data point
on the allowed core-radius values (PIS models : 40-110 h-1 kpc) and the
excess of mass on intermediate scales (for both NFW and PIS models) are also
seen more clearly.
which has a maximum at some
intermediate point. The strong constraint exercised by the innermost data point
on the allowed core-radius values (PIS models : 40-110 h-1 kpc) and the
excess of mass on intermediate scales (for both NFW and PIS models) are also
seen more clearly.
The origin of this excess at 1 arcmin radius may be due to the second cluster at z = 0.9 which increases the gravitational amplification and shear of galaxies at z > 1 and located within 1 arcmin of the mass centroid. From the depletion point of view the most distant galaxies are deflected twice which increases the depth and the angular size of the depleted area. From the gravitational shear point of view, the increase in distortion due to the second cluster could have been mistakenly ascribed to the stronger gravitational potential of MS 1008-1224. This could explain why the mass from the weak lensing analysis, and therefore the radial distribution of the mass-to-light ratio shown in Fig. 17, increases rapidly at small radii (r < 1 arcmin) despite a linear increase of the cluster luminosity. A similar effect is also discernable in the depletion which has a very steep growth curve.
The discrepancy between X-ray and lensing mass only appears on small scales. Also with our weak-lensing mass estimate it is only a factor of 2 which is significantly lower than the factor 3.7 obtained by Wu & Fang (1997) from the analysis of strong lensing features. The decrease of the discrepancy with radius seems to be a general trend which has already been reported (Athreya et al. 1999; Lewis 1999, see Mellier 1999 and references therein). It must be noted that in most of the studies reporting a discrepancy the comparison has been done between X-ray and strong-lensing (not weak-lensing) analyses.
Some of the discrepancy observed in MS 1008-1224 can be produced by the distant
cluster behind it. However, such a projection effect, similar to those discussed
by Reblinsky & Bartelmann (1999), cannot explain the factor of 2 discrepancy
because (i) the distant cluster occupies only a small fraction of the lensed
area (1 quadrant of the ISAAC field) and (ii) only background galaxies at z >
0.9 are magnified twice. An upper limit to the magnitude of its impact on the
mass estimate is roughly the ratio
 |
(17) |
It is worth noting that apart from this distant cluster contamination by other projection effects are not visible at the center where photometric redshifts provide a good idea of the clustering along the line of sight. The ISAAC field encompasses the region where strong lensing features are visible and where the mass estimate from lensing exceeds the X-ray prediction. We find no evidence that biases like the ones proposed by Cen (1997) or Metzler (1999) are significant in the central region.
There is compelling evidence that the center of mass does not coincide with the cD galaxy:
The contours of isoluminosity and number density are clearly clumpy and extend
northward of the cD galaxy, as do the contours in our mass maps and in the
X-ray maps of Lewis et al. (1999) ![]() all pointers toward a dynamically
unstable and perhaps merging system. If so, the hot gas is unlikely to be in
equilibrium. A merging process produces shocks and gas flows between clumps,
such as those seen in Schindler & Müller's simulations (1993) or those
reported by Kneib et al. (1996) and Neumann & Böhringer (1999) in the
lensing cluster A2218.
all pointers toward a dynamically
unstable and perhaps merging system. If so, the hot gas is unlikely to be in
equilibrium. A merging process produces shocks and gas flows between clumps,
such as those seen in Schindler & Müller's simulations (1993) or those
reported by Kneib et al. (1996) and Neumann & Böhringer (1999) in the
lensing cluster A2218.
Athreya et al. (1999) reported very similar trends in Abell 370: good agreement between X-ray and weak lensing mass estimates on large scales and a factor of 2 discrepancy near the centre. A370 is clearly composed of merging clumps and they ascribed the X-ray - lensing discrepancy to an oversimplified model of the hot gas in the inner regions. We suspect a similar case in the inner regions of MS 1008-1224. This, as suggested earlier by Miralda-Escudé & Babul (1995), explains the good agreement on large scales between the weak lensing, the X-ray and also the virial mass (see Lewis et al. 1999) and the apparent contradiction between X-ray and strong lensing.
We cannot rule out the possibility that the clumps in MS 1008-1224 are close to each other only in projection. The lensing signal due to a collinear collection of condensates would mimic that of an equivalent projected mass density lens but the X-ray mass estimate would be considerably lower. This would be a more appropriate explanation if the lensing mass missed by this analysis because of the small field of view is considerable.
Thanks to the deep multicolour subarcsecond images obtained with FORS1 and ISAAC, it was possible to carry out a weak-lensing analysis of the galaxy cluster MS 1008-1224 in considerable detail:
Acknowledgements
We thank H. Hoesktra for providing his own updated version of the IMCAT software and for discussions on weak lensing. We thank also E. Bertin, T. Erben, N. Kaiser, R. Maoli, D. Pogosyan and P. Schneider for fruitful discussions. We acknowledge the helpful comments of an anonymous referee which considerably improved our presentation. We acknowledge efforts of the Science Verification Team of FORS1 and ISAAC at ESO for making available this excellent dataset to the ESO community.
The TERAPIX data center provided its computing facilities for the data reduction, the lensing analyses and the simulations. This work was supported the TMR network "Gravitational Lensing: New Constraints on Cosmology'' and the Distribution of Dark Matter'' of the EC under contract No. ERBFMRX-CT97-0172 and the Indo-French Centre for the Promotion of Advanced Research IFCPAR grant 1410-2.