The H![]() luminosity functions were computed separately for the two clusters under
study from the measured fluxes.
H0 = 50 km s-1 Mpc-1 is assumed to allow a direct comparison
with Gallego et al. (1995).
luminosity functions were computed separately for the two clusters under
study from the measured fluxes.
H0 = 50 km s-1 Mpc-1 is assumed to allow a direct comparison
with Gallego et al. (1995).
H![]() fluxes were corrected for [N II] contamination and dust
extinction.
The first correction is the one proposed by
Gavazzi et al. (2002, in prep.), based on the relationship found between the
H band luminosities and the [N II]/H
fluxes were corrected for [N II] contamination and dust
extinction.
The first correction is the one proposed by
Gavazzi et al. (2002, in prep.), based on the relationship found between the
H band luminosities and the [N II]/H![]() ratio.
After a empirical relationship between the H and r' magnitudes for the
galaxies in common in both samples the correction was finally given by:
ratio.
After a empirical relationship between the H and r' magnitudes for the
galaxies in common in both samples the correction was finally given by:
![\begin{displaymath}\log [\mbox{N{\sc ii}}]/\mbox{H}\alpha = 1.26 - 0.19 \times r' + 0.70 \times \log D
\end{displaymath}](/articles/aa/full/2002/11/aa2087/img42.gif) |
(3) |
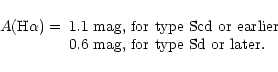
The morphological type dependent dust extinction correction was taken from
Boselli et al. (2001).
For galaxies with known morphological type (from NED or other sources), the correction was taken to be
The contribution of active nuclei to the H![]() detections is negligible
because no relevant point-like nuclear features were
detected in the H
detections is negligible
because no relevant point-like nuclear features were
detected in the H![]() frames.
frames.
In order to normalize the luminosity function to a proper volume, angular radii of 3 and 4 degrees were assumed for Abell 1367 and Coma respectively (Gavazzi et al. 1995), corresponding to linear sizes of 4.6 and 6.5 Mpc. The clusters were assumed spherically symmetric, thus the surveyed volume corresponds to the intersection between the solid angle covered by our observations and the sphere containing the clusters.
A statistical correction was applied to account for the incomplete velocity coverage
of the adopted [S II] filter.
Figure 5 shows the flux distribution of galaxies
with known redshift versus their radial velocities. The dashed line represents
the Gaussian distributions of velocities described in Sect. 2. The shaded
regions correspond to the velocity ranges excluded from the filter transmitance window
for each cluster.
We estimate that about 20% of the velocity distribution for Abell 1367 and 11%
for Coma are not within the transmitance window of the narrow band filter.
We also corrected in a consistent way the effects of
the velocity distribution of the H![]() emitting galaxies with unknown
redshift. The correction was performed as follows:
first, we randomly distributed the velocities of these galaxies following the
Gaussian probability density function with mean velocities and dispersions as
described in Sect. 2. New H
emitting galaxies with unknown
redshift. The correction was performed as follows:
first, we randomly distributed the velocities of these galaxies following the
Gaussian probability density function with mean velocities and dispersions as
described in Sect. 2. New H![]() fluxes were derived for these galaxies,
according to the values of the transmitance of the [S II] filter,
for the randomly chosen velocities. If the assigned velocity of any
of these galaxies gave a transmitance <50%, the object
was discarded. The final correction was performed by assuming that the
relationship, if any, between the radial velocities of the galaxies and the
H
fluxes were derived for these galaxies,
according to the values of the transmitance of the [S II] filter,
for the randomly chosen velocities. If the assigned velocity of any
of these galaxies gave a transmitance <50%, the object
was discarded. The final correction was performed by assuming that the
relationship, if any, between the radial velocities of the galaxies and the
H![]() fluxes should be symmetric with respect to the mean velocity of the
cluster.
We repeated this procedure ten times in order to estimate the
statistical uncertainties induced by this effect on the luminosity function. Thus,
H
fluxes should be symmetric with respect to the mean velocity of the
cluster.
We repeated this procedure ten times in order to estimate the
statistical uncertainties induced by this effect on the luminosity function. Thus,
H![]() luminosity functions were computed with ten different flux
distributions for each cluster.
luminosity functions were computed with ten different flux
distributions for each cluster.
The functional form assumed for the LF is the Schechter (1976) function:
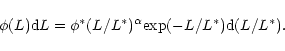 |
(4) |
Table 3 lists the obtained best fitting Schechter parameters of the upper and lower envelopes for each cluster, as well as the parameters for the average LFs finally adopted.
The upper and lower envelope H![]() LFs of the two clusters are given in
Fig. 6. Shaded regions between the
envelopes show the range of uncertainty of the H
LFs of the two clusters are given in
Fig. 6. Shaded regions between the
envelopes show the range of uncertainty of the H![]() LF for each cluster.
The points correspond to the mean values listed in Table 2,
and the error bars show their typical poissonian uncertainties.
As reference, we plot the H
LF for each cluster.
The points correspond to the mean values listed in Table 2,
and the error bars show their typical poissonian uncertainties.
As reference, we plot the H![]() LFs of field galaxies obtained by Gallego et al. (1995), Tresse & Maddox (1998) and Sullivan et al. (2000). The
lines are truncated at the completeness limits of each sample.
LFs of field galaxies obtained by Gallego et al. (1995), Tresse & Maddox (1998) and Sullivan et al. (2000). The
lines are truncated at the completeness limits of each sample.
|
|
Av. Number of gal. | |
| erg s-1 | Abell 1367 | Coma |
| 38.8 | 8 | 2 |
| 39.8 | 18 | 11 |
| 40.8 | 13 | 8 |
| 41.8 | 1 | 1 |
|
|
|
||
| Mpc-3 | erg s-1 | ||
| Abell 1367 | |||
| Upper envelope | -0.06 | -0.94 | 41.37 |
| Lower envelope | +0.20 | -0.72 | 41.21 |
| Average | +0.06 | -0.82 | 41.30 |
| Coma | |||
| Upper envelope | -0.09 | -0.70 | 41.24 |
| Lower envelope | -0.04 | -0.53 | 41.21 |
| Average | -0.07 | -0.60 | 41.23 |
Disregarding non-completeness effects, which should
only affect our lowest luminosity bins,
the LFs of the two clusters are in fair agreement.
The apparent difference with the field LFs is mainly in the normalization
since the density of galaxies is several orders of magnitude larger
in clusters than in the field.
Beside the normalization, the shape of the cluster LFs appears steeper at the bright end and flatter
at the faint end.
The former derives from undersampling at high luminosity (due to small volume coverage
in the two clusters we do not detect any object with
![]() erg s-1 as opposed to Gallego et al. 1996).
erg s-1 as opposed to Gallego et al. 1996).
The slope of the fitted LFs appear different among clusters and field at the faint end.
However the data points, within the completeness limits of each survey, appear
in full agreement among each other, as shown in Fig. 7.
![\begin{figure}
\par\includegraphics[width=8.8cm,clip]{MS2087f6.eps} \end{figure}](/articles/aa/full/2002/11/aa2087/img51.gif) |
Figure 6:
H |
| Name | CGCG | Other | RA | Dec. | r' |
|
|
|
|
|
| 114024+195747 | -- | -- | 11 40 24.90 | +19 57 47.7 | 6749 | 15.48 | -13.71 | 0.04 | 14 | 1 |
| 114038+195437 | -- | -- | 11 40 38.96 | +19 54 37.4 | 6500
|
17.35 | -14.09 | 0.05 | 36 | 3 |
| 114107+200251 | -- | -- | 11 41 07.79 | +20 02 51.3 | 6500 |
18.91 | -14.60 | 0.05 | 43 | 4 |
| 114110+201117 | -- | -- | 11 41 10.47 | +20 11 17.7 | 6500 |
17.57 | -13.95 | 0.04 | 56 | 2 |
| 114112+200109 | -- | -- | 11 41 12.81 | +20 01 09.9 | 6500 |
19.44 | -14.80 | 0.07 | 38 | 5 |
| 114141+200230 | -- | -- | 11 41 41.20 | +20 02 30.5 | 6500 |
17.37 | -14.26 | 0.06 | 26 | 4 |
| 114142+200054 | -- | -- | 11 41 42.57 | +20 00 54.9 | 6500 |
17.33 | -14.36 | 0.07 | 19 | 3 |
| 114149+194605 | -- | -- | 11 41 49.79 | +19 46 05.1 | 6500 |
17.52 | -14.37 | 0.05 | 23 | 2 |
| 114156+194207 | -- | -- | 11 41 56.69 | +19 42 07.8 | 6500 |
19.77 | -15.10 | 0.07 | 36 | 5 |
| 114157+194329 | -- | -- | 11 41 57.90 | +19 43 29.4 | 6500 |
20.21 | -15.29 | 0.05 | 34 | 3 |
| 114158+194149 | -- | -- | 11 41 58.05 | +19 41 49.6 | 6500 |
19.46 | -15.02 | 0.06 | 38 | 4 |
| 114158+194205 | -- | -- | 11 41 58.10 | +19 42 05.9 | 6500 |
20.30 | -15.27 | 0.04 | 49 | 2 |
| 114158+194900 | -- | -- | 11 41 58.26 | +19 49 00.9 | 6500 |
20.70 | -15.53 | 0.07 | 32 | 4 |
| 114202+194348 | -- | -- | 11 42 02.30 | +19 43 48.5 | 6500 |
20.83 | -15.35 | 0.05 | 70 | 6 |
| 114202+192648 | -- | -- | 11 42 02.96 | +19 26 48.2 | 6500 |
19.54 | -14.66 | 0.06 | 32 | 4 |
| 114214+195833 | 097-062 | PGC 036330 | 11 42 14.55 | +19 58 33.6 | 7815 | 14.51 | -13.19 | 0.04 | 28 | 1 |
| 114215+200255 | 097-063 | PGC 036323 | 11 42 15.70 | +20 02 55.2 | 6102 | 15.36 | -13.69 | 0.04 | 13 | 1 |
| 114218+195016 | -- | -- | 11 42 18.08 | +19 50 16.1 | 6476 | 15.79 | -14.24 | 0.04 | 6 | 1 |
| 114239+195808 | -- | -- | 11 42 39.23 | +19 58 08.0 | 7345 | 16.95 | -13.89 | 0.04 | 40 | 1 |
| 114240+195716 | -- | -- | 11 42 40.36 | +19 57 16.6 | 6500 |
17.68 | -14.70 | 0.08 | 13 | 2 |
| 114256+195757 | 097-073 | PGC 036382 | 11 42 56.67 | +19 57 57.7 | 7275 | 15.50 | -12.81 | 0.04 | 86 | 1 |
| 114313+193645 | -- | -- | 11 43 13.08 | +19 36 45.8 | 6500
|
17.27 | -14.06 | 0.05 | 30 | 3 |
| 114313+200015 | 097-079 | PGC 036406 | 11 43 13.93 | +20 00 15.6 | 7000 | 16.50 | -12.69 | 0.04 | 130 | 2 |
| 114341+200135 | -- | -- | 11 43 41.62 | +20 01 35.3 | 6500 |
17.08 | -14.15 | 0.06 | 25 | 3 |
| 114348+195812 | 097-087 | UGC 06697 | 11 43 48.59 | +19 58 12.8 | 6725 | 14.22 | -12.19 | 0.04 | 81 | 2 |
| 114348+201456 | -- | -- | 11 43 48.92 | +20 14 56.0 | 6146 | 15.86 | -12.95 | 0.04 | 137 | 1 |
| 114349+195833 | -- | -- | 11 43 49.87 | +19 58 33.2 | 7542 | 16.11 | -13.99 | 0.04 | 19 | 2 |
| 114355+192743 | -- | -- | 11 43 55.71 | +19 27 43.9 | 6500 |
18.72 | -14.67 | 0.07 | 27 | 4 |
| 114358+201105 | 097-092 | PGC 036478 | 11 43 58.17 | +20 11 05.6 | 6373 | 14.71 | -13.10 | 0.04 | 30 | 1 |
| 114358+200433 | 097-091 | NGC 3840 | 11 43 58.81 | +20 04 33.0 | 7368 | 13.92 | -12.86 | 0.07 | 25 | 4 |
| 114400+200144 | 097-097 | NGC3844 | 11 44 00.86 | +20 01 44.5 | 6834 | 13.62 | -13.41 | 0.04 | 5 | 1 |
| 114430+195718 | -- | -- | 11 44 30.41 | +19 57 18.8 | 6500 |
20.23 | -14.38 | 0.04 | 418 | 19 |
| 114447+194624 | 097-114 | NGC 3860B | 11 44 47.88 | +19 46 24.6 | 8293 | 15.33 | -13.24 | 0.05 | 40 | 4 |
| 114454+194733 | -- | -- | 11 44 54.22 | +19 47 33.2 | 6500
|
20.27 | -13.99 | 0.06 | 103 | 17 |
| 114454+194635 | 097-125 | PGC 036589 | 11 44 54.99 | +19 46 35.8 | 8271 | 14.50 | -13.00 | 0.05 | 24 | 2 |
| 114454+200101 | -- | -- | 11 44 54.71 | +20 01 01.5 | 6500
|
16.17 | -14.41 | 0.04 | 6 | 1 |
| 114503+195002 | -- | -- | 11 45 03.38 | +19 50 02.7 | 6500 |
17.90 | -14.76 | 0.07 | 9 | 1 |
| 114506+195801 | 097-129E | NGC 3861B | 11 45 06.91 | +19 58 01.6 | 6009 | 14.64 | -13.38 | 0.06 | 19 | 2 |
| 114513+194523 | -- | -- | 11 45 13.86 | +19 45 23.0 | 6500
|
15.60 | -13.86 | 0.04 | 12 | 1 |
| 114518+200009 | -- | -- | 11 45 18.00 | +20 00 09.5 | 6500 |
17.54 | -14.28 | 0.06 | 22 | 3 |
| 114603+194712 | 097-143B | -- | 11 46 03.68 | +19 47 12.9 | 7170 | 15.80 | -14.93 | 0.05 | 1 | 1 |
| Name | CGCG | Other | RA | Dec. | r' |
|
|
|
|
|
| 125757+280343 | -- | FOCA610 | 12 57 57.73 | +28 03 43.3 | 8299 | 15.23 | -13.37 | 0.05 | 22 | 2 |
| 125805+281433 | 160-055 | NGC4848 | 12 58 05.67 | +28 14 33.2 | 7049 | 14.04 | -12.54 | 0.05 | 34 | 2 |
| 125845+284133 | -- | FOCA353 | 12 58 45.64 | +28 41 33.1 | 7001
|
17.21 | -14.02 | 0.06 | 35 | 5 |
| 125845+283235 | -- | FOCA399 | 12 58 45.80 | +28 32 35.3 | 7001 |
17.76 | -13.83 | 0.04 | 101 | 4 |
| 125856+275002 | 160-212 | FOCA600 | 12 58 56.55 | +27 50 2.7 | 7378 | 15.12 | -13.84 | 0.05 | 3 | 1 |
| 125902+280656 | 160-213 | FOCA498 | 12 59 02.14 | +28 06 56.4 | 9436 | 15.15 | -13.32 | 0.06 | 28 | 3 |
| 125907+275118 | 160-219 | IC3960 | 12 59 07.97 | +27 51 18.0 | 6650 | 14.50 | -14.12 | 0.05 | 2 | 1 |
| 125923+282919 | -- | FOCA361 | 12 59 23.13 | +28 29 19.0 | 7001
|
15.75 | -13.98 | 0.04 | 10 | 1 |
| 130006+281500 | -- | FOCA371 | 13 00 06.42 | +28 15 0.9 | 7259 | 17.04 | -14.48 | 0.07 | 6 | 1 |
| 130037+280327 | 160-252 | FOCA388 | 13 00 37.99 | +28 03 27.6 | 7840 | 14.68 | -12.93 | 0.08 | 41 | 4 |
| 130037+283951 | -- | -- | 13 00 37.24 | +28 39 51.6 | 7001
|
16.86 | -14.64 | 0.05 | 6 | 2 |
| 130040+283113 | -- | FOCA242 | 13 00 40.75 | +28 31 13.4 | 8901 | 15.80 | -13.11 | 0.05 | 68 | 6 |
| 130056+274727 | 160-260 | FOCA445 | 13 00 56.03 | +27 47 27.7 | 7985 | 13.11 | -12.76 | 0.07 | 11 | 2 |
| 130114+283118 | -- | FOCA195 | 13 01 14.99 | +28 31 18.5 | 8426 | 17.02 | -14.04 | 0.05 | 29 | 3 |
| 130125+284036 | 160-098 | FOCA137 | 13 01 25.04 | +28 40 36.9 | 8762 | 14.41 | -13.21 | 0.04 | 18 | 1 |
| 130127+275957 | -- | GMP2048 | 13 01 27.17 | +27 59 57.0 | 7558 | 15.64 | -14.35 | 0.04 | 4 | 1 |
| 130128+281515 | -- | -- | 13 01 28.63 | +28 15 15.9 | 7001 |
20.41 | -14.96 | 0.04 | 107 | 6 |
| 130130+283328 | -- | FOCA158 | 13 01 30.85 | +28 33 28.0 | 7001
|
16.76 | -13.95 | 0.06 | 24 | 2 |
| 130140+281456 | -- | GMP1925 | 13 01 40.97 | +28 14 56.6 | 7001 |
19.33 | -14.43 | 0.07 | 132 | 36 |
| 130158+282114 | -- | -- | 13 01 58.43 | +28 21 14.8 | 7001 |
19.81 | -14.39 | 0.04 | 278 | 8 |
| 130212+281023 | -- | FOCA218 | 13 02 12.00 | +28 10 23.0 | 8950 | 16.09 | -13.41 | 0.05 | 30 | 2 |
| 130212+281253 | 160-108 | FOCA204 | 13 02 12.55 | +28 12 53.0 | 8177 | 14.93 | -13.29 | 0.04 | 25 | 1 |
| CGCG | This work | M88
|
M98
|
K84
|
G91
|
G98
|
||||||
| EW | EW | EW | EW | EW | EW | |||||||
| 097-062 | -13.19 | 28 | - | - | -12.93 | 58 | -13.10 | 45 | - | - | - | 34 |
| 097-073 | -12.81 | 86 | -12.84 | - | -- | -- | -12.84 | 80 | - | - | -12.76 | 108 |
| -12.75 | 94 | |||||||||||
| 097-079 | -12.69 | 130 | -12.54 | -- | -- | -- | -12.64 | 145 | -12.64 | 131 | -12.66 | 137 |
| 097-087 | -12.19 | 81 | -12.22 | 64 | -12.43 | 84 | -12.19 | 61 | - | - | -12.22 | 74 |
| 097-092 | -13.10 | 30 | -13.06 | - | -12.95 | 30 | - | - | - | - | - | 27 |
| 097-091 | -12.86 | 25 | -12.92 | 17 | -12.86 | 21 | -12.74 | 23 | - | - | - | - |
| 097-114 | -13.24 | 40 | -12.82 | 79: | -12.82 | 60 | -13.20 | 4 | - | - | - | 48 |
| 097-125 | -13.00 | 24 | -13.13 | 29 | -13.04 | 26 | - | - | - | - | - | 21 |
| 097-129E | -13.38 | 19 | - | - | - | - | - | - | - | - | -13.38 | 18 |
| 160-252 | -12.93 | 41 | - | - | - | - | -12.93 | 35 | - | - | - | - |
| 160-055 | -12.54 | 34 | - | - | - | - | -12.65 | 23 | - | - | -12.51 | 34 |
| 160-260 | -12.76 | 11 | - | - | - | - | - | - | - | - | -13.03 | 8 |
| 160-098 | -13.21 | 18 | - | - | - | - | - | - | - | - | -13.15 | 20 |
In this figure we scaled the cluster LFs in such a way that they match
the field LF at
![]() erg s-1.
Above
erg s-1.
Above
![]() erg s-1, where all the samples are complete,
there is consistency between the field and the cluster datasets. Nothing can be
said for fainter luminosities because the field samples are incomplete or
present rather poor statistics, opposite to the present cluster survey which is
complete to
erg s-1, where all the samples are complete,
there is consistency between the field and the cluster datasets. Nothing can be
said for fainter luminosities because the field samples are incomplete or
present rather poor statistics, opposite to the present cluster survey which is
complete to
![]() erg s-1. Deeper H
erg s-1. Deeper H![]() surveys of the field are necessary to assess if the differences at the faint
luminosity end are significant.
surveys of the field are necessary to assess if the differences at the faint
luminosity end are significant.
It is instructive to compare the H![]() LF of A1367 and Coma with that of the
Virgo cluster. Given its large angular size, performing
a complete H
LF of A1367 and Coma with that of the
Virgo cluster. Given its large angular size, performing
a complete H![]() survey of this cluster would be prohibitive.
However H
survey of this cluster would be prohibitive.
However H![]() observations
of most of the brightest galaxies (230 objects brighter than B=16 mag) are available
(Boselli & Gavazzi 2002; Gavazzi et al. 2002).
Using these data we construct a "pseudo'' H
observations
of most of the brightest galaxies (230 objects brighter than B=16 mag) are available
(Boselli & Gavazzi 2002; Gavazzi et al. 2002).
Using these data we construct a "pseudo'' H![]() LF by transforming the
B band LF into an H
LF by transforming the
B band LF into an H![]() one after having shown that H
one after having shown that H![]() luminosity
and MB are found proportional one-another.
luminosity
and MB are found proportional one-another.
Figure 8 shows the H![]() luminosity vs. the absolute MBmagnitude relationship. Distances are estimated according to the Virgo cluster
group membership, as defined in Gavazzi & Boselli (1999).
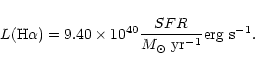
The best fit to the data gives a slope of 0.37, consistent with 0.40 (i.e. a slope
of 1 in a luminosity-luminosity plot). For simplicity we adopted this last value,
because it allows to transform the observed B band Schechter function into an H
luminosity vs. the absolute MBmagnitude relationship. Distances are estimated according to the Virgo cluster
group membership, as defined in Gavazzi & Boselli (1999).
The best fit to the data gives a slope of 0.37, consistent with 0.40 (i.e. a slope
of 1 in a luminosity-luminosity plot). For simplicity we adopted this last value,
because it allows to transform the observed B band Schechter function into an H![]() LF
of the same functional form.
Therefore we adopt:
LF
of the same functional form.
Therefore we adopt:
![\begin{displaymath}\phi'(L) = 1.07 \times (L/10^{41.2})^{-0.8}~\mbox{exp}[-(L/10^{41.2})].
\end{displaymath}](/articles/aa/full/2002/11/aa2087/img67.gif) |
(6) |
The total star formation rate per unit volume for
clusters is derived by integrating the best fitting Schechter functions over
the whole range of luminosities.
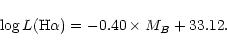
To be consistent with Gallego et al. (1995), we convert the H![]() luminosities to star formation per unit time using:
luminosities to star formation per unit time using:
 |
(7) |
![\begin{figure}
\par\includegraphics[width=8.8cm,clip]{MS2087f7.eps} \end{figure}](/articles/aa/full/2002/11/aa2087/img70.gif) |
Figure 7:
Galaxy number density per unit volume vs. the H |
The estimate of the contribution of the clusters to the
total SFR per unit volume of the local Universe, is obtained by taking into account
the local spatial density of clusters. For Abell type 2 clusters, like
Abell 1367 and Coma, this value was reported to be
![]() Mpc-3 (Bramel et al. 2000), although this number is affected by
large uncertainties. We conclude that the typical contribution of Abell type 2
clusters to the SFR per unit volume is about
Mpc-3 (Bramel et al. 2000), although this number is affected by
large uncertainties. We conclude that the typical contribution of Abell type 2
clusters to the SFR per unit volume is about
![]()
![]() yr-1, that is 0.25% of the total SFR in the local
Universe.
yr-1, that is 0.25% of the total SFR in the local
Universe.
Similarly, by integrating the Virgo H![]() luminosity function, we obtain a total
H
luminosity function, we obtain a total
H![]() luminosity density of
luminosity density of
![]() erg s-1 Mpc-3, which gives a SFR of
1.65
erg s-1 Mpc-3, which gives a SFR of
1.65 ![]() yr-1 Mpc-3. Taking into account that the
Virgo cluster is classified as Abell type 1 (Struble & Rood 1982), and
assuming the spatial density for clusters of this type (Bramel et al. 2000) of
yr-1 Mpc-3. Taking into account that the
Virgo cluster is classified as Abell type 1 (Struble & Rood 1982), and
assuming the spatial density for clusters of this type (Bramel et al. 2000) of
![]() Mpc-3, we obtain that the contribution of
type 1 clusters is
Mpc-3, we obtain that the contribution of
type 1 clusters is
![]()
![]() yr-1 Mpc-3, corresponding to 10.8% of the total SFRdensity in the local Universe.
yr-1 Mpc-3, corresponding to 10.8% of the total SFRdensity in the local Universe.
Copyright ESO 2002
![\begin{figure}
\par\includegraphics[width=8.3cm,clip]{MS2087f5a.eps}\vspace*{2mm}
\includegraphics[width=8.3cm,clip]{MS2087f5b.eps} \end{figure}](/articles/aa/full/2002/11/aa2087/img44.gif)