We have detected 18 sources over 6
A&A 384, 190-194 (2002)
DOI: 10.1051/0004-6361:20011837
A. Küpcü Yoldas - S. Balman
Department of Physics, Middle East Technical University, Inönü Bulvari, 06531 Ankara, Turkey
Received 6 November 2001 / Accepted 20 December 2001
Abstract
We have detected 18 sources over 6 ![]() threshold within two
regions 8
threshold within two
regions 8
![]() 3
3![]() 16
16
![]() 9 and 8
9 and 8
![]() 3
3 ![]() 33
33
![]() 6
in the vicinity of the point with
6
in the vicinity of the point with ![]() 03
03![]() 31
31![]() 02
02
![]() 45 (J2000)
and
45 (J2000)
and ![]() +43
+43
![]() 47
47
![]() 58
58
![]() 5 (J2000) using a
CHANDRA ACIS (S+I) observation. Two of the
sources were detected before with ROSAT HRI and one source could be
closely identified with a star in the optical catalog, USNO A-2. We have
also studied source spectra applying four spectral models to the data.
Most of the sources can be classified as Cataclysmic Variable, Low Mass
X-ray Binary or single star candidates due to their spectral
characteristics and luminosities. We also searched for the extragalactic
origin for these 18 sources. The source count rates vary between
5.8
5 (J2000) using a
CHANDRA ACIS (S+I) observation. Two of the
sources were detected before with ROSAT HRI and one source could be
closely identified with a star in the optical catalog, USNO A-2. We have
also studied source spectra applying four spectral models to the data.
Most of the sources can be classified as Cataclysmic Variable, Low Mass
X-ray Binary or single star candidates due to their spectral
characteristics and luminosities. We also searched for the extragalactic
origin for these 18 sources. The source count rates vary between
5.8
![]() -4.7
-4.7
![]() counts/s. Due to low count rates
temporal characteristics of the sources can not be studied effectively.
counts/s. Due to low count rates
temporal characteristics of the sources can not be studied effectively.
Key words: X-rays: stars - X-rays: galaxies - X-rays: binaries - stars: cataclysmic variables, neutron
As expected most of the sources we detected were faint sources, but we
did not find any SSS above 5![]() confidence
level. We analyzed the spectra of these new X-ray sources detected in two
regions 8
confidence
level. We analyzed the spectra of these new X-ray sources detected in two
regions 8
![]() 3
3![]() 16
16
![]() 9 and 8
9 and 8
![]() 3
3![]()
![]() 6
around the vicinity of the point with
6
around the vicinity of the point with
![]() 31
31![]() 02
02
![]() 45
(J2000) and
45
(J2000) and
![]() (J2000) within an
energy range of 0.3-10 keV in order to identify their nature.
(J2000) within an
energy range of 0.3-10 keV in order to identify their nature.
Details of the observation and the analysis methods are given in Sect. 2. Section 3 discusses the detection properties of the sources and Sect. 4 is on the spectral analysis and discussion.
| Src | Source |
RA | DEC | Counts/s
|
|
| 1 | CXOAYSB J033025.9+434522.3 | 03 30 25.92 | +43 45 22.32 | 1.588 |
7 |
| 2 | CXOAYSB J033037.0+434443.3 | 03 30 36.99 | +43 44 43.33 | 0.812 |
6 |
| 3 | CXOAYSB J033017.9+435604.3 | 03 30 17.98 | +43 56 04.32 | 1.478 |
8 |
| 4 | CXOAYSB J033121.0+434002.2 | 03 31 21.04 | +43 40 02.16 | 3.444 |
7 |
| 5 | 1RXH J033136.5+434213 |
03 31 36.46 | +43 42 11.59 | 1.672 |
6 |
| 6 | 1RXH J033102.3+434757 |
03 31 02.45 | +43 47 58.54 | 2.159 |
13 |
| 7 | CXOAYSB J033056.1+434824.2 | 03 30 56.11 | +43 48 24.22 | 0.940 |
8 |
| 8 | CXOAYSB J033128.6+435021.2 | 03 31 28.62 | +43 50 21.24 | 0.962 |
7 |
| 9 | CXOAYSB J033122.2+435646.8 | 03 31 22.24 | +43 56 46.77 | 1.513 |
10 |
| 10 | CXOAYSB J033117.7+435221.6 | 03 31 17.66 | +43 52 21.56 | 1.516 |
8 |
| 11 | CXOAYSB J033108.3+435751.4 | 03 31 08.28 | +43 57 51.41 | 1.332 |
8 |
| 12 | CXOAYSB J033045.0+435822.4 | 03 30 44.99 | +43 58 22.42 | 1.577 |
10 |
| 13 | CXOAYSB J033131.6+435648.8 | 03 31 31.59 | +43 56 48.78 | 0.841 |
7 |
| 14 | CXOAYSB J033105.2+435808.1 | 03 31 05.18 | +43 58 08.05 | 0.584 |
6 |
| 15 | CXOAYSB J033057.1+435750.4 | 03 30 57.12 | +43 57 50.36 | 1.312 |
7 |
| 16 | CXOAYSB J033118.3+435235.0 | 03 31 18.26 | +43 52 35.01 | 1.330 |
8 |
| 17 | CXOAYSB J033113.3+435246.7 | 03 31 13.26 | +43 52 46.68 | 1.672 |
8 |
| 18 | CXOAYSB J033106.0+440328.8 | 03 31 06.03 | +44 03 28.78 | 4.743 |
18 |
![]() ROSAT Complete Results Archive Sources for the HRI.
ROSAT Complete Results Archive Sources for the HRI.
![]() The acronym CXOAYSB is registered in the IAU Registry, see http://cdsweb.u-strasbg.fr/cgi-bin/Dic?CXOAYSB.
The acronym CXOAYSB is registered in the IAU Registry, see http://cdsweb.u-strasbg.fr/cgi-bin/Dic?CXOAYSB.
![]() Detection sigma above the background.
Detection sigma above the background.
ACIS contains 10 planar, 1024 ![]() 1024 pixel CCDs; four
arranged in a 2
1024 pixel CCDs; four
arranged in a 2![]() 2 array (ACIS-I) used for imaging, and six arranged
in a 1
2 array (ACIS-I) used for imaging, and six arranged
in a 1![]() 6 array (ACIS-S) used either for imaging or as a grating
readout. Two CCDs are back-illuminated (BI) and eight are front-illuminated (FI).
6 CCDs (2, 3, 5, 6, 7, 8) have been used during our observation. GK Per is on
CCD number 7. The level 2 data were processed using CIAO software (version 2.0).
Bad pixels were removed and the latest suitable calibration files were
used. In addition, we cleaned the data for the flaring effects of the
ACIS-S3, and the exposure was reduced to 81 ks.
6 array (ACIS-S) used either for imaging or as a grating
readout. Two CCDs are back-illuminated (BI) and eight are front-illuminated (FI).
6 CCDs (2, 3, 5, 6, 7, 8) have been used during our observation. GK Per is on
CCD number 7. The level 2 data were processed using CIAO software (version 2.0).
Bad pixels were removed and the latest suitable calibration files were
used. In addition, we cleaned the data for the flaring effects of the
ACIS-S3, and the exposure was reduced to 81 ks.
We ran the
CELLDETECT![]() algorithm (or the "sliding cell'' method), a source detection algorithm for
X-ray data. It was developed for use with the Einstein Observatory images
and also employed
by the standard processing of ROSAT data (Harnden et al. 1984).
This method was tailored to optimize the detection of unresolved sources
and had two variants, "local detect'' and "map detect''. In the local
detect that is used for our data, the background is estimated in a frame
around the detect cell. At each point where a cell is placed, a
signal-to-noise ratio of source counts to background counts is computed.
If this ratio is above the detection threshold, a candidate source is
recorded. The CELLDETECT method is good for faint point sources, outside
crowded fields.
algorithm (or the "sliding cell'' method), a source detection algorithm for
X-ray data. It was developed for use with the Einstein Observatory images
and also employed
by the standard processing of ROSAT data (Harnden et al. 1984).
This method was tailored to optimize the detection of unresolved sources
and had two variants, "local detect'' and "map detect''. In the local
detect that is used for our data, the background is estimated in a frame
around the detect cell. At each point where a cell is placed, a
signal-to-noise ratio of source counts to background counts is computed.
If this ratio is above the detection threshold, a candidate source is
recorded. The CELLDETECT method is good for faint point sources, outside
crowded fields.
The CELLDETECT algorithm, run on the exposure corrected 0.3-10 keV images
with exposure maps derived separately for five of the CCDs (2, 3, 5, 6, 7),
yielded 20 sources over 6![]() detection threshold (6
detection threshold (6![]() above the background). Since CELLDETECT divides extended sources into
multiple point sources and thus requires fine tuning of the parameters, we
have chosen different values for the fixedcell parameter for different CCDs.
The findpeaks parameter was set to "yes'' so that the adjacent detections were
recognized as a single source and the cell with the largest S/N appeared
in the source list. We have omitted three of the sources and
include one source detected with CELLDETECT algorithm over 12
above the background). Since CELLDETECT divides extended sources into
multiple point sources and thus requires fine tuning of the parameters, we
have chosen different values for the fixedcell parameter for different CCDs.
The findpeaks parameter was set to "yes'' so that the adjacent detections were
recognized as a single source and the cell with the largest S/N appeared
in the source list. We have omitted three of the sources and
include one source detected with CELLDETECT algorithm over 12 ![]() threshold at CCD 8. We have increased the threshold sigma of the
detection algorithm up to 12
threshold at CCD 8. We have increased the threshold sigma of the
detection algorithm up to 12 ![]() for CCD 8 because of the excess
number of bad pixels. Exposure maps for each of the CCDs were prepared
using the single-chip exposure map thread of CIAO 2.0 and used to
eliminate the false detections near the edges.
for CCD 8 because of the excess
number of bad pixels. Exposure maps for each of the CCDs were prepared
using the single-chip exposure map thread of CIAO 2.0 and used to
eliminate the false detections near the edges.
After searching the HEASARC data
archive![]() including multi-wavelength catalogs and mission catalogs, two of the
sources were found to be detected before with ROSAT HRI and one source
(Src 9) can be closely identified (with 0
including multi-wavelength catalogs and mission catalogs, two of the
sources were found to be detected before with ROSAT HRI and one source
(Src 9) can be closely identified (with 0
![]() 3 offset) with the
source in the optical USNO A-2 Catalog (Monet et al. 1998).
The red and blue magnitude of the
USNO source associated with Src 9 is
3 offset) with the
source in the optical USNO A-2 Catalog (Monet et al. 1998).
The red and blue magnitude of the
USNO source associated with Src 9 is
![]() 14.7,
14.7,
![]() 16.2.
For offset radii up to 2
16.2.
For offset radii up to 2
![]() 5 we obtain 5 more possible candidate
associations with the stars in USNO A-2 Catalog. However, we exclude
these possibilities since the error in RA and DEC determined by
CELLDETECT is lower than 2
5 we obtain 5 more possible candidate
associations with the stars in USNO A-2 Catalog. However, we exclude
these possibilities since the error in RA and DEC determined by
CELLDETECT is lower than 2
![]() 5.
5.
![\begin{figure}
\par\mbox{
\includegraphics[height=3.70cm,angle=-90,width=4cm,cli...
...ludegraphics[height=3.70cm,angle=-90,width=4cm,clip]{h3378s18.ps} }
\end{figure}](/articles/aa/full/2002/10/aah3378/img23.gif) |
Figure 1: Fitted spectra of the 18 sources using the data from the CHANDRA ACIS detector between 0.3-10 keV energy range. |
| Open with DEXTER | |
|
|
|
|
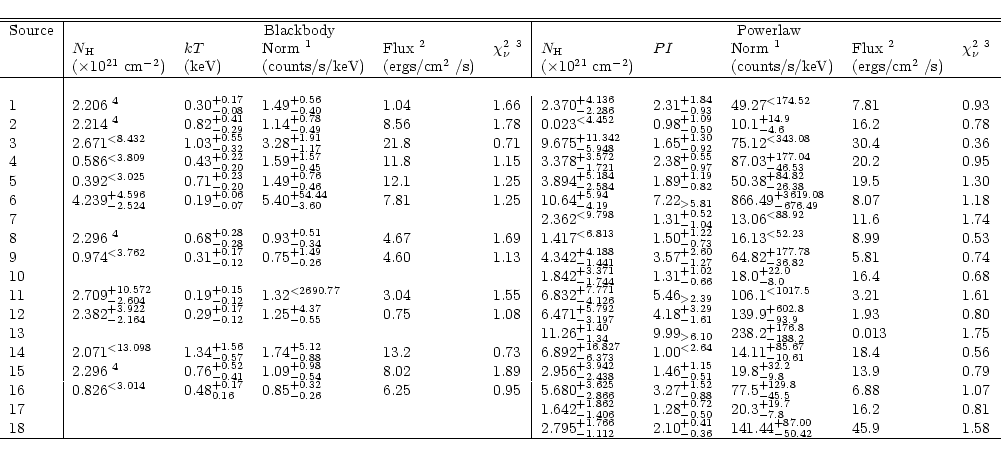
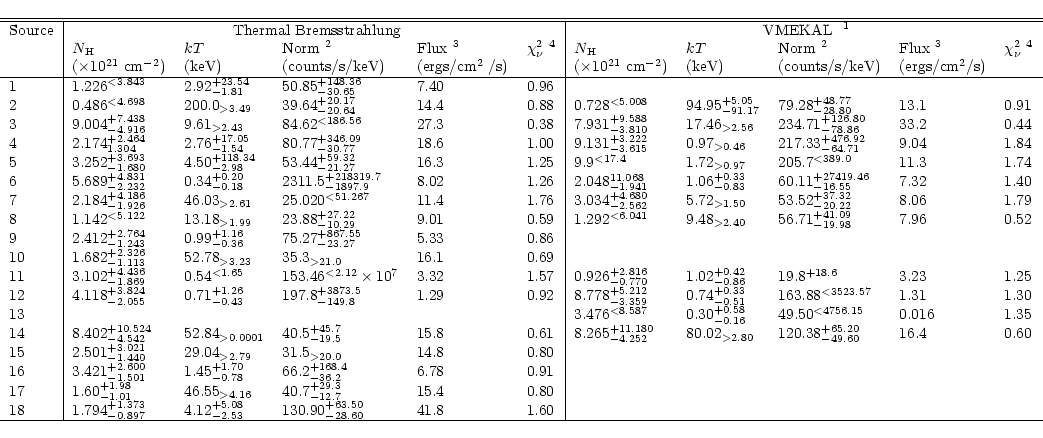
Table 2 shows the spectral parameters of the blackbody and
power law models and Table 3 shows the spectral parameters of the
bremsstrahlung and VMEKAL models. The errors on the spectral parameters
are at 2![]() confidence level. Figure 1 shows the fitted
source spectra of all the 18 sources that has the best
confidence level. Figure 1 shows the fitted
source spectra of all the 18 sources that has the best
![]() s. The
residuals in the figures are omitted since they were in a range of
2
s. The
residuals in the figures are omitted since they were in a range of
2![]() --2
--2![]() ,
and did not show significant fluctuations.
,
and did not show significant fluctuations.
Three of the sources (Src 4, 12, 16) are fitted using a power law model with
photon indicies between 2.5-4 and have blackbody temperatures around 0.5 keV
resembling the spectra of the Anomolous X-Ray Pulsars (AXPs) (Israel et al. 1999). At a distance of 10 kpc,
the luminosities of these three sources are found to be around 1032 ergs/s, and thus we exclude the possible AXP connection because the
X-ray luminosities of AXPs are around 1035 ergs/s.
Assuming a source distance of 10 kpc the luminosities of all the 18
sources are calculated to be around 1032-1033 ergs/s. Such
luminosities are consistent with galactic quiescent CV and quiescent LMXB origin.
Two of the sources (Src 11, 13) show evidence for line emission with
high absorbtion (
![]() 3
3![]() 1021 cm-2) and
the best fit is the absorbed VMEKAL model. These sources are strong
Cataclysmic Variable and quiescent LMXB candidates (Warner 1995;
Verbunt et al. 1997; Guseinov et al. 2000).
In addition, luminosities around 1032 ergs/s could be attained by
type O, B or giant stars as a consequence of shocks in the stellar winds or
coronal emission (Cassinelli et al. 1981;
Schmitt et al. 1993). When we exclude the sources with
bremsstrahlung temperatures above 1 keV (since almost all of O, B type or
giant stars have temperatures below 1 keV), we are left
with 3 candidates for galactic stars; Src 6, 9 and 12.
In general, we reject an HMXB origin for our sources, since their
luminosities are low compared with an HMXB where the luminosity is
1021 cm-2) and
the best fit is the absorbed VMEKAL model. These sources are strong
Cataclysmic Variable and quiescent LMXB candidates (Warner 1995;
Verbunt et al. 1997; Guseinov et al. 2000).
In addition, luminosities around 1032 ergs/s could be attained by
type O, B or giant stars as a consequence of shocks in the stellar winds or
coronal emission (Cassinelli et al. 1981;
Schmitt et al. 1993). When we exclude the sources with
bremsstrahlung temperatures above 1 keV (since almost all of O, B type or
giant stars have temperatures below 1 keV), we are left
with 3 candidates for galactic stars; Src 6, 9 and 12.
In general, we reject an HMXB origin for our sources, since their
luminosities are low compared with an HMXB where the luminosity is
![]() 1036 ergs/s (Guseinov et al. 2000). The
luminosities of the sources are around 1037 ergs/s at 4 Mpc in agreement with the luminosities of the X-ray Binaries
in other local galaxies, however we do not observe any host galaxy at
those directions (Bauer et al. 2001). As noted in Sect. 1, none of these sources can be SSSs. The luminosities of the SSSs are
around Eddington Luminosity (1038 ergs/s) and the blackbody
temperatures are between 10-60 eV with almost no emission above 1 keV
(Kahabka & van den Heuvel 1997). None of our 18 sources have
such spectral characteristics.
For the case of Dim Thermal Neutron stars (DTNs) or cooling neutron stars,
the spectra of DTNs and cooling neutron stars are very soft and almost
all of them are within 100 pc distance (Alpar 2001; Ögelman
1995). A neutron star with a surface temperature around 106 K and a 10 km radius has an expected luminosity around 1033 ergs/s.
The observations on cooling neutron stars depend on the sensitivity of
the X-ray telescopes. Among our 18 sources, the softest two (Src 6, 11)
have blackbody temperatures of 0.19 keV. This temperature is relatively
high for a DTN or a cooling neutron star, however we do
not exclude the possible DTN or cooling neutron star connection since the
sensitivity of CHANDRA allows us to observe fluxes around 10-15
ergs cm-2 s-1 consistent with observation of a neutron star at
10 kpc with a temperature
1036 ergs/s (Guseinov et al. 2000). The
luminosities of the sources are around 1037 ergs/s at 4 Mpc in agreement with the luminosities of the X-ray Binaries
in other local galaxies, however we do not observe any host galaxy at
those directions (Bauer et al. 2001). As noted in Sect. 1, none of these sources can be SSSs. The luminosities of the SSSs are
around Eddington Luminosity (1038 ergs/s) and the blackbody
temperatures are between 10-60 eV with almost no emission above 1 keV
(Kahabka & van den Heuvel 1997). None of our 18 sources have
such spectral characteristics.
For the case of Dim Thermal Neutron stars (DTNs) or cooling neutron stars,
the spectra of DTNs and cooling neutron stars are very soft and almost
all of them are within 100 pc distance (Alpar 2001; Ögelman
1995). A neutron star with a surface temperature around 106 K and a 10 km radius has an expected luminosity around 1033 ergs/s.
The observations on cooling neutron stars depend on the sensitivity of
the X-ray telescopes. Among our 18 sources, the softest two (Src 6, 11)
have blackbody temperatures of 0.19 keV. This temperature is relatively
high for a DTN or a cooling neutron star, however we do
not exclude the possible DTN or cooling neutron star connection since the
sensitivity of CHANDRA allows us to observe fluxes around 10-15
ergs cm-2 s-1 consistent with observation of a neutron star at
10 kpc with a temperature ![]() 0.1 keV.
Due to the relative hardness of the spectra of these 18 sources, we can
also say that none of these sources are isolated hot white dwarf
candidates since the temperatures of the hot white dwarfs are ultrasoft;
a few eVs (Vennes 1999; Finley et al. 1997).
0.1 keV.
Due to the relative hardness of the spectra of these 18 sources, we can
also say that none of these sources are isolated hot white dwarf
candidates since the temperatures of the hot white dwarfs are ultrasoft;
a few eVs (Vennes 1999; Finley et al. 1997).
We searched for the extragalactic origins of
all the 18 sources. The rest frame luminosities of AGNs and galaxies are
known to be between 1039 and 1045 ergs/s, and their spectra are
best fitted with power law models having photon indicies around 1.7-2
(Brandt et al. 2001; Ishisaki et al. 2001).
The rest frame luminosities of nearly all of the 18 sources are
calculated to be around 1042-1044 ergs/s after fitting zmodels
using XSPEC. Thus, we can not exclude the possibility of extragalactic
origin for any of the sources. Two highly absorbed sources Src 3 and 5
have rest frame luminosities around
1042 ergs/s (redshift = 0.206) and 1043 ergs/s (redshift = 0.500)
respectively. The photon indicies of these two sources are 1.61 and 1.89
respectively. Hence, we might categorize these two sources as strong AGN
and galaxy candidates. Additionally, the ![]() values may be
further evidence to exclude the extragalactic connection. The sources
with
values may be
further evidence to exclude the extragalactic connection. The sources
with ![]() higher than the value of the galactic
higher than the value of the galactic ![]() in the direction
of GK Per are more likely to be of extragalactic origin than the sources
having the same order of
in the direction
of GK Per are more likely to be of extragalactic origin than the sources
having the same order of ![]() with the galactic value. We may say that
none of these sources are clusters since they are not extended and the
rest frame luminosities of the clusters are usually higher than these values
(Schindler 1999).
with the galactic value. We may say that
none of these sources are clusters since they are not extended and the
rest frame luminosities of the clusters are usually higher than these values
(Schindler 1999).
In addition, we searched for temporal characteristics of the new sources.
We performed
power spectrum analysis on three of the sources with the highest count
rates (Src 4, 6, 18). However we could not find any significant periods.
The 3![]() -4
-4![]() detection threshold of power is around 40 in our
data, and the power upper limit of the three sources is found to be 20.
detection threshold of power is around 40 in our
data, and the power upper limit of the three sources is found to be 20.
Drawing conclusions about the classification of all the 18 sources is difficult using the X-ray data at hand. We can not study their temporal characteristics due to low count-rates, and we do not have detailed spectra. We have planned further deep observations of this field in the optical wavelengths with the 1.5 m telescope of the National Observatory at Antalya, Turkey to ensure optical identification. Complementary observations in other wavelengths are necessary for proper classification of these 18 sources.