We analyse IRAS and COBE DIRBE data at wavelengths between 2.2 and 240
The total stellar mass and luminosity of the Nuclear Bulge are
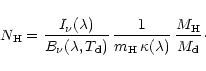
The total interstellar hydrogen mass in the Nuclear Bulge is
A&A 384, 112-139 (2002)
DOI: 10.1051/0004-6361:20020017
R. Launhardt1,2 - R. Zylka3,4 - P. G. Mezger2
1 - Division of Physics, Mathematics and Astronomy,
California Institute of Technology,
MS 105-24,
Pasadena, CA91125, USA
2 -
Max-Planck-Institut für Radioastronomie (MPIfR),
Auf dem Hügel 69, 53121 Bonn, Germany
3 -
Institut für Theoretische Astrophysik (ITA),
Tiergartenstraße 15, 69121 Heidelberg, Germany
4 -
I. Phys. Institut d. Universität zu Köln, Zülpicher Str. 77,
50937 Köln, Germany
Received 31 August 2001 / Accepted 16 November 2001
Abstract
We analyse IRAS and COBE DIRBE data at wavelengths between 2.2 and
240![]() m of the central 500pc of the Galaxy
and derive the large-scale distribution of stars and interstellar
matter in the Nuclear Bulge.
Models of the Galactic Disk and Bulge are developed
in order to correctly decompose the total surface brightness maps of the inner Galaxy
and to apply proper extinction corrections.
The Nuclear Bulge appears as a distinct, massive disk-like complex
of stars and molecular clouds which is, on a large scale, symmetric with respect to the
Galactic Centre. It is distinguished from the Galactic Bulge by its
flat disk-like morphology, very high density of stars and molecular gas,
and ongoing star formation.
The Nuclear Bulge consists of an R-2 Nuclear Stellar Cluster at the centre,
a large Nuclear Stellar Disk with radius
m of the central 500pc of the Galaxy
and derive the large-scale distribution of stars and interstellar
matter in the Nuclear Bulge.
Models of the Galactic Disk and Bulge are developed
in order to correctly decompose the total surface brightness maps of the inner Galaxy
and to apply proper extinction corrections.
The Nuclear Bulge appears as a distinct, massive disk-like complex
of stars and molecular clouds which is, on a large scale, symmetric with respect to the
Galactic Centre. It is distinguished from the Galactic Bulge by its
flat disk-like morphology, very high density of stars and molecular gas,
and ongoing star formation.
The Nuclear Bulge consists of an R-2 Nuclear Stellar Cluster at the centre,
a large Nuclear Stellar Disk with radius ![]() pc and scale height
pc and scale height ![]() pc,
and the Nuclear Molecular Disk of same size.
pc,
and the Nuclear Molecular Disk of same size.
The total stellar mass and luminosity of the Nuclear Bulge are
![]()
![]() and
and
![]()
![]() ,
respectively.
About 70% of the luminosity is due to optical and UV radiation from
young massive Main-Sequence stars which are most abundant in the Nuclear
Stellar Cluster.
For the first time, we derive a photometric mass distribution
for the central 500pc of the Galaxy which is fully consistent with
the kinematic mass distribution.
We find that the often cited R-2 distribution holds only for the central
,
respectively.
About 70% of the luminosity is due to optical and UV radiation from
young massive Main-Sequence stars which are most abundant in the Nuclear
Stellar Cluster.
For the first time, we derive a photometric mass distribution
for the central 500pc of the Galaxy which is fully consistent with
the kinematic mass distribution.
We find that the often cited R-2 distribution holds only for the central
![]() 30pc and that at larger radii the mass distribution is dominated
by the Nuclear Stellar Disk which has a flatter density profile.
30pc and that at larger radii the mass distribution is dominated
by the Nuclear Stellar Disk which has a flatter density profile.
The total interstellar hydrogen mass in the Nuclear Bulge is
![]()
![]() ,
distributed
in a warm inner disk with
,
distributed
in a warm inner disk with
![]() pc and a massive, cold outer torus
which contains more than 80% of this mass.
Interstellar matter in the Nuclear Bulge is very clumpy
with
pc and a massive, cold outer torus
which contains more than 80% of this mass.
Interstellar matter in the Nuclear Bulge is very clumpy
with ![]() 90% of the mass contained in dense and massive molecular
clouds with a volume filling factor of only a few per cent.
This extreme clumpiness, probably caused by the tidal stability limit in the gravitational
potential of the Nuclear Bulge, enables the strong interstellar radiation field
to penetrate the entire Nuclear Bulge and explains the relatively low
average extinction towards the Galactic Centre.
In addition, we find
90% of the mass contained in dense and massive molecular
clouds with a volume filling factor of only a few per cent.
This extreme clumpiness, probably caused by the tidal stability limit in the gravitational
potential of the Nuclear Bulge, enables the strong interstellar radiation field
to penetrate the entire Nuclear Bulge and explains the relatively low
average extinction towards the Galactic Centre.
In addition, we find
![]()
![]() of cold and dense material
outside the Nuclear Bulge at positive longitudes and
of cold and dense material
outside the Nuclear Bulge at positive longitudes and
![]()
![]() at negative longitudes. This material is not heated by the stars in the Nuclear
Bulge and gives rise to the observed asymmetry in the distribution of interstellar
matter in the Central Molecular Zone.
at negative longitudes. This material is not heated by the stars in the Nuclear
Bulge and gives rise to the observed asymmetry in the distribution of interstellar
matter in the Central Molecular Zone.
Key words: dust, extinction - ISM: structure - Galaxy: centre - Galaxy: structure - infrared: ISM
| Abbreviation | Meaning |
| BH | Black Hole |
| BW | Baade's Window |
| CMZ | Central Molecular Zone |
| FIR | far-infrared ( |
| FWHM | Full Width Half Maximum |
| GB | Galactic Bulge |
| GC | Galactic Centre |
| GD | Galactic Disk |
| GMC | Giant Molecular Cloud |
| HPBW | Half Power Beam Width |
| HWHM | Half Width Half Maximum |
| ISM | Interstellar Matter |
| KLF | K-band Luminosity Function |
| MIR | mid-infrared ( |
| MS | Main Sequence |
| NB | Nuclear Bulge |
| NMD | Nuclear Molecular Disk |
| NSC | Nuclear Stellar Cluster |
| NSD | Nuclear Stellar Disk |
| NIR | near-infrared ( |
| PAH | Polycyclic Aromatic Hydrocarbon |
| SED | Spectral Energy Distribution |
| ZL | Zodiacal Light |
Our present knowledge of the Galactic Centre (GC) Region has recently been reviewed
by, e.g., Blitz et al. (1993), Genzel et al. (1994), Mezger et al.
(1996; hereafter MDZ96), and Morris & Serabyn (1996).
The gas dynamics of the inner Galaxy has recently been re-investigated by
Englmaier & Gerhard (1999). To keep this introduction as
concise as possible, we quote here only the most relevant or recent
papers and refer otherwise to the corresponding sections of MDZ96 and references
therein. For the same reason we use a number of abbreviations whose
meanings are explained in Table 1.
For consistency, we adopt a distance to the Galactic Centre of R0 = 8.5kpc
throughout this paper, although recent studies suggest a somewhat lower value
(e.g., McNamara et al. 2000:
![]() kpc; see also Reid 1993).
kpc; see also Reid 1993).
MDZ96 classify the centre of our Galaxy as a mildly active Seyfert nucleus.
Although the presence of a black hole of ![]()
![]()
![]() is strongly supported by recent observations (e.g., Eckart & Genzel 1998)
it has also become clear that most of the activity in the centre of our Galaxy
is due to massive star formation in the central parsec (MDZ96, Sect. 5).
is strongly supported by recent observations (e.g., Eckart & Genzel 1998)
it has also become clear that most of the activity in the centre of our Galaxy
is due to massive star formation in the central parsec (MDZ96, Sect. 5).
The mass of the central region of our Galaxy (![]() kpc) is dominated by the
Galactic Bulge which consists mainly of old, evolved stars.
Both the stellar near-infrared (NIR) surface brightness distribution and the kinematics
of the gas suggest that the Galactic Bulge has a bar structure with its near end in the first
galactic quadrant (i.e., at positive l) (e.g., Binney et al. 1991;
Blitz & Spergel 1991; Weiland et al. 1994).
As a consequence of the dynamics caused by the gravitational potential of this bar,
the region around the co-rotation radius
kpc) is dominated by the
Galactic Bulge which consists mainly of old, evolved stars.
Both the stellar near-infrared (NIR) surface brightness distribution and the kinematics
of the gas suggest that the Galactic Bulge has a bar structure with its near end in the first
galactic quadrant (i.e., at positive l) (e.g., Binney et al. 1991;
Blitz & Spergel 1991; Weiland et al. 1994).
As a consequence of the dynamics caused by the gravitational potential of this bar,
the region around the co-rotation radius
![]() kpc is de-populated
of gas, since Interstellar Matter (ISM) is transported efficiently inward from the
Galactic Disk Molecular Ring
at the bar's outer Lindblad resonance at
kpc is de-populated
of gas, since Interstellar Matter (ISM) is transported efficiently inward from the
Galactic Disk Molecular Ring
at the bar's outer Lindblad resonance at
![]() kpc.
Inside R < 2kpc the gas settles on closed elongated (X1) orbits.
This gas is observed as a tilted disk of atomic hydrogen (
kpc.
Inside R < 2kpc the gas settles on closed elongated (X1) orbits.
This gas is observed as a tilted disk of atomic hydrogen (![]() kpc),
usually referred to as the "HI Central Disk'' (or "Nuclear Disk'')
(
kpc),
usually referred to as the "HI Central Disk'' (or "Nuclear Disk'')
(
![]()
![]() ;
Burton & Liszt 1978).
Inside the inner Lindblad resonance the X1 orbits become self-intersecting,
and shocks and angular momentum loss compress the gas into molecular form and
drive it further inward where it finally settles on more circular, stable X2 orbits
(e.g., Englmaier & Gerhard 1999).
The existence of a distinct, unusually dense molecular cloud complex in the central
few hundred pc of our Galaxy, often referred to as the "Central Molecular Zone'',
(CMZ) is well-established since the early 1970s (e.g., reviews by Genzel & Townes 1987
and MDZ96). The gas distribution in the CMZ is highly asymmetric with most of the mass
being located at positive longitudes and positive velocities
(see MDZ96, Sects. 2.2.3 and 3.4).
One of the most remarkable features in the l-v plane of the CMZ is the
"180-pc Molecular Ring'' which is hypothesized to be a shock region
between the innermost stable X1 orbit of the bar and the more circular
X2 orbits in the centre (Binney et al. 1991), but was also interpreted
as an expanding molecular ring or shell (e.g., Scoville 1972; Bally et al. 1987;
Sofue 1995b).
;
Burton & Liszt 1978).
Inside the inner Lindblad resonance the X1 orbits become self-intersecting,
and shocks and angular momentum loss compress the gas into molecular form and
drive it further inward where it finally settles on more circular, stable X2 orbits
(e.g., Englmaier & Gerhard 1999).
The existence of a distinct, unusually dense molecular cloud complex in the central
few hundred pc of our Galaxy, often referred to as the "Central Molecular Zone'',
(CMZ) is well-established since the early 1970s (e.g., reviews by Genzel & Townes 1987
and MDZ96). The gas distribution in the CMZ is highly asymmetric with most of the mass
being located at positive longitudes and positive velocities
(see MDZ96, Sects. 2.2.3 and 3.4).
One of the most remarkable features in the l-v plane of the CMZ is the
"180-pc Molecular Ring'' which is hypothesized to be a shock region
between the innermost stable X1 orbit of the bar and the more circular
X2 orbits in the centre (Binney et al. 1991), but was also interpreted
as an expanding molecular ring or shell (e.g., Scoville 1972; Bally et al. 1987;
Sofue 1995b).
The large and dense stellar complex in this region was originally thought of as the
innermost part of the more extended Galactic Bulge, with its population of old and
evolved stars. Various observations, e.g. ongoing
star formation, the presence of ionizing stars, and its extraordinary high
surface brightness suggest that this region is distinct from the
old Galactic Bulge (as originally proposed by Serabyn & Morris 1996)
and may be associated with the CMZ.
MDZ96 therefore call the innermost region R < 300pc "Nuclear Bulge'' (NB),
and clearly distinguish it from the "Galactic Bulge'' (GB).
Due to its relative proximity, the physical characteristics of the
NB of our Galaxy can be studied in detail. However, the layer of interstellar
dust in the Galactic plane restricts observations of the NB
to wavelengths
![]()
![]() m and the edge-on projection
makes a derivation of the true three-dimensional morphology difficult.
m and the edge-on projection
makes a derivation of the true three-dimensional morphology difficult.
We have begun a systematic investigation of the physical characteristics of
the NB the results
of which are being published in a series of papers. PapersI (Philipp
et al. 1999a) and II (Mezger et al. 1999) analysed the stellar
population of the central ![]() 30pc.
Based on a high-resolution
30pc.
Based on a high-resolution ![]() 2.2
2.2![]() m survey, we determined the
K-band luminosity function (KLF) of the central 30pc and interpreted it in terms
of a present-day bolometric luminosity and mass function.
Main Sequence (MS) stars with masses
m survey, we determined the
K-band luminosity function (KLF) of the central 30pc and interpreted it in terms
of a present-day bolometric luminosity and mass function.
Main Sequence (MS) stars with masses ![]() 1
1
![]() account
for
account
for ![]() 90%
of the dynamical mass, but only for 6%
of the K-band flux density.
MS stars with masses
90%
of the dynamical mass, but only for 6%
of the K-band flux density.
MS stars with masses ![]() 1
1
![]() account
for
account
for ![]() 6%
of the dynamical mass and a similar percentage of the integrated K-band flux
density, but are responsible for
6%
of the dynamical mass and a similar percentage of the integrated K-band flux
density, but are responsible for ![]() 80%
of the bolometric stellar luminosity as well as the ionization of the
observed H II regions.
The bulk of the K-band emission comes from stars evolved from the MS such as
giants, supergiants, and Wolf-Rayet stars. We find a deficiency of low-mass
stars within the central 1.25pc and indications of a high star formation
activity during the past
107-108years.
80%
of the bolometric stellar luminosity as well as the ionization of the
observed H II regions.
The bulk of the K-band emission comes from stars evolved from the MS such as
giants, supergiants, and Wolf-Rayet stars. We find a deficiency of low-mass
stars within the central 1.25pc and indications of a high star formation
activity during the past
107-108years.
Here, in Paper III, we analyse the large-scale distribution of stars and ISM in the NB using IRAS and COBE DIRBE data. The size scales addressed in this paper span tens to hundreds of parsecs. The complex structure in the central few parsecs, including, e.g., the circumnuclear disk, the mini-spiral, and the central cavity, is not addressed. In a succeeding paper, based on ground-based single-dish mm observations, we investigate the morphology and kinematics of ISM in the central part of the NB in more detail (Zylka et al., in prep.).
The paper is organized as follows: Sect. 2 describes briefly the observational data used in this paper. Section 3 describes the data reduction and analysis. In Sect. 4 we present the basic observational results, and in Sect. 5 we derive physical characteristics of the NB and the CMZ. Section 6 summarizes the results in terms of a coherent picture of the NB.
This paper is mainly based on IRAS (Infrared Astronomical Satellite) and
COBE (Cosmic Background Explorer) data covering the
wavelength range from 2.2![]() m to 240
m to 240![]() m,
which were obtained through SkyView
on the WorldWideWeb.
Additional data at mm and cm wavelengths are used for comparison.
Characteristics of the surveys of the Galactic Centre Region used in the following
analysis are given in Table 2, followed by a more detailed
description of the data. Throughout this paper we use Galactic coordinates
(
m,
which were obtained through SkyView
on the WorldWideWeb.
Additional data at mm and cm wavelengths are used for comparison.
Characteristics of the surveys of the Galactic Centre Region used in the following
analysis are given in Table 2, followed by a more detailed
description of the data. Throughout this paper we use Galactic coordinates
(
![]() )
and all maps are centered on
)
and all maps are centered on
![]()
![]() , 0
, 0![]() (and not on SgrA
(and not on SgrA![]() ,
which is at
,
which is at
![]() 0
0![]() 054, -0
054, -0![]() 046).
046).
| Wavelength range | Angular | Observations | Telescopes | References | |
| resolution | (see References) | ||||
| NIR - FIR | 1.25 |
0.7 |
10 continuum bands | COBE DIRBE | Hauser et al. (1991) |
| MIR - FIR | 12 |
1
|
4 continuum bands | IRAS | IRAS Sky Survey Atlas (ISSA) |
| Millimetre | 800 |
30 |
continuum map | CSO 10.4m | Lis & Carlstrom (1994) |
| 1.2mm | 11
|
continuum map | IRAM 30m MRT | Zylka et al. (in prep.) | |
| 2.6mm | 8
|
12CO(1-0) map | CSMT 1.2m | Bitran et al. (1997) | |
| Radio | 3cm (10GHz) | 3 |
continuum map | Nobeyama 45m | Handa et al. (1987) |
| 6cm (5000MHz) | 4
|
continuum map | Parkes 64m | Haynes et al. (1978) | |
| 11cm (2695MHz) | 4
|
continuum map | Effelsberg 100m | Reich et al. (1990b) | |
| 21cm (1408MHz) | 9
|
continuum map | Effelsberg 100m | Reich et al. (1990a) | |
The IRAS data include all data distributed as
part of the IRAS Sky Survey Atlas (ISSA) and were processed by the
Infrared Processing and Analysis Center (IPAC) to a
uniform standard with the Zodiacal Light (ZL) already subtracted. For the
present investigation,
ISSA maps in all four bands were used (i.e.,
![]() ,
25, 60, and 100
,
25, 60, and 100![]() m).
These maps have a mean angular resolution of 2
m).
These maps have a mean angular resolution of 2![]() ,
although IPAC has optimized the processing of these data for features
of size 5
,
although IPAC has optimized the processing of these data for features
of size 5![]() or more.
The 100
or more.
The 100![]() m map is heavily saturated in the central part of the NB,
and the 60
m map is heavily saturated in the central part of the NB,
and the 60![]() m map may be partially saturated towards the SgrA complex.
At each of the four wavelengths we obtained maps
of 15
m map may be partially saturated towards the SgrA complex.
At each of the four wavelengths we obtained maps
of 15![]()
![]() 10
10![]() with a pixel scale of 1
with a pixel scale of 1
![]() 5, and
40
5, and
40![]()
![]() 40
40![]() with a pixel scale of 5
with a pixel scale of 5![]() ,
respectively.
,
respectively.
The COBE Diffuse Infrared Background Experiment (DIRBE) was
planned primarily to investigate the cosmic infrared background
radiation in 10 filter bands centered at
1.25, 2.2, 3.5, 4.9, 25, 60, 100, 140, and 240![]() m (for details see
the COBE DIRBE Explanatory Supplement 1997; Hauser et al. 1998;
Kelsall et al. 1998).
The COBE DIRBE maps
cover the entire sky and provide an estimate
of the infrared intensity at each pixel and wavelength band based on
an interpolation of the observations made at various times at solar
elongations close to 90
m (for details see
the COBE DIRBE Explanatory Supplement 1997; Hauser et al. 1998;
Kelsall et al. 1998).
The COBE DIRBE maps
cover the entire sky and provide an estimate
of the infrared intensity at each pixel and wavelength band based on
an interpolation of the observations made at various times at solar
elongations close to 90![]() .
To first order, these maps depict the
sky as if it were observed through a temporally constant
interplanetary dust foreground, thus enabling straightforward modeling
and subtraction of the ZL. The DIRBE instrument has a
42
.
To first order, these maps depict the
sky as if it were observed through a temporally constant
interplanetary dust foreground, thus enabling straightforward modeling
and subtraction of the ZL. The DIRBE instrument has a
42![]()
![]() 42
42![]() instantaneous field of view.
For this study, maps in all 10 bands were obtained. The maps have an
angular resolution of
instantaneous field of view.
For this study, maps in all 10 bands were obtained. The maps have an
angular resolution of ![]() 0.7
0.7![]() and a pixel scale of
and a pixel scale of ![]() 0.35
0.35![]() (21
(21![]() ).
).
Millimetre continuum maps at 11
![]() resolution
of the central region of the NB were obtained
with the IRAM 30-m telescope during several observing runs between
1995 and 1999 (see Table 2).
These maps are only used for comparison with the COBE and
IRAS data and will be presented and discussed
in detail in Paper IV by Zylka et al. (in preparation).
resolution
of the central region of the NB were obtained
with the IRAM 30-m telescope during several observing runs between
1995 and 1999 (see Table 2).
These maps are only used for comparison with the COBE and
IRAS data and will be presented and discussed
in detail in Paper IV by Zylka et al. (in preparation).
In addition, we obtained radio continuum maps of the GC region at 3, 6, 11, and 21cm (Fig. 9) from the MPIfR Survey archive. These data are already published elsewhere (see Table 2) and the 11cm and 21cm maps are already decomposed into source and background components. From the total intensity 3cm and 6cm maps, we subtracted the background emission to obtain the source contribution. Due to the different beam sizes, observing modes, and data reduction procedures, the four data sets may not recover extended emission in the same way. Therefore, the derived flux densities given in Table 5 and shown in Fig. 10 may contain systematic uncertainties and are not suitable to derive physical characteristics of the gas from flux density ratios. We use these maps only to compare the morphology of the ionized gas with that of the stars and dust in the NB.
| |
Figure 1:
Schematic presentation of the different galactic features which contribute to
emission and absorption in the direction of the Galactic Centre Region.
The grey-scale image shows the average hydrogen density in the Galactic Disk (GD)
(0.1 to 1 cm-3; slice through the disk model described in Appendix B).
Narrow dark features correspond to spiral arms which have a 3 to 30 times enhanced
average density. Subscripts
"fg'' and "bg'' refer to the foreground and background parts of the GD with respect to the GC.
The dashed line denotes the Galactic mid-plane and solid lines mark the density
FWHM thickness of the gaseous disk (H2+H I+H II).
The interplanetary dust ring of the solar system (Zodiacal Light) is not shown.
Note that the z scale is stretched with respect to the |
| Wavelength region | Emission due to | Absorption due to | |
| NIR | 1 |
stars | dust |
| MIR | 7 |
hot dust (VSGs), PAHs | dust |
| Submm/FIR | 30 |
"classical'' dust grains | dust, negligible for
|
| Radio | 3mm- |
free-free | -- |
| synchrotron | free-free |
In order to derive surface brightness maps of the GC region from the data, the total surface brightness maps were decomposed into the individual contributing sources of radiation and extinction which were, in turn, modeled and interpolated over the GC region before they were subtracted from the total surface brightness maps. Figure 1 illustrates the different Galactic features which contribute to emission and absorption in the direction of the GC and Table 3 summarizes the different sources dominating emission and absorption in different wavelength regions. Figure 2 illustrates that, particularly at NIR wavelengths, the resulting maps of the NB depend crucially on proper decomposition, extinction corrections, and modeling of the different galactic features. Therefore, this section gives a detailed description of the data analysis process.
The major emission sources at NIR wavelengths are stars in
the Galactic Disk (GD) and GB. In addition to these features, the ZL
from interplanetary dust in the solar system contributes to the extended
near- and mid-infrared (MIR) emission.
Extinction by dust in the GD and in the
GC region itself prevents observations of the stellar component
of the NB at wavelengths shorter than 2![]() m, and must be taken into
account for wavelengths as long as
m, and must be taken into
account for wavelengths as long as
![]()
![]() m
(see Table 3). Most of the extinction in the GD arises from the
Disk Molecular Ring at galactocentric radius
m
(see Table 3). Most of the extinction in the GD arises from the
Disk Molecular Ring at galactocentric radius
![]() -5kpc.
The far sides of the GB and GD also suffer from extinction by
dust in the GC region.
In addition to these large-scale absorption features, some compact Giant Molecular
Clouds (GMCs) along the line of sight appear as discrete patches of high extinction.
These clouds could not be modeled individually, but had to be masked out before the
models were fitted.
Since GD and GB have nearly exponential emission profiles,
proper modeling was essential to obtain reliable surface brightness interpolations
over the GC region.
-5kpc.
The far sides of the GB and GD also suffer from extinction by
dust in the GC region.
In addition to these large-scale absorption features, some compact Giant Molecular
Clouds (GMCs) along the line of sight appear as discrete patches of high extinction.
These clouds could not be modeled individually, but had to be masked out before the
models were fitted.
Since GD and GB have nearly exponential emission profiles,
proper modeling was essential to obtain reliable surface brightness interpolations
over the GC region.
At wavelengths
![]()
![]() m, dust emission (i.e., mainly
re-radiation of absorbed stellar emission) from the GD and GC
region dominates over stellar emission.
The MIR emission is generally dominated by UV-excited, non-transiently-heated
very small grains and Polycyclic Aromatic Hydrocarbons (PAH's)
with a possible contribution by hot dust in circumstellar shells and photospheric
emission from cold luminous supergiants.
The bulk of the dust (>99% by mass)
in the GD and NB is relatively cold (
m, dust emission (i.e., mainly
re-radiation of absorbed stellar emission) from the GD and GC
region dominates over stellar emission.
The MIR emission is generally dominated by UV-excited, non-transiently-heated
very small grains and Polycyclic Aromatic Hydrocarbons (PAH's)
with a possible contribution by hot dust in circumstellar shells and photospheric
emission from cold luminous supergiants.
The bulk of the dust (>99% by mass)
in the GD and NB is relatively cold (![]() 15-30K).
Therefore, dust emission as tracer of the mass of ISM is best observed at FIR
and submm wavelengths.
In the range 3mm
15-30K).
Therefore, dust emission as tracer of the mass of ISM is best observed at FIR
and submm wavelengths.
In the range 3mm
![]() 6cm, free-free emission from gas
ionized by early-type MS stars dominates the radio emission of the NB.
Synchrotron radiation from relativistic electrons becomes the strongest radio
component for
6cm, free-free emission from gas
ionized by early-type MS stars dominates the radio emission of the NB.
Synchrotron radiation from relativistic electrons becomes the strongest radio
component for
![]() cm, but free-free absorption has to be taken into
account already at cm wavelengths, depending on the free-free emission measure.
cm, but free-free absorption has to be taken into
account already at cm wavelengths, depending on the free-free emission measure.
The total surface brightness
![]() observed in the direction of the GC
can be written as:
observed in the direction of the GC
can be written as:
The main goal of the data reduction was to derive surface brightness maps of the NB at different wavelengths as would be seen with no other emitting or absorbing matter present in the Galaxy. The other data mentioned in Sect. 2 were reduced by its respective authors and used as published (references in Table 2).
For reasons mentioned in Sect 3.1, surface brightness and extinction maps of the different galactic features had to be derived and modeled partially in an iterative way before they could be subtracted from the total surface brightness maps. The correct order of applying the different corrections to the data is described by Eq. (1). Figure 3 displays schematically the data flow with its recursive iterations. The general data reduction steps described in the following subsections are:
Colour correction factors for COBE (Appendix A of the
COBE/DIRBE Explanatory Supplement) and IRAS maps (Wheelock et al. 1994)
were derived for the peak
flux density ratios toward the NB, but were applied to the entire
images. The maximum correction had to be applied to the COBE 25![]() m
band (23%). For all other bands, correction factors are smaller
then 5% of the peak flux densities.
In addition, the COBE DIRBE to IRAS photometric transformation was applied
to the IRAS ISSA maps (COBE/DIRBE Explanatory Supplement; only gain
factors were used) in order to account for systematic photometric
uncertainties in the IRAS calibration (particularly in the 60 and
100
m
band (23%). For all other bands, correction factors are smaller
then 5% of the peak flux densities.
In addition, the COBE DIRBE to IRAS photometric transformation was applied
to the IRAS ISSA maps (COBE/DIRBE Explanatory Supplement; only gain
factors were used) in order to account for systematic photometric
uncertainties in the IRAS calibration (particularly in the 60 and
100![]() m bands).
m bands).
ZL emission was already subtracted from the IRAS data
issued by IPAC.
In the COBE maps we modeled the ZL outside the Galactic
Disk (between
![]()
![]() ), interpolated linearly over the
region of the disk, and subtracted the resulting maps from the COBE maps
in the wavelength bands between 2.2
), interpolated linearly over the
region of the disk, and subtracted the resulting maps from the COBE maps
in the wavelength bands between 2.2![]() m and 100
m and 100![]() m.
m.
Two major extinction-causing features have to be considered in the process of decomposing the observed surface brightness maps into individual galactic components (see Fig. 1 and Eq. (1)):
The foreground extinction due to dust in the GD can be derived in two ways:
Method 1:
Under the assumption that the intrinsic NIR colour temperature (i.e., the
intrinsic surface brightness ratio I1/I2) of the GB is uniform (see Sect. 4.2) and
can be derived at high latitudes where extinction by dust in the GD is negligible,
a foreground extinction map can be derived from the observed NIR
surface brightness ratio
![]() :
:
Method 2:
In order to derive the extinction by dust on the near side of the GD from
the optically thin FIR emission arising from lines of sight
through the entire disk, we developed a three-dimensional model of
the dust distribution in the GD, which is described in Appendix B.
Our best model yields
![]() mag towards the front side of the NB
and the latitude
mag towards the front side of the NB
and the latitude ![]() profile at l = 0
profile at l = 0![]() shown in Fig. 4.
shown in Fig. 4.
These two methods are completely independent. They yield similar, but systematically
slightly different latitude extinction profiles.
Since both methods have their weak points, we finally used an extinction map
which was obtained by scaling the extinction map derived by method 2 to the
average of the two extinction profiles at l = 0![]() which is also shown in
Fig. 4.
which is also shown in
Fig. 4.
Since radiation from the far sides of GB and GD suffers from extinction
by dust in the GC region, the modeled or interpolated surface brightness
maps of these features have to be corrected for this extinction before they can be
subtracted from the raw maps.
Assuming a homogeneous and axisymmetric distribution of dust in the NB, the results from
Sect. 4.1 (see Fig. 4) suggest a visual extinction of
![]() 30mag through the entire NB.
In contrast, we derive
30mag through the entire NB.
In contrast, we derive
![]() mag
from the FIR dust continuum emission, assuming a
homogeneous dust distribution (Sect. 5.6).
Uncertainties in our dust model may contribute to, but cannot fully explain this discrepancy.
Rather we argue in Sect. 5.6, that the ISM in the CMZ
is extremely clumpy with most of the mass being concentrated in
small, ultra-opaque molecular clouds which cover
mag
from the FIR dust continuum emission, assuming a
homogeneous dust distribution (Sect. 5.6).
Uncertainties in our dust model may contribute to, but cannot fully explain this discrepancy.
Rather we argue in Sect. 5.6, that the ISM in the CMZ
is extremely clumpy with most of the mass being concentrated in
small, ultra-opaque molecular clouds which cover ![]() 10%
of the area of the NB and block the stellar radiation nearly completely.
In Sect. 4.3.2 we derive
10%
of the area of the NB and block the stellar radiation nearly completely.
In Sect. 4.3.2 we derive
![]() mag for the average diffuse
extinction through the NB.
Therefore, the far side parts of GB and GD were corrected with an
extinction map which was derived by scaling the total hydrogen column density map
of the CMZ (Fig. 16b) to
mag for the average diffuse
extinction through the NB.
Therefore, the far side parts of GB and GD were corrected with an
extinction map which was derived by scaling the total hydrogen column density map
of the CMZ (Fig. 16b) to
![]() mag plus a 10%
blockage factor within the
mag plus a 10%
blockage factor within the
![]() cm-2 contour.
The assumption that the degree of clumpiness
of ISM is the same inside and outside the NB may not hold true completely,
but is certainly a better approximation of the physical conditions than assuming
homogeneous matter distribution.
cm-2 contour.
The assumption that the degree of clumpiness
of ISM is the same inside and outside the NB may not hold true completely,
but is certainly a better approximation of the physical conditions than assuming
homogeneous matter distribution.
To derive the size and morphology of the stellar NB, the NIR emission from the NB itself
was, in addition, corrected for extinction by dust inside the NB.
In Sect. 5.5 we decompose the total hydrogen column density map of the CMZ
into material located inside and outside the NB.
An intrinsic extinction map of the NB was then derived by scaling its ![]() map (Fig. 16d) in the same way as above
(i.e.,
map (Fig. 16d) in the same way as above
(i.e., ![]() (NB)=20mag plus 10%
blockage).
In correcting the NIR surface brightness of the NB for intrinsic extinction, we assumed that stars
and diffuse dust within the NB are homogeneously mixed.
Intrinsic (
(NB)=20mag plus 10%
blockage).
In correcting the NIR surface brightness of the NB for intrinsic extinction, we assumed that stars
and diffuse dust within the NB are homogeneously mixed.
Intrinsic (
![]() )
and observed surface brightness (
)
and observed surface brightness (
![]() )
are then related by:
)
are then related by:
The "observed'' surface brightness distribution of the GD
at all wavelengths was
derived by interpolating the total observed surface brightness between selected
regions in the longitude intervals 3.8![]()
![]() 20
20![]() (i.e.
within the inner tangent to the Disk Molecular Ring, but outside the NB).
The regions used for deriving the average disk emission profile were
determined by comparing NIR and FIR maps in order to avoid
areas which deviate strongly from the average disk profile, like
heavily FIR-emitting or NIR-absorbing GMCs, bright
star-forming regions, or gaps in the dust disk.
At NIR wavelengths (DIRBE bands 1 to 4), GD and GB are superimposed
at longitudes
(i.e.
within the inner tangent to the Disk Molecular Ring, but outside the NB).
The regions used for deriving the average disk emission profile were
determined by comparing NIR and FIR maps in order to avoid
areas which deviate strongly from the average disk profile, like
heavily FIR-emitting or NIR-absorbing GMCs, bright
star-forming regions, or gaps in the dust disk.
At NIR wavelengths (DIRBE bands 1 to 4), GD and GB are superimposed
at longitudes
![]()
![]() and the surface brightness of the GD
cannot be derived independently. Therefore, it was first modeled further
out (|l| > 20
and the surface brightness of the GD
cannot be derived independently. Therefore, it was first modeled further
out (|l| > 20![]() )
and subtracted from the total emission before modeling and
subtracting iteratively the surface brightness distributions of GB
(see Sect. 3.7) and inner GD.
Before the GD emission was finally subtracted from the total surface
brightness maps, it was decomposed into contributions from the near and far
sides (considering extinction by dust in the near side of the GD)
and corrected for extinction in the GC region as described in Sect. 3.5.
)
and subtracted from the total emission before modeling and
subtracting iteratively the surface brightness distributions of GB
(see Sect. 3.7) and inner GD.
Before the GD emission was finally subtracted from the total surface
brightness maps, it was decomposed into contributions from the near and far
sides (considering extinction by dust in the near side of the GD)
and corrected for extinction in the GC region as described in Sect. 3.5.
To derive NIR surface brightness maps of the NB, all contributions from
the GB must be subtracted.
Here, we assume that the GB and NB are morphologically
different features and that the central surface brightness profile of the GB
can be derived from its outer parts. Since the surface brightness profile
of the GB has a centrally peaked exponential (or similar) shape and is
not symmetric, proper extinction correction and interpolation over the central
region is crucial. When properly corrected for foreground extinction, the
often-referred peanut shape of the surface brightness distribution nearly disappears
and a box-shaped asymmetric ellipsoid remains
(Fig. 5a).
Since there is striking evidence that the GB is a triaxial
stellar bar with its near end at positive longitudes (e.g., Binney et al. 1991;
Blitz & Spergel 1991; Weiland et al. 1994), its surface brightness distribution
cannot be modeled by a simple symmetric function.
Therefore, we followed for the most part the approach of Dwek et al. (1995),
Stanek et al. (1997), and Freudenreich (1998), and modeled the GB
as a triaxial ellipsoidal bar with a centrally peaked volume emissivity ![]() .
We have tried sech2, Gaussian, and exponential volume emissivity profiles and found
the exponential models, represented by:
.
We have tried sech2, Gaussian, and exponential volume emissivity profiles and found
the exponential models, represented by:
In the GD-subtracted COBE NIR maps of the GB corrected for extinction by dust in the GD (Sect. 3.5), both the region of the CMZ and of individual opaque GMCs were masked out before the models were fitted to the observed surface brightness distribution. Parameters of our best-fit GB model are given in Table 4. The Spectral Energy Distribution (SED) of the GB is derived and analysed in Sect. 4.2 (Fig. 6). Figure 5 compares the model with the observed surface brightness distribution.
The modeled surface brightness maps of the GB were then corrected for
extinction by dust in the GC region (i.e., the CMZ):
![\begin{figure}
\par\includegraphics[width=8.8cm,clip]{ms3107_fig4.ps}
\end{figure}](/articles/aa/full/2002/10/aah3107/img88.gif) |
Figure 4: Visual extinction towards the front-side of Galactic and Nuclear Bulge, due to dust in the Galactic Disk. Dotted curve: extinction profile derived from 3D model of the dust distribution in the GD (Sect. 3.5.1, Method 2). Dashed curve: extinction profile derived from reddening of the GB (stellar) NIR emission (Sect. 3.5.1, Method 1). Solid curve: average of the two former profiles, which we use to correct the NIR maps of the NB. Grey dots: extinction profile derived by Catchpole et al. (1990) from colour-magnitude diagrams of stars in the direction of the GC. This profile relates to the Centre of the Galaxy, i.e. it includes extinction by dust inside the NB. |
In Fig. 4, the latitude profiles of extinction between the
Sun and the front sides of GB and NB at l=0![]() ,
as derived in
Sect. 3.5, are shown. The average extinction profile, which we finally
used, can be approximated by the sum of two sech2 functions:
,
as derived in
Sect. 3.5, are shown. The average extinction profile, which we finally
used, can be approximated by the sum of two sech2 functions:
| Parameter | Value |
| Sun dist. from Galactic Center R0a | 8.5kpc |
| Sun dist. from Galactic Plane Z0a | 16pc |
| Bar X scale length ax | 1.1kpc |
| Bar Y scale length ay | 0.36kpc |
| Bar Z scale length az | 0.22kpc |
| Bar face-on shape parameter |
1.6 |
| Bar edge-on shape parameter
|
3.2 |
| Bar in-plane tilt angle |
15 |
| Bar out-of-plane tilt angle |
-1 |
|
|
(
|
|
|
(
|
|
|
(
|
|
|
(
|
| Average effective temperature
|
(
|
| Total Luminosity
|
( |
The parameters of our "best-fit'' triaxial bar model of the GB
(Sect. 3.7 and Eqs. (4) to (6))
are summarized in Table 4, and the result is shown in
Fig. 5.
Our model yields similar axis ratios,
(ax:ay:az)![]() (3:1:0.6), and projected surface
brightness profiles as the best-fit models of Dwek et al. (1995) and
Freudenreich (1998).
The tilt angle of the bar's major axis against the line of sight
in our model is
(3:1:0.6), and projected surface
brightness profiles as the best-fit models of Dwek et al. (1995) and
Freudenreich (1998).
The tilt angle of the bar's major axis against the line of sight
in our model is
![]() 15
15![]() .
Other studies favor a somewhat larger tilt angle of 16-25
.
Other studies favor a somewhat larger tilt angle of 16-25![]() (e.g., Englmaier & Gerhard 1999).
Note that our goal was to obtain a good fit to the projected surface brightness
distribution of the GB in order to subtract it from the COBE maps, rather than
to derive a detailed model of the three-dimensional morphology of the bar.
We did not explore the whole parameter space and we do not claim that our
model is unique.
(e.g., Englmaier & Gerhard 1999).
Note that our goal was to obtain a good fit to the projected surface brightness
distribution of the GB in order to subtract it from the COBE maps, rather than
to derive a detailed model of the three-dimensional morphology of the bar.
We did not explore the whole parameter space and we do not claim that our
model is unique.
In Fig. 6, the integrated SED of the GB is shown.
The NIR flux densities were derived by integrating the
models at 2.2, 3.5, and 4.9![]() m within
m within
![]()
![]() and
and
![]()
![]() and
are listed in Table 4.
A weighted least-square black-body fit to these points yields an average effective
temperature of the Bulge stars of
and
are listed in Table 4.
A weighted least-square black-body fit to these points yields an average effective
temperature of the Bulge stars of
![]() K.
Since we found no evidence for a colour gradient in the GB,
a lower limit to the average effective stellar temperature can be derived
from the uncorrected NIR surface brightness ratios at high latitudes
where the extinction is low (e.g., Baade's Window:
K.
Since we found no evidence for a colour gradient in the GB,
a lower limit to the average effective stellar temperature can be derived
from the uncorrected NIR surface brightness ratios at high latitudes
where the extinction is low (e.g., Baade's Window:
![]() 1
1![]() , -3.9
, -3.9![]() ,
,
![]() mag).
The best black-body fit to these points yields
mag).
The best black-body fit to these points yields ![]() 3850K
which is in good agreement with our estimate of
3850K
which is in good agreement with our estimate of
![]() (GB).
We tried different bar models and fitting routines; the derived total
flux densities were nearly independent of the particular model.
(GB).
We tried different bar models and fitting routines; the derived total
flux densities were nearly independent of the particular model.
Our result agrees well with the volume emissivity ratios derived by
Freudenreich (1998) for his models S and E.
The total luminosity of the GB derived from our SED fit to the NIR
flux densities is
![]()
![]() .
Since there is no evidence for ongoing star formation and the presence of
hot massive stars in the GB, which would contribute considerable luminosity
at shorter wavelengths, this value represents the bolometric
luminosity of the GB.
Our estimate is intermediate to the GB luminosities of
.
Since there is no evidence for ongoing star formation and the presence of
hot massive stars in the GB, which would contribute considerable luminosity
at shorter wavelengths, this value represents the bolometric
luminosity of the GB.
Our estimate is intermediate to the GB luminosities of
![]()
![]() derived by Dwek et al. (1995)
from COBE NIR observations and
the 2.2
derived by Dwek et al. (1995)
from COBE NIR observations and
the 2.2![]() m luminosity function of Bulge stars and of
m luminosity function of Bulge stars and of
![]()
![]()
![]() derived by Maihara et al. (1978)
from their 2.4
derived by Maihara et al. (1978)
from their 2.4![]() m observations of the GC region.
Dwek et al. (1995) derive a total stellar mass of the GB of
m observations of the GC region.
Dwek et al. (1995) derive a total stellar mass of the GB of
![]()
![]() and a mass-to-luminosity ratio of
and a mass-to-luminosity ratio of ![]() 2
2
![]() /
/
![]() .
The central mass and luminosity volume densities of the GB are
.
The central mass and luminosity volume densities of the GB are
![]()
![]() pc-3 and
pc-3 and
![]()
![]() pc-3,
respectively.
The numbers depend only weekly on the value of the total luminosity, which
is more sensitive to the exact integration area and how the outer GB is modeled.
pc-3,
respectively.
The numbers depend only weekly on the value of the total luminosity, which
is more sensitive to the exact integration area and how the outer GB is modeled.
![\begin{figure}
\par\includegraphics[width=8.8cm,clip]{ms3107_fig8.ps}
\end{figure}](/articles/aa/full/2002/10/aah3107/img123.gif) |
Figure 8:
Thermal dust emission from the Nuclear Bulge as seen by IRAS (ISSA maps,
angular resolution |
![\begin{figure}
\par\includegraphics[width=8.8cm,clip]{ms3107_fig9.ps}
\end{figure}](/articles/aa/full/2002/10/aah3107/img124.gif) |
Figure 9: Radio continuum emission from the Nuclear Bulge. These data were obtained from different data bases (see Table 2 for references). FWHM beam sizes are shown as black circles in the lower left corners of the maps. Middle and right panels show the corresponding longitude and latitude profiles as in Fig. 7. |
Images and surface brightness profiles of the NB
ranging from ![]() 2.2
2.2![]() m to 240
m to 240![]() m
derived from the COBE DIRBE and IRAS ISSA maps
and processed as described in Sect. 3
are shown in Figs. 7 and 8.
Note that these images are not corrected for extinction by dust
inside the NB and that the FIR maps contain emission from dust in the NB
and in the outer CMZ (see Sect. 5.5).
For comparison, we also show radio continuum maps of the NB which were
obtained from different data bases (Fig. 9; see Table
2 for references).
At NIR wavelengths, the NB emits stellar continuum radiation, mainly from
red giants and supergiants.
The NB also emits strong MIR/FIR/submm dust emission together with free-free
and synchrotron radio emission. In addition, the molecular gas exhibits strong
line emission (see Fig. 16a).
Pertinent fit and other parameters are given in Table 5.
m
derived from the COBE DIRBE and IRAS ISSA maps
and processed as described in Sect. 3
are shown in Figs. 7 and 8.
Note that these images are not corrected for extinction by dust
inside the NB and that the FIR maps contain emission from dust in the NB
and in the outer CMZ (see Sect. 5.5).
For comparison, we also show radio continuum maps of the NB which were
obtained from different data bases (Fig. 9; see Table
2 for references).
At NIR wavelengths, the NB emits stellar continuum radiation, mainly from
red giants and supergiants.
The NB also emits strong MIR/FIR/submm dust emission together with free-free
and synchrotron radio emission. In addition, the molecular gas exhibits strong
line emission (see Fig. 16a).
Pertinent fit and other parameters are given in Table 5.
The COBE NIR images show a relatively compact source elongated ![]() 2-3
2-3![]() in longitude and unresolved in latitude (upper three panels in
Fig. 7).
The 4.9
in longitude and unresolved in latitude (upper three panels in
Fig. 7).
The 4.9![]() m image, which is least affected by extinction, shows this elongated
structure most clearly.
The 2.2
m image, which is least affected by extinction, shows this elongated
structure most clearly.
The 2.2![]() m image exhibits some low-level extended emission, which may be
due to uncertainties in the extinction correction and de-composition process
and will, therefore, not be discussed here.
At
m image exhibits some low-level extended emission, which may be
due to uncertainties in the extinction correction and de-composition process
and will, therefore, not be discussed here.
At ![]() 1.25
1.25![]() m (DIRBE band 1), the extinction towards the NB and
the uncertainties
in the data reduction are too large to produce a meaningful
result; therefore we don't show nor use the 1.25
m (DIRBE band 1), the extinction towards the NB and
the uncertainties
in the data reduction are too large to produce a meaningful
result; therefore we don't show nor use the 1.25![]() m image here.
Visible especially at 2.2
m image here.
Visible especially at 2.2![]() m is a source at
m is a source at
![]()
![]() which has a "bluer'' SED than that of the average NB.
This source, referred to as IRAS17393-3004, is the
brightest NIR source seen in the direction of the NB. It has been
investigated by Philipp et al. (1999b) and is classified as an
M4 supergiant surrounded by a dust shell and located at a distance
of
which has a "bluer'' SED than that of the average NB.
This source, referred to as IRAS17393-3004, is the
brightest NIR source seen in the direction of the NB. It has been
investigated by Philipp et al. (1999b) and is classified as an
M4 supergiant surrounded by a dust shell and located at a distance
of ![]() 4.7kpc from the sun.
Therefore, we modeled this source by a Gaussian and subtracted it from the
final NIR images (dotted curve in the
longitude profiles in Fig. 7).
The surface brightness longitude profiles of the resulting images are
asymmetric and peak at
4.7kpc from the sun.
Therefore, we modeled this source by a Gaussian and subtracted it from the
final NIR images (dotted curve in the
longitude profiles in Fig. 7).
The surface brightness longitude profiles of the resulting images are
asymmetric and peak at
![]()
![]() .
Although this is marginal
compared to the 0.7
.
Although this is marginal
compared to the 0.7![]() DIRBE beam, this asymmetry is seen at all
wavelengths and only at
DIRBE beam, this asymmetry is seen at all
wavelengths and only at
![]()
![]() m does the peak shift
towards larger l.
m does the peak shift
towards larger l.
The COBE MIR images are less extended in longitude than the NIR and FIR
images, indicating that hot dust emission arises mainly from the inner part
of the NB. The 12![]() m image shows an extended, low-level halo.
Since the strong PAH feature at 11.3
m image shows an extended, low-level halo.
Since the strong PAH feature at 11.3![]() m lies in this band, this may indicate
that UV-excited PAHs in and around the NB are more extended than "normal''
warm and hot dust. The 12
m lies in this band, this may indicate
that UV-excited PAHs in and around the NB are more extended than "normal''
warm and hot dust. The 12![]() m halo is also seen
in the IRAS image which has a much higher angular resolution
(Fig. 8). The IRAS 12 and 25
m halo is also seen
in the IRAS image which has a much higher angular resolution
(Fig. 8). The IRAS 12 and 25![]() m images, too, indicate that the
bulk of the MIR emission arises from a very compact region which includes
the SgrA Radio Complex and the Radio Arc and Bridge
(MDZ96; Sofue 1994; Reich 1994).
m images, too, indicate that the
bulk of the MIR emission arises from a very compact region which includes
the SgrA Radio Complex and the Radio Arc and Bridge
(MDZ96; Sofue 1994; Reich 1994).
The COBE FIR images show the same general morphology as the NIR images, i.e.,
the emission is extended in l with an asymmetry towards positive l,
and is basically unresolved in b.
While at negative longitudes the emission extends out to
![]()
![]() at all wavelengths, its extent towards positive longitudes increases
with increasing wavelength up to nearly 4
at all wavelengths, its extent towards positive longitudes increases
with increasing wavelength up to nearly 4![]() at 240
at 240![]() m. This indicates
a large excess of cold dust at positive l which extends much further out then
the stellar NIR emission and the emission of warm dust.
The excess of cold dust emission at l > +1.7
m. This indicates
a large excess of cold dust at positive l which extends much further out then
the stellar NIR emission and the emission of warm dust.
The excess of cold dust emission at l > +1.7![]() can also be seen in the
100
can also be seen in the
100![]() m IRAS image (Fig. 8).
The COBE 140 and 240
m IRAS image (Fig. 8).
The COBE 140 and 240![]() m
images likewise show some extended low-level emission from cold dust outside the NB
at -2
m
images likewise show some extended low-level emission from cold dust outside the NB
at -2![]() > l > -5
> l > -5![]() .
At much higher angular resolution than the COBE maps, the IRAS
60 and 100
.
At much higher angular resolution than the COBE maps, the IRAS
60 and 100![]() m images show a very distinct and narrow ridge of emission
between
m images show a very distinct and narrow ridge of emission
between
![]()
![]() (Fig. 8), which is unresolved
(in latitude) in the COBE maps (Fig. 7).
The morphology of the extended low-level FIR emission in the IRAS maps
compares well to that of the COBE images.
(Fig. 8), which is unresolved
(in latitude) in the COBE maps (Fig. 7).
The morphology of the extended low-level FIR emission in the IRAS maps
compares well to that of the COBE images.
Although the morphology of the radio continuum maps is mainly determined by emission from distinct compact sources and source complexes, their overall shape is similar to that of the MIR IRAS maps, thus indicating that free-free emission from ionized gas (as observed at 6cm) and IR emission from hot dust have a similar distribution. The 11 and 21cm images are dominated by non-thermal synchrotron emission.
|
|
|
Telescope | Beam | |
|
FWHM size (observed) | |
| (HPBW) | at (0 |
|
|
||||
| [ |
[Hz] | [arcmin] | [MJy/sr] | [Jy] | [degr] | [degr] | |
| 2.2 | 1.36E14 | COBE | 42 | 5.6E1(1.2E2)b | 2.1E4(4.0E4)b | 1.65 (0.90, -0.75) | 0.65 (-0.35, 0.30) |
| 3.5 | 8.57E13 | COBE | 42 | 4.4E1(6.5E1)b | 1.6E4(2.2E4)b | 1.65 (0.85, -0.80) | 0.73 (-0.41, 0.32) |
| 4.9 | 6.12E13 | COBE | 42 | 3.0E1(3.8E1)b | 1.1E4(1.3E4)b | 1.58 (0.75, -0.83) | 0.70 (-0.40, 0.30) |
| 12 | 2.50E13 | COBE | 42 | 1.6E2 | 5.6E4 | 1.24 (0.62, -0.62) | 0.74 (-0.37, 0.37) |
| 12 | 2.50E13 | IRAS | 2 | 2.0E2c | 1.2E5 | 0.30 (0.19, -0.11)d | 0.17 (-0.08, 0.09)d |
| 25 | 1.20E13 | COBE | 42 | 5.3E2 | 1.4E5 | 1.01 (0.60, -0.41) | 0.64 (-0.37, 0.27) |
| 25 | 1.20E13 | IRAS | 2 | 6.0E2c | 2.0E5 | 0.30 (0.19, -0.11)d | 0.14 (-0.07, 0.07)d |
| 60 | 5.00E12 | COBE | 42 | 5.1E3 | 2.0E6 | 1.44 (0.70, -0.74) | 0.77 (-0.43, 0.34) |
| 60 | 5.00E12 | IRAS | 2 | 4.2E3c | 2.1E6 | 1.30 (0.67, -0.63) | 0.27 (-0.17, 0.10) |
| 100 | 3.00E12 | COBE | 42 | 7.4E3 | 4.1E6 | 1.94 (1.02, -0.92) | 0.80 (-0.47, 0.33) |
| 100 | 3.00E12 | IRAS | 2 | 5.6E3ce | 3.9E6e | 1.57 (0.86, -0.71) | 0.32 (-0.19, 0.13) |
| 140 | 2.14E12 | COBE | 42 | 1.0E4 | 6.2E6 | 2.22 (1.27, -0.95) | 0.78 (-0.46, 0.32) |
| 240 | 1.25E12 | COBE | 42 | 5.0E3 | 2.8E6 | 2.40 (1.45, -0.95) | 0.74 (-0.44, 0.30) |
| 800 | 3.75E11 | JCMT | 0.5 | 1.1E2c | --f | --f | --f |
| 1200 | 2.50E11 | MRT | 0.18 | 3.1E1c | --f | --f | --f |
| 3cm | 1.00E10 | Nobeyama | 3.0 | 1.9E1c | 1.8E3 | --d | --d |
| 6cm | 5.00E09 | Parkes | 4.1 | 2.0E1c | 2.5E3 | --d | --d |
| 11cm | 2.70E09 | Effelsberg | 4.3 | 1.0E1c | 2.0E3 | --d | --d |
| 21cm | 1.41E09 | Effelsberg | 9.4 | 1.6E1c | 1.8E3 | --d | --d |
![\begin{figure}
\par\includegraphics[width=8.8cm,clip]{ms3107_fig10.ps}
\end{figure}](/articles/aa/full/2002/10/aah3107/img136.gif) |
Figure 10:
Spectral energy distribution of a) the central 120pc and b) the entire NB.
The different symbols represent
COBE (squares), IRAS (circles), ground-based submm (triangles), and
radio (pentagons) data. The IRAS and ground-based radio
data were smoothed to the COBE resolution.
The solid lines show the best model fit to the observed dust and stellar
continuum data (corrected for foreground extinction only).
The dotted curves show the underlying dust and stellar continuum.
The contribution of radio continuum (free-free and synchrotron radiation) emission
is also marked by dotted lines. Fit parameters are given in Table 6.
Section 4.3.2 describes how the SED fits were derived.
Note that these SEDs do not account for the contribution of hot massive stars
at |
To compile the radio through NIR SEDs
of the central 120pc and of the entire NB, the corresponding central
surface brightnesses and integrated flux densities were derived at all wavelengths
from the final maps presented in Figs. 7 through 9.
In these maps, all contributions but the NB were removed and the remaining emission was
corrected for extinction by foreground dust, but not by dust inside the NB.
The total flux densities
![]() were integrated
within a polygon which completely includes the 3%
contour of the column density map (Fig. 16b) and which approximately
covers the range -2.5
were integrated
within a polygon which completely includes the 3%
contour of the column density map (Fig. 16b) and which approximately
covers the range -2.5![]()
![]() 3.8
3.8![]() ,
and
-1.3
,
and
-1.3![]()
![]() 1.1
1.1![]() .
This area partially includes dust in the CMZ located outside the actual NB
(see Sect. 5.5).
In addition, we derived surface brightnesses from the two submm
continuum maps listed in Table 2. The IRAS, submm, and radio continuum
maps were convolved with the DIRBE beam to obtain comparable surface brightnesses.
The central 120pc refer to the square-shaped 0.7
.
This area partially includes dust in the CMZ located outside the actual NB
(see Sect. 5.5).
In addition, we derived surface brightnesses from the two submm
continuum maps listed in Table 2. The IRAS, submm, and radio continuum
maps were convolved with the DIRBE beam to obtain comparable surface brightnesses.
The central 120pc refer to the square-shaped 0.7![]() DIRBE
beam (see Fig. 7) with an equivalent circular
aperture of 0.395
DIRBE
beam (see Fig. 7) with an equivalent circular
aperture of 0.395![]() ,
which corresponds to
,
which corresponds to
![]() pc.
The resulting surface brightnesses and flux densities are compiled in
Table 5 and were used to construct the corresponding SEDs
shown in Fig. 10.
The error bars correspond to the usually adopted
calibration uncertainties of
pc.
The resulting surface brightnesses and flux densities are compiled in
Table 5 and were used to construct the corresponding SEDs
shown in Fig. 10.
The error bars correspond to the usually adopted
calibration uncertainties of ![]() 20%
for the COBE and IRAS 12 to 240
20%
for the COBE and IRAS 12 to 240![]() m data and
m data and ![]() 30%
for the submm data. The uncertainties of the COBE NIR data were estimated from the
variations when using different GB and extinction models (40%
at 2.2
30%
for the submm data. The uncertainties of the COBE NIR data were estimated from the
variations when using different GB and extinction models (40%
at 2.2![]() m, 30%
at 3.5 and 4.9
m, 30%
at 3.5 and 4.9![]() m).
m).
To fit the observed SEDs and derive physical parameters of stars and
dust in the NB, we use a simple (not self-consistent)
radiative transfer model consisting of three
single-temperature dust components and one stellar
component. All four components are homogeneously mixed.
Hot massive MS stars are not considered since
their contribution to the K-band flux density is marginal
(except for the central few pc; see Sects. 5.1 through 5.3)
and we don't have data points shortward of 2.2![]() m.
The cold and warm dust components represent large "classical'' grains with their
temperature distribution.
Hot dust emission represents very small stochastically heated grains with a possible
contribution by PAHs as well as dust in hot circumstellar shells.
The NIR part of the SED was calculated using the model for internal
extinction in the NB described in Sect. 3.5.2.
The final SEDs are
m.
The cold and warm dust components represent large "classical'' grains with their
temperature distribution.
Hot dust emission represents very small stochastically heated grains with a possible
contribution by PAHs as well as dust in hot circumstellar shells.
The NIR part of the SED was calculated using the model for internal
extinction in the NB described in Sect. 3.5.2.
The final SEDs are ![]() fits to the observed flux densities with the
three dust temperatures and masses and the effective stellar NIR
temperature
fits to the observed flux densities with the
three dust temperatures and masses and the effective stellar NIR
temperature
![]() being free parameters.
Here,
being free parameters.
Here,
![]() is the effective black-body temperature derived from a fit to
the completely extinction-corrected NIR flux densities (2.2 to 4.9
is the effective black-body temperature derived from a fit to
the completely extinction-corrected NIR flux densities (2.2 to 4.9![]() m).
Although the 2.2
m).
Although the 2.2![]() m flux density may be slightly affected by emission from
hot stars for which the SEDs shown in Fig. 10 do not account,
m flux density may be slightly affected by emission from
hot stars for which the SEDs shown in Fig. 10 do not account,
![]() should approximately represent the average
effective stellar temperature of cool evolved stars,
which dominate the NIR luminosity of the NB (see Sect. 5.1).
The contribution of hot stars in different regions of the NB will be further discussed in
Sects. 5.1 through 5.3.
should approximately represent the average
effective stellar temperature of cool evolved stars,
which dominate the NIR luminosity of the NB (see Sect. 5.1).
The contribution of hot stars in different regions of the NB will be further discussed in
Sects. 5.1 through 5.3.
While the fit parameters for the dust emission sections of the SEDs are nearly
independent of the particular extinction model of the NB, the results for the stellar
(NIR) section depend strongly on the assumed distribution of extinction within the NB.
Since the populations of evolved stars in the Nuclear and Galactic Bulge are found to
be similar (see Sect. 5.1), we assumed
![]() .
This assumption could be fulfilled by setting
.
This assumption could be fulfilled by setting
![]() mag (plus 10%
blockage; see Sects. 3.5.2 and 5.6).
Higher values for the diffuse average extinction through the NB lead to
unreasonably high temperatures and intrinsic luminosities
(e.g.,
mag (plus 10%
blockage; see Sects. 3.5.2 and 5.6).
Higher values for the diffuse average extinction through the NB lead to
unreasonably high temperatures and intrinsic luminosities
(e.g.,
![]() mag yields
mag yields
![]() K and
K and
![]()
![]() ).
The implication of this low diffuse extinction will be discussed in Sect. 5.6.
Our model yields a total intrinsic stellar NIR luminosity
).
The implication of this low diffuse extinction will be discussed in Sect. 5.6.
Our model yields a total intrinsic stellar NIR luminosity![]() of
of
![]()
![]() ,
which does not account for the contribution from hot stars.
,
which does not account for the contribution from hot stars.
| Region (diameter): | Central 1.25pca | Central 120pcb | Entire NBc | |||||||||
| T | L | T | L | T | L | |||||||
| [K] | [
|
[
|
[K] | [
|
[
|
[K] | [
|
[
|
||||
| Cold dust | 40 | 3.3E+2 | 1.7E+5 | 24.7 | 3.6E+6 | 5.6E+7 | 21.2 | 4.7E+7 | 2.7E+8 | |||
| Warm dust | 150 | 5.8E+0 | 3.3E+6 | 59 | 1.8E+4 | 3.6E+7 | 49 | 4.2E+5 | 2.1E+8 | |||
| Hot dust | 350 | 5.0E-3 | 2.1E+5 | 200 | 1.1E+1 | 1.1E+7 | 220 | 1.6E+2 | 7.4E+7 | |||
| Dust (total) | 42 | 3.3E+2 | 3.7E+6 | 24.9 | 3.6E+6 | 1.0E+8 | 21.4 | 4.7E+7 | 5.5E+8 | |||
| Cool stars(obs)d,e | -- | -- | -- | -- | -- | 3.2E+7 | -- | -- | 1.2E+8 | |||
| Dust + cool stars (obs)d,e | -- | -- | 6.8E+6 | -- | -- | 1.3E+8 | -- | -- | 6.7E+8 | |||
| Cool stars(intrinsic)d,f | 4000 | -- | 3.1E+6g | 4600 | -- | 1.9E+8 | 4400 | -- | 6.8E+8 | |||
The corresponding SED fits to the central 120pc and the entire NB are shown in
Fig. 10 and the results of the spectral decomposition and the derived masses
and luminosities are given in Table 6.
For the NB we used a relative metallicity
![]() (Appendix B, for the dust model used see Appendix A).
Note that the dust emission in this model, and hence the derived hydrogen masses, account
for all interstellar matter in the central
(Appendix B, for the dust model used see Appendix A).
Note that the dust emission in this model, and hence the derived hydrogen masses, account
for all interstellar matter in the central ![]() 6
6![]() .
The uncertainties and the implications of the parameter fit to the SED
will be discussed in Sect. 5.
The corresponding SED for the central 1.25pc and fit parameters of its spectral
decomposition given in Table 6 are taken from PaperI.
Note that in PaperI
.
The uncertainties and the implications of the parameter fit to the SED
will be discussed in Sect. 5.
The corresponding SED for the central 1.25pc and fit parameters of its spectral
decomposition given in Table 6 are taken from PaperI.
Note that in PaperI
![]() mag was used as total foreground extinction,
assuming that all contributing stars are actually located in the central parsec
(no line-of-sight spread).
In Sect. 5 we make a further attempt to decompose the emission from the NB
into contributions from different sub-components.
mag was used as total foreground extinction,
assuming that all contributing stars are actually located in the central parsec
(no line-of-sight spread).
In Sect. 5 we make a further attempt to decompose the emission from the NB
into contributions from different sub-components.
A hydrogen column density map of the CMZ (i.e., all molecular material
in the central kpc) can be derived from the optically thin 240![]() m
dust emission (surface brightness
m
dust emission (surface brightness ![]() )
if the dust
temperature
)
if the dust
temperature ![]() is known:
is known:
 |
(9) |
Since the dust grains in the NB have a broad temperature distribution,
a simple black-body colour temperature derived from two FIR maps
is not a good representation of the true dust temperature.
Instead, we used an empirical colour temperature map derived from the
COBE 60-to-140![]() m flux ratio map of the NB.
The 140 and 60
m flux ratio map of the NB.
The 140 and 60![]() m fluxes are dominated by emission from cold (15-30K)
and warm (40-100K) dust ("classical'' grains), respectively.
Hot, stochastically
heated very small grains mainly contribute at 12 and 25
m fluxes are dominated by emission from cold (15-30K)
and warm (40-100K) dust ("classical'' grains), respectively.
Hot, stochastically
heated very small grains mainly contribute at 12 and 25![]() m.
The 60-to-140
m.
The 60-to-140![]() m surface brightness ratio was scaled to the mass-averaged
dust temperatures derived from the SED model fits to the central 120pc and the entire NB
(Fig. 10 and Table 6).
We then assumed proportionality between
m surface brightness ratio was scaled to the mass-averaged
dust temperatures derived from the SED model fits to the central 120pc and the entire NB
(Fig. 10 and Table 6).
We then assumed proportionality between ![]() and
S60/S140
in the temperature range 15
and
S60/S140
in the temperature range 15![]() 30K.
The uncertainty of this method is smaller than
30K.
The uncertainty of this method is smaller than ![]() K, which results in a 30%
uncertainty in
K, which results in a 30%
uncertainty in ![]() at 16K and 10%
at 25K.
Where the surface brightness in the 60 and 140
at 16K and 10%
at 25K.
Where the surface brightness in the 60 and 140![]() m COBE maps was below a certain cut-off
level and no reliable dust temperature could be derived, the temperature was set to 16K,
the lowest value derived in the map.
m COBE maps was below a certain cut-off
level and no reliable dust temperature could be derived, the temperature was set to 16K,
the lowest value derived in the map.
The resulting dust temperature profile is shown in Fig. 15b and will be
discussed in Sect. 5.5.
Mass-averaged dust temperatures in the CMZ are in the range 16 to 25K.
The corresponding dust temperature map was then used to convert
the COBE 240![]() m map (Fig. 7) into a
hydrogen column density map (Fig. 16b).
This map shows a convincing similarity to the
12CO(1-0) map of Bitran et al. (1997; see Fig. 16a),
indicating that both optically thin FIR dust emission and
12CO emission trace, at least on large scales, the same ISM.
Beam-averaged column densities range from 1 to
15
m map (Fig. 7) into a
hydrogen column density map (Fig. 16b).
This map shows a convincing similarity to the
12CO(1-0) map of Bitran et al. (1997; see Fig. 16a),
indicating that both optically thin FIR dust emission and
12CO emission trace, at least on large scales, the same ISM.
Beam-averaged column densities range from 1 to
15![]() 1022cm-2 with
1022cm-2 with
![]() (0
(0![]() , 0
, 0![]() )
)
![]() cm-2
(Fig. 15a).
The asymmetry in the dust temperature and column density profiles
and the relation of ISM to the stellar mass distribution in the NB
will be discussed in Sect. 5.5.
cm-2
(Fig. 15a).
The asymmetry in the dust temperature and column density profiles
and the relation of ISM to the stellar mass distribution in the NB
will be discussed in Sect. 5.5.
Integrating the hydrogen column density map (Fig. 16b) yields a
total hydrogen mass of
![]()
![]() in the
central 8
in the
central 8![]() (
(![]() 1kpc) of the Galaxy. The area -2.5
1kpc) of the Galaxy. The area -2.5![]()
![]() 3.8
3.8![]() contains
contains
![]()
![]() which is in good agreement with the mass of 4.2
which is in good agreement with the mass of 4.2
![]()
![]() derived from the SED model fit to the integrated flux densities (Sect. 4.3.2
and Table 6).
In Sect. 5.5 we decompose the
derived from the SED model fit to the integrated flux densities (Sect. 4.3.2
and Table 6).
In Sect. 5.5 we decompose the ![]() map into components inside and outside
the NB and derive the corresponding hydrogen masses and column densities.
map into components inside and outside
the NB and derive the corresponding hydrogen masses and column densities.
Based on the observational results presented in the previous section, we derive and further discuss in this section physical characteristics of stars and ISM in the NB and its immediate environment.
A comparison of the model K-band luminosity function (KLF) of the central
30pc with the KLF observed in Baade's Window indicates that
the overall populations of low and intermediate-mass MS stars
in Nuclear and Galactic Bulge are similar, but that the central
30pc have an overabundance of K-luminous giants.
These stars, which are interpreted as remnants of
high star-formation activity some 107 to 108 yrs ago
(e.g., Genzel et al. 1994), are more concentrated towards the centre than
low-mass MS stars (Paper I, Fig. 6).
Unique for the NB is a population of massive, young MS stars
and supergiants which are also strongly concentrated towards
the centre (Paper II; Genzel et al. 1996).
The contribution of these stars to both dynamic mass and NIR luminosity is
negligible (![]() 7% and
7% and ![]() 6%, respectively),
but they dominate the bolometric luminosity in the central
30pc (
6%, respectively),
but they dominate the bolometric luminosity in the central
30pc (![]() 80%) and are responsible for the ionization of the
thin intercloud medium (see Sect. 5.6).
The main contributor to the stellar mass are low-mass MS stars (>90%),
which account, however, for only
80%) and are responsible for the ionization of the
thin intercloud medium (see Sect. 5.6).
The main contributor to the stellar mass are low-mass MS stars (>90%),
which account, however, for only ![]() 6% of the NIR luminosity.
The contribution of evolved stars to the stellar mass
is negligible, but they dominate the NIR luminosity (
6% of the NIR luminosity.
The contribution of evolved stars to the stellar mass
is negligible, but they dominate the NIR luminosity (![]() 88%;
for this and the above quantitative estimates see Paper II).
Therefore, an estimate of the total stellar mass from the NIR luminosity is
only possible when certain assumptions about the mixing of low-mass MS stars
and evolved stars are made (see Sects. 5.3 and 5.4).
88%;
for this and the above quantitative estimates see Paper II).
Therefore, an estimate of the total stellar mass from the NIR luminosity is
only possible when certain assumptions about the mixing of low-mass MS stars
and evolved stars are made (see Sects. 5.3 and 5.4).
![\begin{figure}
\par\includegraphics[width=8.8cm,clip]{ms3107_fig11.ps}
\end{figure}](/articles/aa/full/2002/10/aah3107/img165.gif) |
Figure 11:
a) Contour map of the final (observed) 4.9 |
![\begin{figure}
\par\includegraphics[width=8.8cm,clip]{ms3107_fig13.ps}
\end{figure}](/articles/aa/full/2002/10/aah3107/img167.gif) |
Figure 13:
Signatures of the distribution of massive stars in the Nuclear Bulge.
a) Distribution of warm dust (50-100K, 60 |
| |
|
|
||
| NSC: |
|
|
|
|
| central 1pc3 b |
|
|
|
|
| central 1pc2 c |
|
|
|
|
| entire NSC |
|
|
|
|
| NSD: | inner |
|
|
|
| entire NSD |
|
|
|
|
| total NB: |
|
|
|
The size and morphology of the stellar NB can best be derived from the 4.9![]() m
image where stellar emission dominates and extinction effects, i.e.,
uncertainties introduced in the data reduction
and extinction correction process, are relatively small.
Figure 11a shows the final 4.9
m
image where stellar emission dominates and extinction effects, i.e.,
uncertainties introduced in the data reduction
and extinction correction process, are relatively small.
Figure 11a shows the final 4.9![]() m COBE image of the NB
corrected for foreground extinction and for extinction by dust
inside the NB (see Sect. 3.5.2).
Corresponding longitude and latitude profiles are shown in Figs. 12e and f.
Despite some sub-beam-scale asymmetry at the centre, the overall NIR emission from the NB
is symmetric with respect to the position of SgrA
m COBE image of the NB
corrected for foreground extinction and for extinction by dust
inside the NB (see Sect. 3.5.2).
Corresponding longitude and latitude profiles are shown in Figs. 12e and f.
Despite some sub-beam-scale asymmetry at the centre, the overall NIR emission from the NB
is symmetric with respect to the position of SgrA![]() .
Since the coarse angular resolution of the COBE data prohibits interpretation of asymmetries
on such a small scale, we assume that the large-scale distribution of stars in the NB
is symmetric with respect to the GC.
.
Since the coarse angular resolution of the COBE data prohibits interpretation of asymmetries
on such a small scale, we assume that the large-scale distribution of stars in the NB
is symmetric with respect to the GC.
To derive the physical size of the stellar NB, models of the volume emissivity
distribution were constructed, the resulting surface brightness distribution calculated,
convolved with the COBE beam, and then compared to
the extinction-corrected 4.9![]() m map.
m map.
It was found that the central few parsec,
which are not resolved by COBE, are dominated by the luminous
Nuclear Stellar Cluster with an
![]() power-law density profile
(sometimes called the "central R-2 star cluster'';
e.g., Becklin & Neugebauer 1968; Serabyn & Morris 1995),
and that a large-scale elliptical R-2 mass distribution
around the GC is approximately consistent with the dynamical mass contained
in the central 300pc (see Haller et al. 1996).
However, such a distribution cannot explain the observed distribution of light on
scales larger than 30pc, which is highly elliptical
and cannot be described by a single power law.
The observed NIR surface brightness distribution can much better be reproduced
by a large-scale exponential disk with the
Nuclear Stellar Cluster (NSC) at its centre.
In the following, we call this disk the Nuclear Stellar Disk (NSD) and describe
our two-component model.
power-law density profile
(sometimes called the "central R-2 star cluster'';
e.g., Becklin & Neugebauer 1968; Serabyn & Morris 1995),
and that a large-scale elliptical R-2 mass distribution
around the GC is approximately consistent with the dynamical mass contained
in the central 300pc (see Haller et al. 1996).
However, such a distribution cannot explain the observed distribution of light on
scales larger than 30pc, which is highly elliptical
and cannot be described by a single power law.
The observed NIR surface brightness distribution can much better be reproduced
by a large-scale exponential disk with the
Nuclear Stellar Cluster (NSC) at its centre.
In the following, we call this disk the Nuclear Stellar Disk (NSD) and describe
our two-component model.
1. Nuclear Stellar Cluster:
The radial K-band surface brightness distribution
![]() in the central
in the central
![]() pc
(PaperI, Fig.6, here corrected for extinction)
can be best fitted by a volume density distribution of the form:
pc
(PaperI, Fig.6, here corrected for extinction)
can be best fitted by a volume density distribution of the form:
2. Nuclear Stellar Disk:
Although other flat configurations may be conceivable for the NSD (e.g., a symmetric bar),
we adopt a disk as the most likely configuration.
The COBE NIR data are inconsistent with the disk having a single power-law emissivity profile.
Instead, we obtain a good fit with an exponential-to-a-power law radial
dependence of the volume emissivity:
The corresponding total NIR surface brightness distribution, i.e.,
the sum of the contributions from NSC and NSD,
is shown in Figs. 11b and 12c and d.
For comparison, we also show in Fig. 12d the observed latitude profile
of the IRAS 60![]() m emission from the NB (90
m emission from the NB (90
![]() resolution).
Finally, Figs. 11a and 12e and f compare, after convolution with
the COBE beam, the modeled and observed NIR surface brightness profiles. Since we assumed
symmetry with respect to the GC, the model was optimized to fit the average surface brightness
at positive and negative latitude and longitude offsets, respectively.
The observed and modeled latitude profiles do not match perfectly
(Fig. 12f). However, the small scale height of the NB together with the
uncertainties in the beam shape, which may have slightly varied during the observations,
do not allow to put better constraints on the vertical density profile of the NB.
resolution).
Finally, Figs. 11a and 12e and f compare, after convolution with
the COBE beam, the modeled and observed NIR surface brightness profiles. Since we assumed
symmetry with respect to the GC, the model was optimized to fit the average surface brightness
at positive and negative latitude and longitude offsets, respectively.
The observed and modeled latitude profiles do not match perfectly
(Fig. 12f). However, the small scale height of the NB together with the
uncertainties in the beam shape, which may have slightly varied during the observations,
do not allow to put better constraints on the vertical density profile of the NB.
Although we cannot directly observe the emission from massive hot MS stars in the NB,
their distribution can be derived from the emission by warm and hot
dust and from free-free emission from H II regions.
Figure 13 compares the NIR morphology
of the NB (cool stars, NIR model) with the distribution of the
above signatures of massive stars.
It becomes clear that massive stars are neither evenly distributed throughout the NB
nor are they present in the centre only.
They are rather concentrated in several individual clusters,
the brightest of which is centered at SgrA![]() and represents the
centre of the the NSC.
This confirms our earlier finding that young massive stars are strongly concentrated towards the
centre (Paper I), but also shows that these stars are not exclusively formed in the central few
pc of the NB. Our models account for this by extrapolating the (smooth)
radial distribution of the NSC to large radii (see Sect. 5.3).
A comprehensive overview over the distribution of H II regions and non-thermal
features in the GC Region can be found in LaRosa et al. (2000).
and represents the
centre of the the NSC.
This confirms our earlier finding that young massive stars are strongly concentrated towards the
centre (Paper I), but also shows that these stars are not exclusively formed in the central few
pc of the NB. Our models account for this by extrapolating the (smooth)
radial distribution of the NSC to large radii (see Sect. 5.3).
A comprehensive overview over the distribution of H II regions and non-thermal
features in the GC Region can be found in LaRosa et al. (2000).
The total stellar luminosity of the NB depends on the contributions by high-mass stars whose optical/UV emission cannot directly be observed due to the high extinction. It has been shown in Paper II that this contribution depends critically on the Present-Day Mass Function which in turn is determined by the star formation history of the NB (continuous star formation, star bursts, etc.). In view of these uncertainties we use the integrated NIR SED as the only observable quantity to derive the total luminosity of cool stars in the NB and discuss possible corrections to this value due to contributions by high-mass stars.
The total luminosity of cool stars in the NB can be derived by
additionally correcting the observed stellar NIR emission
(corrected for foreground extinction) for extinction by dust inside the NB.
Using the dust distribution and extinction model described in
Sect. 3.5.2, we derive
![]()
![]() (Table 6, line 7).
(Table 6, line 7).
Assuming isotropic extinction and emission from the NB and assuming further that
stellar emission is the only dust-heating source and that all stellar emission shortward of
![]() 1
1![]() m is completely absorbed by dust and re-radiated as thermal continuum
emission, the total stellar luminosity of the NB
(i.e.,
m is completely absorbed by dust and re-radiated as thermal continuum
emission, the total stellar luminosity of the NB
(i.e.,
![]() )
should be equal to the
observed total luminosity (i.e.,
)
should be equal to the
observed total luminosity (i.e.,
![]() )
when corrected for all foreground extinction.
This value amounts to
)
when corrected for all foreground extinction.
This value amounts to
![]()
![]() (Table 6, line 6, last column), very similar to the intrinsic
luminosity of cool stars derived above.
However, to conclude that hot massive MS stars do not contribute to the
bolometric luminosity of the NB is apparently wrong.
Due to the highly inhomogeneous distribution of ISM in the NB,
particularly the extreme clumpiness and very small scale height
(see Sect. 5.5), only a small fraction of the short-wavelength
stellar emission is actually absorbed and re-radiated
(i.e.,
(Table 6, line 6, last column), very similar to the intrinsic
luminosity of cool stars derived above.
However, to conclude that hot massive MS stars do not contribute to the
bolometric luminosity of the NB is apparently wrong.
Due to the highly inhomogeneous distribution of ISM in the NB,
particularly the extreme clumpiness and very small scale height
(see Sect. 5.5), only a small fraction of the short-wavelength
stellar emission is actually absorbed and re-radiated
(i.e.,
![]() )
and the total luminosity may be considerably underestimated.
)
and the total luminosity may be considerably underestimated.
Therefore, we use the intrinsic NIR luminosities of the NSC and NSD derived from our
models (Sect. 5.2), assume that they represent the total luminosity
due to cool stars, and try to supplement these values for the contribution by hot
massive stars.
In PaperI (Table 1b) we derive for the central 1.25pc a luminosity ratio of
hot (i.e., young massive) stars to cool stars (i.e. low-mass MS stars plus Giants
and Supergiants) of ![]() 30.
According to our analysis of the KLF of the central 30pc in Paper II,
the ratio
30.
According to our analysis of the KLF of the central 30pc in Paper II,
the ratio
![]() drops to 4-5 when averaged over
30pc.
This behaviour can be approximately reproduced by
assuming that
drops to 4-5 when averaged over
30pc.
This behaviour can be approximately reproduced by
assuming that
![]() holds for the entire
NSC and that
holds for the entire
NSC and that
![]() holds for the entire NSD, i.e., no
massive MS stars are associated with our model NSD.
Note that NSC and NSD are two idealized model components which overlap spatially.
The extrapolation of the NSC out to R=230pc actually provides
holds for the entire NSD, i.e., no
massive MS stars are associated with our model NSD.
Note that NSC and NSD are two idealized model components which overlap spatially.
The extrapolation of the NSC out to R=230pc actually provides
![]()
![]() due to massive MS stars outside R>30pc,
the region which is dynamically dominated by the NSD (see Sect. 5.4).
This is approximately consistent with the number of massive star clusters and giant
H II regions observed in the NSD (Fig. 13) if each of these regions
emits
due to massive MS stars outside R>30pc,
the region which is dynamically dominated by the NSD (see Sect. 5.4).
This is approximately consistent with the number of massive star clusters and giant
H II regions observed in the NSD (Fig. 13) if each of these regions
emits
![]()
![]() (e.g., Figer et al. 1999).
The NIR luminosities of NSC and NSD (Sect. 5.2 and Table 7)
convert then into a total stellar luminosity of the NB of
(e.g., Figer et al. 1999).
The NIR luminosities of NSC and NSD (Sect. 5.2 and Table 7)
convert then into a total stellar luminosity of the NB of
![]()
![]() .
The large uncertainty is mainly due to the unknown contribution by massive stars
outside the central 30pc.
We adopt this value as the currently best representation of the total stellar luminosity of the NB.
It is somewhat larger than the earlier, independent estimate of
.
The large uncertainty is mainly due to the unknown contribution by massive stars
outside the central 30pc.
We adopt this value as the currently best representation of the total stellar luminosity of the NB.
It is somewhat larger than the earlier, independent estimate of
![]()
![]() by Cox & Laureijs (1988; see MDZ96, Table 5),
which, however, did not account for the contribution by hot massive stars.
The stellar luminosities for different regions of the NB as derived from this model
are summarized in Table 9.
Table 8 summarizes the notations used for different physical components
and spatial regions and their interrelation. Note that different physical components like,
e.g., NSC and NSD, do spatially overlap, and that the characteristics of different spatial
regions listed in Table 9 represent the corresponding average of the different
model components in that region.
by Cox & Laureijs (1988; see MDZ96, Table 5),
which, however, did not account for the contribution by hot massive stars.
The stellar luminosities for different regions of the NB as derived from this model
are summarized in Table 9.
Table 8 summarizes the notations used for different physical components
and spatial regions and their interrelation. Note that different physical components like,
e.g., NSC and NSD, do spatially overlap, and that the characteristics of different spatial
regions listed in Table 9 represent the corresponding average of the different
model components in that region.
In the following we use
![]() ratios observed in different regions
to determine
ratios observed in different regions
to determine
![]() ,
then derive individual
,
then derive individual
![]() ratios for NSC and NSD, and use these ratios to convert the NIR luminosity distributions
of NSC and NSD into a photometric mass distribution of the NB.
Note that only average
ratios for NSC and NSD, and use these ratios to convert the NIR luminosity distributions
of NSC and NSD into a photometric mass distribution of the NB.
Note that only average
![]() ratios are known for certain areas
and that this ratio depends critically on the ratio of mass-dominating low-mass MS
stars to luminosity-dominating evolved stars,
which is not constant throughout the NB (see Sect. 5.1).
Here, we assume that NSC and NSD have different, but intrinsically constant
ratios are known for certain areas
and that this ratio depends critically on the ratio of mass-dominating low-mass MS
stars to luminosity-dominating evolved stars,
which is not constant throughout the NB (see Sect. 5.1).
Here, we assume that NSC and NSD have different, but intrinsically constant
![]() ratios and calibrate their values to reproduce
the effective observed
ratios and calibrate their values to reproduce
the effective observed
![]() ratios in different areas
where both components overlap.
ratios in different areas
where both components overlap.
The total mass in the central 1.25pc or 30
![]() ,
,
![]()
![]() ,
according to Genzel et al. (1997), is dominated by the central Black Hole
(
,
according to Genzel et al. (1997), is dominated by the central Black Hole
(
![]()
![]() ), which leaves a total stellar mass
of
), which leaves a total stellar mass
of
![]()
![]() in the central pc3.
Assuming that the stellar mass distribution within the NSC has the same radial dependence
as the NIR luminosity, the central mass density in Eq. (10) becomes
in the central pc3.
Assuming that the stellar mass distribution within the NSC has the same radial dependence
as the NIR luminosity, the central mass density in Eq. (10) becomes
![]()
![]() pc-3.
This yields
pc-3.
This yields
![]() which we assume to hold for the entire NSC.
The total stellar mass of the NSC becomes then
which we assume to hold for the entire NSC.
The total stellar mass of the NSC becomes then
![]()
![]() .
.
In PaperI we derive for the central 30pc
![]() .
The increase of
.
The increase of
![]() when averaged over larger areas is
consistent with the notion that the density of low-luminosity giants and
low and intermediate-mass MS stars (spectral type O9 or later), which dominate the total
stellar mass, decreases more slowly with increasing radius than that of
K-luminous giants, supergiants, and early O stars (Paper I, Fig. 6).
An effective
when averaged over larger areas is
consistent with the notion that the density of low-luminosity giants and
low and intermediate-mass MS stars (spectral type O9 or later), which dominate the total
stellar mass, decreases more slowly with increasing radius than that of
K-luminous giants, supergiants, and early O stars (Paper I, Fig. 6).
An effective
![]() ratio of 1 for the central 30pc can be
reproduced by adopting
ratio of 1 for the central 30pc can be
reproduced by adopting
![]() for the NSD, the same
value as derived for the GB (see Sect. 4.2).
This is consistent with the finding that the KLFs for low and intermediate-mass
MS stars in Nuclear and Galactic Bulge are very similar (Paper II).
Individual high-mass star-forming regions in the outer NB, which supposedly have
a lower
for the NSD, the same
value as derived for the GB (see Sect. 4.2).
This is consistent with the finding that the KLFs for low and intermediate-mass
MS stars in Nuclear and Galactic Bulge are very similar (Paper II).
Individual high-mass star-forming regions in the outer NB, which supposedly have
a lower
![]() ratio, are accounted for by extrapolating the NSC
out to R=230pc (see Sect. 5.3).
Assuming a 30% uncertainty for the
ratio, are accounted for by extrapolating the NSC
out to R=230pc (see Sect. 5.3).
Assuming a 30% uncertainty for the
![]() ratio,
the NIR luminosity of the NSD (Table 7)
converts into a photometric stellar mass of
ratio,
the NIR luminosity of the NSD (Table 7)
converts into a photometric stellar mass of
![]()
![]() .
The masses of the two model components NSC and NSD and of different
spatial regions of the NB are given in Tables 7 and 9,
respectively.
.
The masses of the two model components NSC and NSD and of different
spatial regions of the NB are given in Tables 7 and 9,
respectively.
![\begin{figure}
\par\includegraphics[width=8.8cm,clip]{ms3107_fig14.ps}
\end{figure}](/articles/aa/full/2002/10/aah3107/img236.gif) |
Figure 14:
Enclosed mass in spheres of radius
|
Figure 14 shows the mass distribution in spheres of
radius
![]() around the GC derived from our volume emissivity model
of the NB (NSC+NSD) together with the above discussed
around the GC derived from our volume emissivity model
of the NB (NSC+NSD) together with the above discussed
![]() ratios.
Also shown are the mass of the central Black Hole (Eckart & Genzel 1998),
the mass distribution in the GB (see Sect. 4.2), and the distribution
of ISM in the NB and the outer CMZ (see Sect. 5.5, here corrected for
He and metals).
The mass distribution is dominated by
the central Black Hole at
ratios.
Also shown are the mass of the central Black Hole (Eckart & Genzel 1998),
the mass distribution in the GB (see Sect. 4.2), and the distribution
of ISM in the NB and the outer CMZ (see Sect. 5.5, here corrected for
He and metals).
The mass distribution is dominated by
the central Black Hole at
![]() pc,
the NSC at 2pc
pc,
the NSC at 2pc
![]() pc,
the NSD at 30pc
pc,
the NSD at 30pc
![]() pc,
and the GB at
pc,
and the GB at
![]() pc.
This photometrically derived mass distribution in the central 500pc with the
Black hole included is compared to different dynamical mass estimates
(for references see caption Fig. 14).
Both mass distributions agree very well.
The presence of the NSD, which was inferred from the large-scale NIR surface
brightness distribution of the NB, provides a logical explanation for the "kink''
in the dynamical mass distribution at
pc.
This photometrically derived mass distribution in the central 500pc with the
Black hole included is compared to different dynamical mass estimates
(for references see caption Fig. 14).
Both mass distributions agree very well.
The presence of the NSD, which was inferred from the large-scale NIR surface
brightness distribution of the NB, provides a logical explanation for the "kink''
in the dynamical mass distribution at
![]() pc and the steep
rise between
pc and the steep
rise between
![]() pc and 100pc.
The power-law approximation by Sanders & Lowinger (1972)
(Fig. 14 curve (a); cf. Eq. (2.1) in MDZ96) also gives a reasonable
estimate of the total enclosed mass in the inner 500pc. However, it is inconsistent
with the observed highly
elliptical NIR surface brightness distribution of the NB and, in detail, does not
fit the dynamical mass distribution well. Note that these authors assumed a constant
pc and 100pc.
The power-law approximation by Sanders & Lowinger (1972)
(Fig. 14 curve (a); cf. Eq. (2.1) in MDZ96) also gives a reasonable
estimate of the total enclosed mass in the inner 500pc. However, it is inconsistent
with the observed highly
elliptical NIR surface brightness distribution of the NB and, in detail, does not
fit the dynamical mass distribution well. Note that these authors assumed a constant
![]() ratio for the entire GC region.
Also shown in Fig. 14 is the stellar mass distribution
contained in corresponding circular areas of radius
ratio for the entire GC region.
Also shown in Fig. 14 is the stellar mass distribution
contained in corresponding circular areas of radius
![]() when
integrated throughout the entire NB (curve (b)).
It reproduces correctly the integrated stellar mass in the central 30pc
derived from an analysis of the KLF of the K-band mosaic
(
when
integrated throughout the entire NB (curve (b)).
It reproduces correctly the integrated stellar mass in the central 30pc
derived from an analysis of the KLF of the K-band mosaic
(
![]()
![]() ,
Paper II).
Curve (b) cannot be directly compared to dynamical masses which refer
to spherical volumes of radius
,
Paper II).
Curve (b) cannot be directly compared to dynamical masses which refer
to spherical volumes of radius
![]() .
.
With
![]()
![]() ,
the NB accounts for
,
the NB accounts for ![]() 1-2%
of the total stellar mass in the GD and corresponds to
1-2%
of the total stellar mass in the GD and corresponds to ![]() 10%
of the mass of the GB (see Sect. 4.2).
The average mass density of stars in the NB (outside the central
10%
of the mass of the GB (see Sect. 4.2).
The average mass density of stars in the NB (outside the central ![]() 20pc)
is then
20pc)
is then
![]() (
(![]() )
)
![]() pc-3,
which is more than 40 times higher than the expected central mass density in the
GB when its exponential volume emissivity/density profile (Eq. (4))
is interpolated into the centre.
pc-3,
which is more than 40 times higher than the expected central mass density in the
GB when its exponential volume emissivity/density profile (Eq. (4))
is interpolated into the centre.
![\begin{figure}
\par\includegraphics[width=8.8cm,clip]{ms3107_fig15.ps}
\end{figure}](/articles/aa/full/2002/10/aah3107/img246.gif) |
Figure 15:
a) Longitude profile of hydrogen column density in the CMZ
(see Fig. 16b).
b) Mass-averaged dust temperature in the CMZ.
c) Total dust luminosity per pc2 (solid line).
Grey dots show the (dereddened) 4.9 |
![\begin{figure}
\par\includegraphics[width=8cm,clip]{ms3107_fig16.ps}
\end{figure}](/articles/aa/full/2002/10/aah3107/img247.gif) |
Figure 16:
a) Distribution of 12CO(1-0) (HPBW=0 |
![\begin{figure}
\par\includegraphics[width=8.8cm,clip]{ms3107_fig17.ps}
\end{figure}](/articles/aa/full/2002/10/aah3107/img248.gif) |
Figure 17:
a) Modeled radial mid-plane profile of the average hydrogen number density
in the NB (assuming homogeneous matter distribution; see discussion in
Sect. 5.5). Note that the central density depression
is not well-constrained.
b) Mass-averaged dust temperature.
c) IRAS 60 and 100 |
In Sect. 4.3.3 we derived a total hydrogen mass of
![]()
![]() for the central
for the central ![]() 1kpc
and confirmed the well-known asymmetry in the mass distribution of
ISM in the CMZ.
A comparison of the distribution of stars
(Figs. 11a and 15c)
and that of ISM (Figs. 15a and 16b)
indicates that not all of the ISM in the CMZ is
associated with the stellar NB.
There are several indicators that allow to distinguish between dust inside and outside
the stellar NB:
1kpc
and confirmed the well-known asymmetry in the mass distribution of
ISM in the CMZ.
A comparison of the distribution of stars
(Figs. 11a and 15c)
and that of ISM (Figs. 15a and 16b)
indicates that not all of the ISM in the CMZ is
associated with the stellar NB.
There are several indicators that allow to distinguish between dust inside and outside
the stellar NB:
1. The stellar radiation density inside the NB is considerably higher than outside.
Therefore, dust located inside the NB must have a higher
temperature and specific luminosity than dust outside the NB.
Figures 15b and d show that both quantities are
strongly enhanced in the central ![]()
![]() 6
(
6
(![]() 25K and 30
25K and 30
![]() /
/
![]() ,
respectively),
indicating the presence of a warm and luminous inner region
(
,
respectively),
indicating the presence of a warm and luminous inner region
(![]() pc) in the NB.
At -0
pc) in the NB.
At -0![]() 6
6
![]()
![]() 9, both quantities decrease to
9, both quantities decrease to
![]() 21K and 13-15
21K and 13-15
![]() /
/
![]() ,
respectively, indicating the presence of
colder dust in the outer region of the NB. At
,
respectively, indicating the presence of
colder dust in the outer region of the NB. At ![]()
![]() 9, the
approximate outer "edge'' of the NB, both quantities
drop sharply and approach 16-17K and 2-3
9, the
approximate outer "edge'' of the NB, both quantities
drop sharply and approach 16-17K and 2-3
![]() /
/
![]() ,
respectively, values
typical for dust located well outside the stellar NB, i.e., in the GB.
,
respectively, values
typical for dust located well outside the stellar NB, i.e., in the GB.
2. At negative l, the longitude profiles of the total dust luminosity
and the 4.9![]() m surface brightness agree well (Fig. 15c),
indicating that the main dust-heating sources have the same spatial
distribution as evolved stars, which dominate the NIR luminosity.
Dust-heating mechanisms will be discussed in Sect. 6.
In contrast, there is a relative dust luminosity excess at positive l.
m surface brightness agree well (Fig. 15c),
indicating that the main dust-heating sources have the same spatial
distribution as evolved stars, which dominate the NIR luminosity.
Dust-heating mechanisms will be discussed in Sect. 6.
In contrast, there is a relative dust luminosity excess at positive l.
3. At l > 0![]() 3 both the dust temperature and the
specific dust luminosity drop sharply from values typical for the inner NB
to values typical for ISM outside the NB (Figs. 15b and d).
Together with the large peak at
3 both the dust temperature and the
specific dust luminosity drop sharply from values typical for the inner NB
to values typical for ISM outside the NB (Figs. 15b and d).
Together with the large peak at ![]()
![]() 9
of the hydrogen column density (see Fig. 15a), this indicates
the presence of large amounts of cold dust along the line of sight at
positive longitudes.
Hence we can attribute the dust luminosity excess at positive l to cold dust
located outside the stellar NB.
By subtracting this excess from the total dust luminosity map, we obtain the luminosity
map of dust associated with the stellar NB (longitude profile shown in Fig. 15c).
9
of the hydrogen column density (see Fig. 15a), this indicates
the presence of large amounts of cold dust along the line of sight at
positive longitudes.
Hence we can attribute the dust luminosity excess at positive l to cold dust
located outside the stellar NB.
By subtracting this excess from the total dust luminosity map, we obtain the luminosity
map of dust associated with the stellar NB (longitude profile shown in Fig. 15c).
Since we showed in Sect. 5.2 that the distribution of stars
(i.e., the density of the stellar NIR radiation field) is approximately
symmetric with respect to the GC,
we make the reasonable assumption that the specific luminosity (
![]() )
of dust inside the NB
is the same at positive l as it is at negative l, where no cold dust intersects
the line of sight, and "symmetrize'' the map of the specific dust luminosity.
The mass distribution of warm luminous dust inside the stellar NB is then derived
by dividing the corrected dust luminosity map (profile shown in Fig. 15c, dotted curve)
by the corrected map of the specific dust luminosity (profile shown as dotted curve in Fig. 15d).
Low-luminosity dust outside the NB was filtered out from this map by setting
a cut-off level for the specific dust luminosity at 5
)
of dust inside the NB
is the same at positive l as it is at negative l, where no cold dust intersects
the line of sight, and "symmetrize'' the map of the specific dust luminosity.
The mass distribution of warm luminous dust inside the stellar NB is then derived
by dividing the corrected dust luminosity map (profile shown in Fig. 15c, dotted curve)
by the corrected map of the specific dust luminosity (profile shown as dotted curve in Fig. 15d).
Low-luminosity dust outside the NB was filtered out from this map by setting
a cut-off level for the specific dust luminosity at 5
![]() /
/
![]() .
The resulting hydrogen column density map of the NB is shown in Fig. 16d.
This map is almost symmetric with respect to the GC.
.
The resulting hydrogen column density map of the NB is shown in Fig. 16d.
This map is almost symmetric with respect to the GC.
However, because the column density map was calculated with the mass-averaged
dust temperature, it is only a first-order estimate to the actual distribution of ISM
in the NB. Figure 15b shows that the
dust temperature in the inner part of the NB is considerably higher than in the outer
parts. While we do not expect line-of-sight averaging effects at |l|>1![]() ,
the value of
,
the value of ![]() 25K at |l|<0
25K at |l|<0![]() 4 represents certainly an average
of cold dust in the outer NB and warm dust in the inner NB.
To correct the
4 represents certainly an average
of cold dust in the outer NB and warm dust in the inner NB.
To correct the ![]() map of the NB (Fig. 16d) for this dust
temperature gradient and to derive the three-dimensional density distribution,
we transformed it back to a 240
map of the NB (Fig. 16d) for this dust
temperature gradient and to derive the three-dimensional density distribution,
we transformed it back to a 240![]() m surface brightness map using an
effective dust temperature map (profile in Fig. 15b) symmetrized in the
same way as the specific dust luminosity (Fig. 15d).
We then constructed and optimized a volume density model of ISM in the NB to fit,
after convolution with the COBE beam, both the "observed'' 240
m surface brightness map using an
effective dust temperature map (profile in Fig. 15b) symmetrized in the
same way as the specific dust luminosity (Fig. 15d).
We then constructed and optimized a volume density model of ISM in the NB to fit,
after convolution with the COBE beam, both the "observed'' 240![]() m surface brightness
and line-of-sight integrated effective dust temperature.
Although the sparsely resolved COBE maps do not allow to put strong constraints on the
shape of the radial density profile, the flatness of the longitude FIR emission profile
is not consistent with a homogeneously filled, optically thin disk.
It rather suggests a torus-like configuration.
Since molecular line data indicate the presence of a
"180-pc Molecular Ring'' (see Sect. 6 for discussion and references),
the input configuration for our model was a 180-pc torus with
m surface brightness
and line-of-sight integrated effective dust temperature.
Although the sparsely resolved COBE maps do not allow to put strong constraints on the
shape of the radial density profile, the flatness of the longitude FIR emission profile
is not consistent with a homogeneously filled, optically thin disk.
It rather suggests a torus-like configuration.
Since molecular line data indicate the presence of a
"180-pc Molecular Ring'' (see Sect. 6 for discussion and references),
the input configuration for our model was a 180-pc torus with
![]() K
(see Fig. 15b) and an inner disk with a central density depression and
K
(see Fig. 15b) and an inner disk with a central density depression and
![]() K. The free parameters were the (radial) thickness of the torus,
its density profile, and the radial density profile and temperature of the inner disk.
The best fit to the data was obtained with:
K. The free parameters were the (radial) thickness of the torus,
its density profile, and the radial density profile and temperature of the inner disk.
The best fit to the data was obtained with:
1. A torus with R0=180pc,
![]() K, a radial density profile of the
form given given by Eq. (11) with n=4,
K, a radial density profile of the
form given given by Eq. (11) with n=4,
![]() pc
(i.e.,
pc
(i.e.,
![]() pc and
pc and
![]() pc),
and
pc),
and
![]() cm, and
cm, and
2. an inner disk with
![]() pc,
pc,
![]() K, and
K, and
![]() cm. The size and shape of the inner density depression
could, of course, not be constrained.
cm. The size and shape of the inner density depression
could, of course, not be constrained.
The presence of a sharp transition in the physical characteristics of ISM and/or
a change of the interstellar radiation field at
![]() pc
is also confirmed by the extremely sharp drop-off of the 60 and 100
pc
is also confirmed by the extremely sharp drop-off of the 60 and 100![]() m emission
at
m emission
at ![]()
![]() 7, which indicates a nearly complete absence
of warm dust (
7, which indicates a nearly complete absence
of warm dust (
![]() K) in the outer torus at R> 120pc (see Figs.
15e and 17c).
The total hydrogen masses of the inner disk and outer torus are
K) in the outer torus at R> 120pc (see Figs.
15e and 17c).
The total hydrogen masses of the inner disk and outer torus are
![]()
![]()
![]() and
and ![]()
![]()
![]() ,
respectively.
These numbers are compiled in Table 9.
The notations used for the different
stellar and ISM components of the NB and their interrelation are summarized in
Table 8.
,
respectively.
These numbers are compiled in Table 9.
The notations used for the different
stellar and ISM components of the NB and their interrelation are summarized in
Table 8.
Since the NB is basically unresolved in latitude in the COBE maps, only an upper limit
for its full scale height of 60pc (0![]() 40) could be derived.
The IRAS maps provide a much higher angular resolution. The
100
40) could be derived.
The IRAS maps provide a much higher angular resolution. The
100![]() m emission is already representative for the bulk of the dust mass, although
it may be somewhat biased towards warmer dust. A comparison between the COBE
60
m emission is already representative for the bulk of the dust mass, although
it may be somewhat biased towards warmer dust. A comparison between the COBE
60![]() m, 100
m, 100![]() m, and 240
m, and 240![]() m maps shows that cold dust extends further
than warm dust in longitude, but not in latitude.
Since the dust ridge is very prominent in the 100
m maps shows that cold dust extends further
than warm dust in longitude, but not in latitude.
Since the dust ridge is very prominent in the 100![]() m IRAS map and its scale height
is considerably larger than the IRAS beam, saturation
of the 100
m IRAS map and its scale height
is considerably larger than the IRAS beam, saturation
of the 100![]() m IRAS map in the very centre does not falsify the result much.
The vertical surface brightness profile could be best fitted by a
volume density distribution of the form of Eq. (11)
with n=1.4 and
m IRAS map in the very centre does not falsify the result much.
The vertical surface brightness profile could be best fitted by a
volume density distribution of the form of Eq. (11)
with n=1.4 and
![]() pc (0
pc (0![]() 30
30![]() 0
0![]() 03).
The distribution is centered at
03).
The distribution is centered at
![]()
![]() ,
the position of SgrA*.
This is in good agreement with the FWHM scale height of 12CO at
l = 0
,
the position of SgrA*.
This is in good agreement with the FWHM scale height of 12CO at
l = 0![]() of 50pc (Bitran et al. 1997; see Fig. 16a).
Since the 12CO emission is optically thick, the actual scale height is
expected to be somewhat overestimated by this tracer.
of 50pc (Bitran et al. 1997; see Fig. 16a).
Since the 12CO emission is optically thick, the actual scale height is
expected to be somewhat overestimated by this tracer.
In Fig. 16e, the resulting ![]() map of the NB
is displayed, and Fig. 16f shows the corresponding longitude
profile as well as a comparison between the modeled (beam-convolved)
and observed 240
map of the NB
is displayed, and Fig. 16f shows the corresponding longitude
profile as well as a comparison between the modeled (beam-convolved)
and observed 240![]() m surface brightness profiles.
The corresponding radial profiles of the mid-plane hydrogen density and
mass-averaged dust temperature are shown in Fig. 17.
We call this configuration, i.e., the inner warm disk and the outer cold torus,
the "Nuclear Molecular Disk''.
It has the same size as the Nuclear Stellar Disk,
i.e.,
m surface brightness profiles.
The corresponding radial profiles of the mid-plane hydrogen density and
mass-averaged dust temperature are shown in Fig. 17.
We call this configuration, i.e., the inner warm disk and the outer cold torus,
the "Nuclear Molecular Disk''.
It has the same size as the Nuclear Stellar Disk,
i.e.,
![]() pc and
pc and
![]() pc.
pc.
Note that the continuum data used in this paper do not allow to distinguish between a disk/torus-like and a bar-like morphology. For example, the CMZ in IC342, which resembles in many aspects our own GC region, seems to resemble a bent bar rather then a disk/torus (e.g., Schulz et al. 2001). However, the main parameters of the NB (compiled in Table 9) would not change dramatically if a bar-like morphology is assumed rather than a disk or torus-like morphology.
We attribute all other cold, low-specific-luminosity dust in the central kpc
to ISM not heated by stars in the NB, and therefore located outside the stellar NB.
Figure
16b shows the column density distribution of this material.
The hydrogen masses at positive and negative l are
![]()
![]() and
and
![]()
![]() ,
respectively.
The average dust temperature and specific dust luminosity of this material
are
,
respectively.
The average dust temperature and specific dust luminosity of this material
are
![]() -17K and
-17K and
![]() -3
-3
![]() /
/
![]() ,
respectively, compared
to
,
respectively, compared
to ![]() 20-30K and 10-50
20-30K and 10-50
![]() /
/
![]() for dust inside the NB.
The total hydrogen mass in the central 1kpc of our Galaxy (the CMZ)
amounts then to
for dust inside the NB.
The total hydrogen mass in the central 1kpc of our Galaxy (the CMZ)
amounts then to
![]()
![]() .
Of this, one third is located in the Nuclear Molecular Disk,
which is associated with the Nuclear Stellar Disk (i.e., the NB).
Our estimate of the total hydrogen mass in the CMZ is intermediate between the
values of
.
Of this, one third is located in the Nuclear Molecular Disk,
which is associated with the Nuclear Stellar Disk (i.e., the NB).
Our estimate of the total hydrogen mass in the CMZ is intermediate between the
values of
![]()
![]() and
and
![]()
![]() derived by Mauersberger & Bronfman (1998) from the optically thin C18O(1-0)
and optically thick 12CO(2-1) lines, respectively, and agrees well with
derived by Mauersberger & Bronfman (1998) from the optically thin C18O(1-0)
and optically thick 12CO(2-1) lines, respectively, and agrees well with
![]() 2-6
2-6
![]()
![]() derived by Sodroski et al. (1995)
from COBE DIRBE data.
derived by Sodroski et al. (1995)
from COBE DIRBE data.
The total mass of the cold high-column density complex at ![]()
![]() 9
is
9
is
![]()
![]() ,
of which the SgrB2 GMC at
,
of which the SgrB2 GMC at ![]()
![]() 7
contains
7
contains ![]() 10% (Gordon et al. 1993).
If this complex would be located in front of the NB, it would cause high
extinction.
We assumed that the same low fraction of the total
mass in this complex as inside the NB contributes to diffuse extinction
while most of the mass is concentrated in small, ultra-opaque clouds which block 10%
of the light (see Sect. 5.6), and tested the effect of this cloud complex
on the final (extinction-corrected) stellar NIR maps of the NB.
Figure 18 shows clearly that the model with the cloud complex located in
front of the NB yields a strong, implausible 2.2
10% (Gordon et al. 1993).
If this complex would be located in front of the NB, it would cause high
extinction.
We assumed that the same low fraction of the total
mass in this complex as inside the NB contributes to diffuse extinction
while most of the mass is concentrated in small, ultra-opaque clouds which block 10%
of the light (see Sect. 5.6), and tested the effect of this cloud complex
on the final (extinction-corrected) stellar NIR maps of the NB.
Figure 18 shows clearly that the model with the cloud complex located in
front of the NB yields a strong, implausible 2.2![]() m excess, while
the model with the cloud complex on the back side yields a good
agreement of the dereddened 2.2
m excess, while
the model with the cloud complex on the back side yields a good
agreement of the dereddened 2.2![]() m and 4.9
m and 4.9![]() m surface brightness profiles.
There is no reason to believe that the
average effective stellar temperature in the NB is much higher at positive
longitudes than at negative longitudes,
nor does the specific dust luminosity indicate
an excess of hot stars at l > 0.5
m surface brightness profiles.
There is no reason to believe that the
average effective stellar temperature in the NB is much higher at positive
longitudes than at negative longitudes,
nor does the specific dust luminosity indicate
an excess of hot stars at l > 0.5![]() (see Fig. 15d).
Since this test may be affected by the low angular resolution of the COBE data,
we cannot ultimately conclude that the entire "+1
(see Fig. 15d).
Since this test may be affected by the low angular resolution of the COBE data,
we cannot ultimately conclude that the entire "+1![]() cloud complex''
is located behind the NB. Indeed, the new 2MASS and
MSX images
cloud complex''
is located behind the NB. Indeed, the new 2MASS and
MSX images![]() of the NB
indicate the presence of some very opaque dust lanes in front of the NB
at l>0.4
of the NB
indicate the presence of some very opaque dust lanes in front of the NB
at l>0.4![]() .
However, on a large scale, we can exclude that this material
causes strong extinction towards the NB (see Sect. 3.5.2).
.
However, on a large scale, we can exclude that this material
causes strong extinction towards the NB (see Sect. 3.5.2).
From the model described in the previous section, we derive a total
hydrogen mass of the Nuclear Molecular Disk of
![]()
![]()
![]() ,
of which
,
of which
![]()
![]() are located in the inner warm disk at
are located in the inner warm disk at ![]() pc
and
pc
and
![]()
![]() (
(![]() 80%) are distributed in
the outer cold torus.
The corresponding dust luminosities amount to
80%) are distributed in
the outer cold torus.
The corresponding dust luminosities amount to ![]()
![]()
![]() in each of the two components.
Average densities in the inner disk and outer torus are
in each of the two components.
Average densities in the inner disk and outer torus are
![]() cm-3 and
cm-3 and ![]() 150cm-3, respectively.
This high average hydrogen density supports the observation that most of the gas
in the NB is in molecular form.
The mid-plane hydrogen column density through the entire NB is
150cm-3, respectively.
This high average hydrogen density supports the observation that most of the gas
in the NB is in molecular form.
The mid-plane hydrogen column density through the entire NB is
![]()
![]() cm-2.
Assuming homogeneous matter distribution, this corresponds to a
total visual extinction of
cm-2.
Assuming homogeneous matter distribution, this corresponds to a
total visual extinction of ![]() 100mag between the front side of the
NB and the GC, of which
100mag between the front side of the
NB and the GC, of which ![]() 80mag are due to the cold outer dust torus.
This clearly contradicts both the value of
80mag are due to the cold outer dust torus.
This clearly contradicts both the value of ![]() 10-15mag derived from the
NIR colours of the NB (Sects. 4.1 and 4.3.2)
and the total visual extinction of 30mag between the Sun and the GC
(e.g., Whitelock & Glass 1990).
10-15mag derived from the
NIR colours of the NB (Sects. 4.1 and 4.3.2)
and the total visual extinction of 30mag between the Sun and the GC
(e.g., Whitelock & Glass 1990).
This apparent contradiction can be solved when we assume that only ![]() 10%
of ISM (by mass) in the NB is homogeneously distributed, while 90%
of the mass is trapped in small, discrete clouds which cover only a small fraction
of the total area.
A high degree of clumpiness is indeed confirmed by high-resolution submillimetre
continuum maps of the NB at
10%
of ISM (by mass) in the NB is homogeneously distributed, while 90%
of the mass is trapped in small, discrete clouds which cover only a small fraction
of the total area.
A high degree of clumpiness is indeed confirmed by high-resolution submillimetre
continuum maps of the NB at ![]() 800
800![]() m (Lis & Carlstrom 1994) and
m (Lis & Carlstrom 1994) and
![]() 1.2mm (Zylka et al. 2001, in prep.).
These maps show only very little extended emission between and around the
dense clumps/clouds.
We also find that the average column density of the central 120pc of
1.2mm (Zylka et al. 2001, in prep.).
These maps show only very little extended emission between and around the
dense clumps/clouds.
We also find that the average column density of the central 120pc of
![]() cm-2 (not deconvolved; see Sect. 4.3.3)
agrees well with the value of
cm-2 (not deconvolved; see Sect. 4.3.3)
agrees well with the value of ![]()
![]() cm-2
derived from the
cm-2
derived from the ![]() 1.2mm map (when smoothed to the same angular
resolution and assuming
1.2mm map (when smoothed to the same angular
resolution and assuming
![]() K).
It also agrees well with the value
K).
It also agrees well with the value
![]() cm-2 which we
derive from the C18O(1-0) map by Dahmen et al. (1997) using Eq.(7)
of Mauersberger & Bronfman (1998) with
cm-2 which we
derive from the C18O(1-0) map by Dahmen et al. (1997) using Eq.(7)
of Mauersberger & Bronfman (1998) with
![]() and adopting
and adopting
![]() K.
The fact that the chopped submm continuum maps, the total power low-resolution
COBE FIR maps as well as the C18O data see all the
same hydrogen mass in the central 120pc rules out that the high-resolution submm
measurements have resolved out a considerable amount of extended emission.
This confirms the assumption that most of the ISM in the NB is concentrated in very compact
molecular clouds. A first inspection of the 1.2mm map suggests an area filling factor of
dense clouds in the NB of
K.
The fact that the chopped submm continuum maps, the total power low-resolution
COBE FIR maps as well as the C18O data see all the
same hydrogen mass in the central 120pc rules out that the high-resolution submm
measurements have resolved out a considerable amount of extended emission.
This confirms the assumption that most of the ISM in the NB is concentrated in very compact
molecular clouds. A first inspection of the 1.2mm map suggests an area filling factor of
dense clouds in the NB of ![]() 15%
or less. This translates into a volume filling factor of only a few per cent.
The average density of these compact molecular clouds, which contain
15%
or less. This translates into a volume filling factor of only a few per cent.
The average density of these compact molecular clouds, which contain ![]() 90%
of the total hydrogen mass in the NB, becomes then
90%
of the total hydrogen mass in the NB, becomes then
![]() cm-3.
Note that this is a very rough estimate and that the actual densities in the cloud
cores may be much higher.
The average visual extinction of these clouds would be
of order 1000mag and they become optically thin only at
cm-3.
Note that this is a very rough estimate and that the actual densities in the cloud
cores may be much higher.
The average visual extinction of these clouds would be
of order 1000mag and they become optically thin only at
![]()
![]() m.
Thus, our mass estimate, which is based on the assumption that the 240
m.
Thus, our mass estimate, which is based on the assumption that the 240![]() m
emission is optically thin, should still be valid.
We call these clouds "ultra-opaque'' and assume that
m
emission is optically thin, should still be valid.
We call these clouds "ultra-opaque'' and assume that ![]() 10%
of the stellar emission from the NB and the back side of the GB is completely
blocked out by them (see Sect. 3.5.2).
Further characteristics of these clouds are being investigated in PaperIV
(Zylka et al., in prep.).
10%
of the stellar emission from the NB and the back side of the GB is completely
blocked out by them (see Sect. 3.5.2).
Further characteristics of these clouds are being investigated in PaperIV
(Zylka et al., in prep.).
The physical reason for this clumpiness is most probably the tidal stability limit.
We find that in the gravitational potential of the mass distribution shown in
Fig. 14 only clouds with densities higher than a few times
103 - 104cm-3
are stabilized against tidal forces by their own gravitation (cf. Güsten & Downes 1980).
In contrast to Güsten & Downes (1980), who use the mass distribution
derived by Sanders & Lowinger (1972), we find that this limit holds only for the
outer NB (![]() pc) and that the shallow mass distribution in the inner
Nuclear Stellar Disk causes a stability window between
pc) and that the shallow mass distribution in the inner
Nuclear Stellar Disk causes a stability window between
![]() and 110pc. Inside 50pc only superdense clouds are stable against tidal disruption.
and 110pc. Inside 50pc only superdense clouds are stable against tidal disruption.
For the central region of IC342, which resembles in many aspects our own GC
region, but is seen face-on, Schulz et al. (2001) also find that the molecular gas
is extremely clumpy and that the bulk of the gas mass in the inner ![]() 50pc of this
galaxy is concentrated in compact clouds with
50pc of this
galaxy is concentrated in compact clouds with
![]()
![]() and
and
![]() cm-3. Quantitatively, this is a striking similarity to the
conditions in our own GC region.
cm-3. Quantitatively, this is a striking similarity to the
conditions in our own GC region.
The total mass and average density of the homogeneously distributed intercloud medium
in the NB are then
![]()
![]() and
and
![]() cm-3, respectively.
The presence of a diffuse, hot, ionized intercloud medium in the NB is supported by the presence
of extended thermal (free-free) radio emission (see Fig. 9, 6cm map).
Mezger & Pauls (1979) derived for the extended, low-density ionized gas in the NB an average
electron temperature of
cm-3, respectively.
The presence of a diffuse, hot, ionized intercloud medium in the NB is supported by the presence
of extended thermal (free-free) radio emission (see Fig. 9, 6cm map).
Mezger & Pauls (1979) derived for the extended, low-density ionized gas in the NB an average
electron temperature of
![]() K and an electron density of
K and an electron density of
![]() cm-2. The total mass of this component is
cm-2. The total mass of this component is
![]()
![]() .
Both values are in good agreement with our estimate.
The detection of extended X-ray emission in the inner
.
Both values are in good agreement with our estimate.
The detection of extended X-ray emission in the inner ![]() 1
1![]() 8 of the NB
indicates the presence of second diffuse component, i.e. a very hot
Plasma (e.g., Koyama et al. 1996).
8 of the NB
indicates the presence of second diffuse component, i.e. a very hot
Plasma (e.g., Koyama et al. 1996).
| Stellar Components: | Explanation |
| Nuclear Stellar Cluster (NSC): | Central
|
| central part is identical with the star cluster discussed in PaperI (Fig. 6). | |
| Nuclear Stellar Disk (NSD): | Large-scale disk (
|
| Nuclear Bulge (NB): | The sum of NSC and NSD. |
| ISM Components: | |
| Inner warm disk: | Warm dust and molecular gas in the NB which is restricted to R<120pc. |
| Outer cold torus: | Colder dust and molecular gas in the outer NB (still heated by these stars), possibly |
| related to the "180pc Molecular Ring''. The reason for the sharp transition in ISM | |
| characteristics at |
|
| Nuclear Molecular Disk (NMD): | The sum of the inner warm disk and the outer cold torus. Represents all molecular gas |
| which is physically associated with the stellar NB and heated by these stars. | |
| Central Molecular Zone (CMZ): | All molecular gas in the central kpc of the Galaxy. Includes the Nuclear Molecular Disk |
| and cold molecular gas outside the NB in the GB. | |
| Spatial regions: (see Table 9) | |
| Central 1.25pc: | Sphere of R=0.625pc around the GC (Volume |
| Inner NB: | Stars and ISM at R<120pc, defined by the sharp transition of ISM characteristics |
| and a possible drop of the stellar density at |
|
| Outer NB: | Outer part of the NB and NMD (the outer cold ISM torus), mainly defined by the |
| complete lack of warm and hot dust at R> 120pc (the outer cold ISM torus). | |
| Stellar population dominated by the NSD. |
| Component: | Total | Central 1.25pc | Inner NB | Outer NB | Ref./Sect.e |
| Size: | |||||
| R/pc | 0.625 | 120-230 | 5.2, 5.5 | ||
|
|
- | 5.2, 5.5 | |||
| Stars: | |||||
|
|
|
|
|
5.4 | |
|
|
|
|
5.4 | ||
|
|
|
|
|
|
5.3 |
|
|
|
|
|
|
5.3 |
|
|
0.28 | 0.035 | 0.20 | 0.60 | 5.3 |
|
|
|
5.3 | |||
|
|
|
|
|
4.3.2 | |
|
|
|
5.3, 5.4 | |||
|
|
|
|
|
|
5.3, 5.4 |
| ISM: | |||||
|
|
-d |
|
|
5.5 | |
|
|
-d | 5.6 | |||
|
|
|
-d |
|
|
5.5 |
|
|
20-30 | -d | 5.5 | ||
|
|
-d | 5.5 | |||
| ISM/Stars: | |||||
|
|
|
-d |
|
|
|
|
|
|
-d |
|
|
|
|
|
|
-d |
|
|
Using COBE and IRAS NIR to FIR data, we derived the morphology and physical characteristics
of stars and ISM in the central kpc of the Galaxy.
Figure 19 summarizes the projected large-scale distribution
of stars and ISM in the Galactic Centre Region.
We find that the central ![]() pc are dominated by the Nuclear Bulge,
a dense and massive disk-like complex of stars and ISM, which is clearly
distinguished from the much larger Galactic Bulge in which it is embedded.
Similar distinct nuclear star clusters have been found by HST observations
in the centers of many exponential bulges in intermediate and late-type
spiral galaxies (e.g., Carollo et al. 1998).
Here, we derived density and luminosity distributions of the various
stellar and gaseous components populating the Nuclear Bulge
of our own Galaxy. Notations and spatial extents of these components
are described in Table 8 and their physical characteristics are
compiled in Table 9.
pc are dominated by the Nuclear Bulge,
a dense and massive disk-like complex of stars and ISM, which is clearly
distinguished from the much larger Galactic Bulge in which it is embedded.
Similar distinct nuclear star clusters have been found by HST observations
in the centers of many exponential bulges in intermediate and late-type
spiral galaxies (e.g., Carollo et al. 1998).
Here, we derived density and luminosity distributions of the various
stellar and gaseous components populating the Nuclear Bulge
of our own Galaxy. Notations and spatial extents of these components
are described in Table 8 and their physical characteristics are
compiled in Table 9.
The Nuclear Bulge appears, in projection, as a flat bar with an outer
radius of ![]() pc, FWHM scale height
pc, FWHM scale height ![]() pc, and
diameter-to-thickness ratio 5:1.
Its overall morphology appears disk-like and symmetric with respect to the
Galactic Centre.
This disk may be elliptical, in which case it would rather resemble a bar.
The Nuclear Bulge consists of the large Nuclear Stellar Disk with the R-2 Nuclear Stellar Cluster at its centre, and the Nuclear Molecular Disk.
In our analysis, we neglected the small-scale asymmetry seen in the
COBE NIR images (see Fig. 7 and Sect. 5.2).
On small scales, the Nuclear Bulge may well be not as symmetric as
suggested by our results.
This remains, however, subject to further studies which have to combine
NIR, MIR, and submm data with much higher angular resolution than provided
by the COBE data.
pc, and
diameter-to-thickness ratio 5:1.
Its overall morphology appears disk-like and symmetric with respect to the
Galactic Centre.
This disk may be elliptical, in which case it would rather resemble a bar.
The Nuclear Bulge consists of the large Nuclear Stellar Disk with the R-2 Nuclear Stellar Cluster at its centre, and the Nuclear Molecular Disk.
In our analysis, we neglected the small-scale asymmetry seen in the
COBE NIR images (see Fig. 7 and Sect. 5.2).
On small scales, the Nuclear Bulge may well be not as symmetric as
suggested by our results.
This remains, however, subject to further studies which have to combine
NIR, MIR, and submm data with much higher angular resolution than provided
by the COBE data.
The total mass of the Nuclear Bulge amounts to
![]()
![]() ,
of which
,
of which ![]() 99% is contained in stars and
1% in ISM, mainly in the form of dense molecular clouds.
The Nuclear Bulge accounts thus for
99% is contained in stars and
1% in ISM, mainly in the form of dense molecular clouds.
The Nuclear Bulge accounts thus for
![]() 1% of the total stellar mass in the Galactic Disk and Bulge.
In contrast to the usual assumption that the mass distribution in the central
300pc is dominated by an R-2 cluster, we find that the density profile
of the Nuclear Stellar Cluster steepens outside
1% of the total stellar mass in the Galactic Disk and Bulge.
In contrast to the usual assumption that the mass distribution in the central
300pc is dominated by an R-2 cluster, we find that the density profile
of the Nuclear Stellar Cluster steepens outside
![]() -10pc
and that it only dominates the inner
-10pc
and that it only dominates the inner
![]() -30pc.
At larger radii, the mass distribution is dominated by the
Nuclear Stellar Disk which has a rather flat radial density profile
inside
-30pc.
At larger radii, the mass distribution is dominated by the
Nuclear Stellar Disk which has a rather flat radial density profile
inside
![]() pc and a well-defined outer boundary at
pc and a well-defined outer boundary at ![]() 230pc.
The Galactic Bulge begins to dominate the mass distribution
only for
230pc.
The Galactic Bulge begins to dominate the mass distribution
only for
![]() pc.
The photometric mass distribution in the inner 500pc derived from our models
of the Nuclear and Galactic Bulge (with the central Black Hole included)
agrees well with the dynamical mass distribution derived by other authors
and with the total stellar mass in the central 30pc as deduced in PaperII
from the KLF of this region (see Fig. 14).
The total stellar luminosity of the Nuclear Bulge amounts to
pc.
The photometric mass distribution in the inner 500pc derived from our models
of the Nuclear and Galactic Bulge (with the central Black Hole included)
agrees well with the dynamical mass distribution derived by other authors
and with the total stellar mass in the central 30pc as deduced in PaperII
from the KLF of this region (see Fig. 14).
The total stellar luminosity of the Nuclear Bulge amounts to
![]()
![]() ,
of which
,
of which
![]()
![]() (
(![]() 30%) arise from cool low-mass MS and evolved stars.
The contribution by hot and massive stars (
30%) arise from cool low-mass MS and evolved stars.
The contribution by hot and massive stars (![]() 70%) is highly uncertain.
The Nuclear Bulge thus contributes
70%) is highly uncertain.
The Nuclear Bulge thus contributes ![]() 5% to the total luminosity of the
Galactic Disk and Bulge.
5% to the total luminosity of the
Galactic Disk and Bulge.
The stellar population of the Nuclear Bulge appears to resemble that of the Galactic Bulge. Unique for the Nuclear Bulge, however, is a population of young massive stars and an over-abundance of luminous giant and supergiant stars, which are both strongly concentrated towards the centre and are mainly associated with the Nuclear Stellar Cluster. However, the distribution of hot dust, H II regions, and supernova remnants (Fig. 13; see LaRosa et al. 2000) indicates that star formation occurs throughout the entire Nuclear Bulge and not exclusively at its centre. Ongoing star formation is one of the key characteristics which distinguish the Nuclear Bulge from the Galactic Bulge. The star formation history of the Nuclear Bulge, based on the analysis of the KLF of the central 30pc, has been discussed in PaperII.
The total hydrogen mass in the central kpc, referred to as the
Central Molecular Zone, amounts to
![]()
![]() or, if corrected for He and metals, to
or, if corrected for He and metals, to
![]()
![]() .
We find that
.
We find that ![]() 2/3 of this material is located outside the
stellar Nuclear Bulge and not heated by these stars.
About
2/3 of this material is located outside the
stellar Nuclear Bulge and not heated by these stars.
About
![]()
![]() are at positive l (0
are at positive l (0![]() 5-4
5-4![]() )
and
)
and
![]()
![]() at negative l (-2
at negative l (-2![]() --4
--4![]() ), thus causing
the observed asymmetry in the distribution of ISM in the
Central Molecular Zone. The physical reason for this asymmetry is not known.
Only
), thus causing
the observed asymmetry in the distribution of ISM in the
Central Molecular Zone. The physical reason for this asymmetry is not known.
Only ![]()
![]()
![]() are directly associated with the stellar
Nuclear Bulge.
Gas and dust in this Nuclear Molecular Disk, which is approximately
symmetric with respect to the Galactic Centre, are distributed in a thin and warm
inner disk (
are directly associated with the stellar
Nuclear Bulge.
Gas and dust in this Nuclear Molecular Disk, which is approximately
symmetric with respect to the Galactic Centre, are distributed in a thin and warm
inner disk (
![]() K) and a colder, dense outer torus (
K) and a colder, dense outer torus (![]() 20K)
between
20K)
between
![]() and 220pc, which contains
and 220pc, which contains ![]() 80% of the
total gas mass in the Nuclear Bulge.
80% of the
total gas mass in the Nuclear Bulge.
The presence of such a molecular torus in a large-scale bar potential
(due to the barred Galactic Bulge) is predicted
by the same dynamical models as described in Sect. 1.
Due to shocks and angular momentum loss on the inner self-intersecting
X1 orbits in the H I Central Disk, the gas
is driven further inward and being compressed to densities at which molecular
clouds form, and finally settles on stable X2 orbits
(e.g., Binney et al. 1991; Englmaier & Gerhard 1999; Englmaier & Shlosman 2000).
The outer Central Molecular Zone would then represent the region between
the innermost stable X1 orbit and the more circular X2 orbits.
The massive outer torus of the Nuclear Molecular Disk
can be associated with the region where this gas has accumulated on stable
X2 orbits and becomes dense enough to form stars.
One implication of this interpretation is that star formation in the
Nuclear Bulge should occur - apart from the very centre -
mainly in the outer molecular torus. Indeed, the distribution of giant
H II region complexes and supernova remnants across the entire
Nuclear Bulge, with the outermost ones being at
![]() -190pc
(SgrD and E; see LaRosa et al. 2000 and Fig. 13) is consistent with
the presence of a modest star-forming ring with a mean radius of 180pc
around the galactic centre.
The relation between this massive torus and the narrow
180-pc Molecular Ring (Bally et al. 1987)
is not fully understood (see Sect. 1).
-190pc
(SgrD and E; see LaRosa et al. 2000 and Fig. 13) is consistent with
the presence of a modest star-forming ring with a mean radius of 180pc
around the galactic centre.
The relation between this massive torus and the narrow
180-pc Molecular Ring (Bally et al. 1987)
is not fully understood (see Sect. 1).
Extinction arguments lead to the conclusion that
ISM in the Nuclear Molecular Disk is extremely clumpy.
This is confirmed by high-resolution submm continuum maps of the inner
Nuclear Bulge (Lis & Carlstrom 1994; Zylka et al., in prep.).
We find that more than 90%
of the total gas mass in the Nuclear Molecular Disk is concentrated
in very compact,
ultra-opaque molecular clouds with average densities of
![]() cm-3
and a volume filling factor of only a few per cent.
These clouds are completely optically thick for UV, optical, and NIR
radiation, but they become optically thin for the thermal FIR/submm
radiation at wavelengths longer than 100
cm-3
and a volume filling factor of only a few per cent.
These clouds are completely optically thick for UV, optical, and NIR
radiation, but they become optically thin for the thermal FIR/submm
radiation at wavelengths longer than 100![]() m.
The physical reason for this clumpiness is most probably the tidal stability limit,
since only clouds with densities higher than a few times
103 - 104cm-3
are stabilized against tidal forces by their own gravitation in the gravitational
potential of the mass distribution in the Nuclear Bulge.
The remaining <10% of interstellar mass in the Nuclear Bulge
are contained in a diffuse, thin and warm intercloud medium.
m.
The physical reason for this clumpiness is most probably the tidal stability limit,
since only clouds with densities higher than a few times
103 - 104cm-3
are stabilized against tidal forces by their own gravitation in the gravitational
potential of the mass distribution in the Nuclear Bulge.
The remaining <10% of interstellar mass in the Nuclear Bulge
are contained in a diffuse, thin and warm intercloud medium.
The dominant heating source of the thin intercloud medium in the Nuclear Bulge
is the strong UV radiation field due to young massive stars in the
Nuclear Stellar Cluster and other regions of high-mass star-formation
in the outer Nuclear Bulge, as well as a widely distributed population
of intermediate-mass MS stars.
Due to the extreme clumpiness of the ISM,
at least the soft UV radiation can
penetrate the entire Nuclear Bulge, ionize the thin intercloud gas,
and heat the dust in this component to high temperatures.
This soft UV radiation together with the strong stellar NIR radiation field also
dominates the heating of the dense molecular gas
(e.g., Poglitsch et al. 1991; Hüttemeister et al. 1998; Schulz et al. 2001).
The relative lack of hot dust (200-400K) and the abrupt decrease of
specific dust luminosity beyond
![]() -120pc supports our
finding that most of the gas and dust in the Nuclear Molecular Disk
is contained in very compact and massive molecular clouds distributed mainly
in a torus between
-120pc supports our
finding that most of the gas and dust in the Nuclear Molecular Disk
is contained in very compact and massive molecular clouds distributed mainly
in a torus between
![]() and 220pc. Most of their mass then
is effectively shielded from the strong interstellar radiation field in the
Nuclear Bulge.
Gas in the inner Nuclear Molecular Disk must also be clumpy so that
the radiation field can penetrate and maintain the high mass-averaged dust
temperature of >30K. However, the absence of a stringent tidal stability
limit between
and 220pc. Most of their mass then
is effectively shielded from the strong interstellar radiation field in the
Nuclear Bulge.
Gas in the inner Nuclear Molecular Disk must also be clumpy so that
the radiation field can penetrate and maintain the high mass-averaged dust
temperature of >30K. However, the absence of a stringent tidal stability
limit between
![]() and 110pc allows smaller clouds to exist
in this region, which have a larger surface-to-mass ratio and can be more
effectively heated, thus explaining the large excess of hot dust compared to
the outer torus.
and 110pc allows smaller clouds to exist
in this region, which have a larger surface-to-mass ratio and can be more
effectively heated, thus explaining the large excess of hot dust compared to
the outer torus.
With its flat disk and ring-like morphology, high stellar density, high degree of clumpiness of ISM, and ongoing star formation, the Nuclear Bulge may be tentatively considered as counterpart of the central complex in IC342 (e.g., Wright et al. 1993; Böker et al. 1997; Mauersberger & Bronfman 1999; Schulz et al. 2001) or even of the massive gaseous tori seen in starburst galaxies (e.g., Downes & Solomon 1998).
Since we used a distance of 8.5kpc to the Galactic Centre,
all sizes have to be scaled by (8/8.5)![]() ,
and masses and
luminosities by (8/8.5)
,
and masses and
luminosities by (8/8.5)
![]() ,
when the numbers are
being compared to other studies which use
a distance of 8kpc. These corrections are, however, smaller than
the uncertainties of our results.
,
when the numbers are
being compared to other studies which use
a distance of 8kpc. These corrections are, however, smaller than
the uncertainties of our results.
Acknowledgements
We wish to thank W. Reich for assisting with radio continuum data retrieval from the MPIfR archive. L. Bronfman kindly provided the 12CO(1-0) map of the inner Milky Way and D. Lis provided the 800
m continuum map of the inner NB. We wish to thank A. Schulz, S. Jogee, E. Schinnerer, S. Stolovy, and N. Scoville for helpful comments and stimulating discussions. Our special thanks go to W. Duschl who elucidated the results given here in terms of Active Galactic Nuclei and to the referee, Ian Glass, for useful suggestions. RL acknowledges financial support by a research grant of the Max Planck Society and by NSF grant AST 99-81546. RZ acknowledges finacial support by the Deutsche Forschungsgemeinschaft. The COBE datasets were developed by the NASA Goddard Space Flight Center under the guidance of the COBE Science Working Group and were provided by the National Space Science Data Center. SkyView was developed and is maintained under NASA ADP Grant NAS 5-32068 with P. I. Thomas A. McGlynn under the auspices of the High Energy Astrophysics Science Archive Research Center (HEASARC) at the Goddard Space Flight Center Laboratory for High Energy Astrophysics.
A "standard'' extinction curve was adopted for
the entire GD and the NB since extinction along the line of
sight toward the GC is believed to be dominated by dust
in the diffuse ISM which accounts for the intercloud gas as well as
for low- and intermediate-density molecular clouds (Tielens et al. 1996).
The dust opacity spectrum used here is based on data from
Rieke & Lebofsky (1985) for
![]()
![]() m and
Draine & Lee (1984)
m and
Draine & Lee (1984)
|
|
|
|
|
||
| [ |
[cm2g-1] | [ |
[cm2g-1] | [ |
[cm2g-1] |
| 0.55 | 32100 | 4.9 | 926 | 140 | 20 |
| 1.25 | 9030 | 12 | 1190 | 240 | 7.3 |
| 1.65 | 5300 | 25 | 415 | 800 | 0.71 |
| 2.2 | 3590 | 60 | 77 | 1300 | 0.31 |
| 3.5 | 1800 | 100 | 34 | 3000 | 0.072 |
To treat the emission and extinction by dust in the GD in an appropriate way and to correctly derive NIR surface brightness maps of the NB, a three-dimensional model of the distribution of ISM in the GD was developed. The primary goal of this model was to derive extinction maps towards the GB and NB and to separate the MIR to FIR emission from the GD into contributions from the front and back sides with respect to the GC region. Proper modeling of the NIR surface brightness distribution of the GB, which is impossible without applying correct extinction corrections, is particularly important since due to its exponential profile the separation of GB and NB is very sensitive to how the surface brightness of the GB is interpolated into the region occupied by the NB.
Here, the GD was modeled by an axisymmetric disk with a central hole and
an overlayed spiral arm pattern.
Three gas components mixed with dust were considered:
i) atomic hydrogen (H I), ii) molecular Hydrogen (H2), and iii) H II.
The dust model is described in Appendix A.
Radial density profiles at b = 0![]() were adopted from
Liszt (1992) for HI and from
Bronfman (1992) for H2, and were adjusted to fit the FIR data.
A sech2 vertical density profile was adopted for the H2 disk
and a double-Gaussian profile for the HI disk.
The scale heights of the HI and H2 disks as function of galactocentric
radius - including the exponential flare and the warp of the outer disk -
were adapted to various measurements summarized by Wouterloot et al. (1990).
The dust temperatures were, to first order, adopted from Sodroski et al. (1994) and
then varied to fit the COBE FIR data with the above model.
The metal abundance gradient was taken from Afflerbach et al. (1997).
For the GC region we use a relative metallicity of
were adopted from
Liszt (1992) for HI and from
Bronfman (1992) for H2, and were adjusted to fit the FIR data.
A sech2 vertical density profile was adopted for the H2 disk
and a double-Gaussian profile for the HI disk.
The scale heights of the HI and H2 disks as function of galactocentric
radius - including the exponential flare and the warp of the outer disk -
were adapted to various measurements summarized by Wouterloot et al. (1990).
The dust temperatures were, to first order, adopted from Sodroski et al. (1994) and
then varied to fit the COBE FIR data with the above model.
The metal abundance gradient was taken from Afflerbach et al. (1997).
For the GC region we use a relative metallicity of
![]() as derived by Mezger et al. (1979).
A four-arm, modified logarithmic spiral density pattern was overlayed on the axisymmetric disk.
The general spiral geometry was adopted from Georgelin & Georgelin (1976)
and Englmaier & Gerhard (1999), and adjusted to fit the
COBE FIR data. It resembles the pattern derived by
Drimmel & Spergel (2001), but is not identical.
The details of this spiral arm model may not necessarily reflect the true
spiral pattern of the Galaxy. However, it fits the COBE FIR data sufficiently well
for our purpose and provides a reasonable estimate of how the extinction towards the
GB rises with increasing galactocentric radius towards the GD molecular ring.
The spiral arms have a Gaussian density cross section. The density contrast between spiral
arms and inter-arm regions and its radial gradient were adopted from
Heyer & Terebey (1998).
The local Orion arm was not included in our model.
The main parameters of the GD model are summarized in Fig. B.1.
as derived by Mezger et al. (1979).
A four-arm, modified logarithmic spiral density pattern was overlayed on the axisymmetric disk.
The general spiral geometry was adopted from Georgelin & Georgelin (1976)
and Englmaier & Gerhard (1999), and adjusted to fit the
COBE FIR data. It resembles the pattern derived by
Drimmel & Spergel (2001), but is not identical.
The details of this spiral arm model may not necessarily reflect the true
spiral pattern of the Galaxy. However, it fits the COBE FIR data sufficiently well
for our purpose and provides a reasonable estimate of how the extinction towards the
GB rises with increasing galactocentric radius towards the GD molecular ring.
The spiral arms have a Gaussian density cross section. The density contrast between spiral
arms and inter-arm regions and its radial gradient were adopted from
Heyer & Terebey (1998).
The local Orion arm was not included in our model.
The main parameters of the GD model are summarized in Fig. B.1.
With these parameters, the GD was modeled out to R = 20kpc with a grid cell
size of (100pc)3.
Figure B.2 compares the observed 240![]() m emission profiles
with the profiles predicted by the model (see Fig. 4 for the latitude
extinction profile).
The GD model contains
m emission profiles
with the profiles predicted by the model (see Fig. 4 for the latitude
extinction profile).
The GD model contains
![]()
![]() molecular hydrogen
and
molecular hydrogen
and
![]()
![]() atomic hydrogen of which
atomic hydrogen of which
![]()
![]()
![]() are located at R < 15kpc. These values are in good
agreement with other estimates.
are located at R < 15kpc. These values are in good
agreement with other estimates.
This model allows to derive the thermal emission and extinction due to dust along any line of sight in the inner Galaxy. Although our model is not intended to represent the exact morphology of the entire GD and does not include the stellar disk, its strength is that it is based on a complete set of parameters derived from observations without artificial assumptions and that it reproduces the observed FIR emission and colour temperatures and extinction in the inner Galaxy. A much more sophisticated three-dimensional model of the GD, which is also based on COBE/DIRBE data, has recently been developed by Drimmel & Spergel (2001).
![\begin{figure}
\par\includegraphics[width=8.8cm,clip]{ms3107_fig2.ps}
\end{figure}](/articles/aa/full/2002/10/aah3107/img50.gif)
![\begin{figure}
\par\includegraphics[width=8.8cm,clip]{ms3107_fig3.ps}
\end{figure}](/articles/aa/full/2002/10/aah3107/img60.gif)
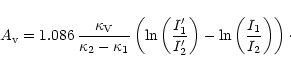
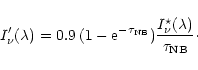

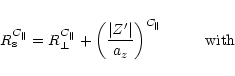
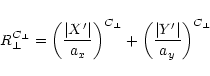
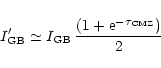
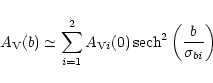
![\begin{figure}
\par\includegraphics[width=8.8cm,clip]{ms3107_fig5.ps}
\end{figure}](/articles/aa/full/2002/10/aah3107/img96.gif)
![\begin{figure}
\par\includegraphics[width=8.8cm,clip]{ms3107_fig6.ps}
\end{figure}](/articles/aa/full/2002/10/aah3107/img97.gif)
![\begin{figure}
\par\includegraphics[width=8.8cm,clip]{ms3107_fig7.ps}
\end{figure}](/articles/aa/full/2002/10/aah3107/img122.gif)
![\begin{figure}
\par\includegraphics[width=8.8cm,clip]{ms3107_fig12.ps}
\end{figure}](/articles/aa/full/2002/10/aah3107/img166.gif)
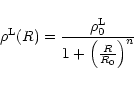
![\begin{figure}
\par\includegraphics[width=8.8cm,clip]{ms3107_fig19.ps}
\end{figure}](/articles/aa/full/2002/10/aah3107/img300.gif)
![\begin{figure}\par\par\includegraphics[width=8.8cm,clip]{ms3107_figb1.ps}\end{figure}](/articles/aa/full/2002/10/aah3107/img384.gif)
![\begin{figure}\par\includegraphics[width=8.8cm,clip]{ms3107_figb2.ps}\end{figure}](/articles/aa/full/2002/10/aah3107/img385.gif)