Table 4 contains the best-estimated values of X for a sample of 14 well-studied
nearby galaxies.
Table 4 shows that X spans the range
![]() mol cm-2 (K km s-1)-1for galaxies of different morphological type.
mol cm-2 (K km s-1)-1for galaxies of different morphological type.
The ratio between 12CO(1-0) line emission and the molecular hydrogen column density strongly depends on several physical properties of the ISM such as the UV radiation field, the metallicity and the cosmic ray density (Lequeux et al. 1994; Kaufman et al. 1999), which are known to vary from galaxy to galaxy.
We empirically quantify these dependences by plotting in Fig. 2.
(left panels) the relationship between X, the
H![]() NII]EW and the metallicity (
NII]EW and the metallicity (![]() O/H)) for the 14
nearby galaxies.
O/H)) for the 14
nearby galaxies.
![\begin{figure}
\par\includegraphics[width=17.5cm,clip]{MS1894f2.ps}\end{figure}](/articles/aa/full/2002/10/aa1894/img67.gif) |
Figure 2:
The relationship for the template sample of nearby galaxies
between the X conversion factor from CO line intensity to H2 column density and a) the H |
The relationship with the H![]() NII]EW (taken as a SFR tracer),
if any, is ill-defined and that with metallicity is quite clear.
In galaxies with a low metallicity
and a strong UV radiation field (high H
NII]EW (taken as a SFR tracer),
if any, is ill-defined and that with metallicity is quite clear.
In galaxies with a low metallicity
and a strong UV radiation field (high H![]() NII]EW) (both go together in general)
the X conversion factor is
a factor of
NII]EW) (both go together in general)
the X conversion factor is
a factor of ![]() 20 higher than in quiescent, high metallicity galaxies such as
the Milky Way. These two relationships can be used in principle to determine
a more accurate value of the X conversion factor once the metallicity and/or
the H
20 higher than in quiescent, high metallicity galaxies such as
the Milky Way. These two relationships can be used in principle to determine
a more accurate value of the X conversion factor once the metallicity and/or
the H![]() NII]EW is known. Metallicity measurements
are available for only a minority of galaxies, while H
NII]EW is known. Metallicity measurements
are available for only a minority of galaxies, while H![]() NII]EW
exist for a few hundred.
However there is a well-known anticorrelation (correlation) between
H
NII]EW
exist for a few hundred.
However there is a well-known anticorrelation (correlation) between
H![]() NII]EW (metallicity) and luminosity (Gavazzi et al. 1998; Zaritsky et al. 1994)
in normal galaxies. It is reflected here by a strong relation between
X and the H luminosity (Fig. 2c) or the B absolute magnitude (Fig. 2d).
The best fits to the data are given in Table 5.
The slope of the fits are consistent with those found by Arimoto et al. (1996), but significantely
steeper than that found by Wilson (1995) for the X vs.
NII]EW (metallicity) and luminosity (Gavazzi et al. 1998; Zaritsky et al. 1994)
in normal galaxies. It is reflected here by a strong relation between
X and the H luminosity (Fig. 2c) or the B absolute magnitude (Fig. 2d).
The best fits to the data are given in Table 5.
The slope of the fits are consistent with those found by Arimoto et al. (1996), but significantely
steeper than that found by Wilson (1995) for the X vs.
![]() O/H) relation
(see Table 5). This difference in slope with Wilson is probably due to the fact that our
sample includes many metal rich spiral galaxies with low values of X
(
O/H) relation
(see Table 5). This difference in slope with Wilson is probably due to the fact that our
sample includes many metal rich spiral galaxies with low values of X
(
![]() mol cm-2 (K km s-1)-1)
not present in the Wilson's sample.
Our intercept for the X vs.
mol cm-2 (K km s-1)-1)
not present in the Wilson's sample.
Our intercept for the X vs.
![]() O/H) relation is consistent
with that of Arimoto et al. (1996).
Our intercept in the X vs. MB relation is lower since
Arimoto et al. (1996) includes all the objects rejected here whose Xvalue is probably overestimated due to the low spatial resolution of the
CO observations (>100 pc).
O/H) relation is consistent
with that of Arimoto et al. (1996).
Our intercept in the X vs. MB relation is lower since
Arimoto et al. (1996) includes all the objects rejected here whose Xvalue is probably overestimated due to the low spatial resolution of the
CO observations (>100 pc).
The relationships given in Table 5
between X and LH and/or MB are de facto empirical calibrations
for a luminosity-dependent X conversion factor.
Given the large uncertainty in the determination of X in the nearby
sample of galaxies, it is difficult to quantify the resulting accuracy in
the molecular gas mass estimated using the relationships given in Table 5.
We should also remind that even inside a given object X might change by
a factor of ![]() 10 from the diffuse medium to the core of GMCs (Polk et al. 1988);
it is thus difficult to estimate a single value of X representing the entire galaxy.
We can however conclude that the adoption of the relations given in Table 5
should remove the first-order systematic effect with luminosity
in the estimate of the molecular hydrogen content of galaxies using CO data.
The use of a standard X conversion factor as those generally used in the literature
(X=2.3-
10 from the diffuse medium to the core of GMCs (Polk et al. 1988);
it is thus difficult to estimate a single value of X representing the entire galaxy.
We can however conclude that the adoption of the relations given in Table 5
should remove the first-order systematic effect with luminosity
in the estimate of the molecular hydrogen content of galaxies using CO data.
The use of a standard X conversion factor as those generally used in the literature
(X=2.3-
![]() mol cm-2 (K km s-1)-1)
overestimates the molecular gas mass by a factor of
mol cm-2 (K km s-1)-1)
overestimates the molecular gas mass by a factor of ![]() 2-3
in massive galaxies of
2-3
in massive galaxies of
![]() ,
or
,
or
![]() mag,
while underestimates M(H2) in low mass objects of
mag,
while underestimates M(H2) in low mass objects of
![]() ,
or
,
or
![]() mag as those observed in this work by a factor of
mag as those observed in this work by a factor of ![]() 2.
The relationship between X and
2.
The relationship between X and
![]() O/H) might
be used to estimate the radial distribution of molecular hydrogen in
galaxies mapped in CO with available measurements of the metallicity gradient.
O/H) might
be used to estimate the radial distribution of molecular hydrogen in
galaxies mapped in CO with available measurements of the metallicity gradient.
An alternative technique for determining the molecular gas content can be pursued by assuming a metallicity-dependent dust to gas ratio and determining the dust mass using far-IR or submillimetric continuum data. The dust to gas ratio is then determined in regions with no CO emission, hence supposed to be strongly dominated by HI. In regions with CO emission, the excess dust emission with respect to this ratio indicates the mass of H2. This technique has been succesfully applied to M 51, NGC 891, NGC 4565 and to some nearby irregular galaxies such as the Magellanic Clouds (Guélin et al. 1995; Guélin et al. 1993; Neininger et al. 1996; Israel 1997).
In normal galaxies such as those in our sample the dust mass is dominated
by the cold dust emitting in the far-IR with a peak at ![]() 200
200 ![]() m.
The determination of the total dust mass can be achieved provided that the
100-1000
m.
The determination of the total dust mass can be achieved provided that the
100-1000 ![]() m far-IR flux and the cold dust
temperature are known. Recent observations aimed at determining the
spectral energy distribution in the far-IR of normal, quiescent
galaxies indicate that their SED can be fitted
by a modified Planck law
m far-IR flux and the cold dust
temperature are known. Recent observations aimed at determining the
spectral energy distribution in the far-IR of normal, quiescent
galaxies indicate that their SED can be fitted
by a modified Planck law ![]()
![]()
![]() ,
with
,
with ![]() (Alton et al. 2000).
The total dust mass can be thus determined from the relation (Devereux & Young 1990):
(Alton et al. 2000).
The total dust mass can be thus determined from the relation (Devereux & Young 1990):
 |
(4) |
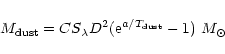
The determination of the dust to gas ratio in a way consistent with that
obtained in the solar neighbourhood, requires the estimate of the gas and dust surface densities,
thus of the spatial distribution of dust and gas over the discs.
Unfortunately only integrated HI and dust masses are available for our spatially
unresolved galaxies. It is however reasonable to assume that the cold dust
is as extended as the optical disc (Alton et al. 1998).
The HI gas surface density is available only for a few galaxies in our sample
from VLA observations (Cayatte et al. 1994). For these objects we
observe a good relationship between the HI surface density ![]() HI and
the HI-deficiency parameter (
HI and
the HI-deficiency parameter (
![]() ), (defined as in Sect. 5.1) (Fig. 3):
), (defined as in Sect. 5.1) (Fig. 3):
 |
(5) |
![\begin{figure}
\par\includegraphics[width=8.3cm,clip]{MS1894f3.ps}\end{figure}](/articles/aa/full/2002/10/aa1894/img88.gif) |
Figure 3: The relationship between the HI surface density and the HI-deficiency parameter for the galaxies in common with Cayatte et al. (1994). The dashed line gives the best fit to the data. |
The gas to dust ratio should depend on metallicity since
the dust content is expected to be proportional to the metal content.
A gas to dust vs. metallicity relation can be calibrated using the
data available for the MW (Sodroski et al. 1994), the LMC (4 times
solar; Koornneef 1982) and the SMC (10 times solar; Bouchet et al. 1985).
This gives the relation:
| = | |||
| (6) |
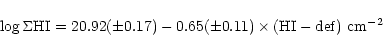
where the gas to dust ratio is given relative to the solar neighborhood,
estimated by Sodroski et al. (1994) at (gas/dust)
![]() .
The metallicity can be predicted using the metallicity vs. H band luminosity relation shown in Fig. 4:
.
The metallicity can be predicted using the metallicity vs. H band luminosity relation shown in Fig. 4:
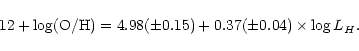 |
(7) |
Using Eqs. (6) and (7) we can predict the gas to dust ratio for a galaxy
of any H luminosity.
The molecular gas mass comes directly if we assume that the H2 is
homogeneously distributed over the optical disc and
X is given by X=M(H
![]() /I(CO). The assumption of a homogeneous,
flat distribution for the molecular hydrogen component over the disc of galaxies,
which is in contradiction with the observational evidence that the CO emission
is generally centrally peaked (see Sect. 4.1), might introduce a systematic error in the
determination of X. We remark however that the expected H2 distribution is
flatter than that of the CO emitting gas because of the observed decrease of the metallicity
in the outer parts of galaxy discs.
/I(CO). The assumption of a homogeneous,
flat distribution for the molecular hydrogen component over the disc of galaxies,
which is in contradiction with the observational evidence that the CO emission
is generally centrally peaked (see Sect. 4.1), might introduce a systematic error in the
determination of X. We remark however that the expected H2 distribution is
flatter than that of the CO emitting gas because of the observed decrease of the metallicity
in the outer parts of galaxy discs.
![\begin{figure}
\par\includegraphics[width=17.6cm,clip]{MS1894f5.ps}\end{figure}](/articles/aa/full/2002/10/aa1894/img96.gif) |
Figure 5:
Same as Fig. 2 but including values of X determined using
the alternative method described in Sect. 6.2 for the
unperturbed sample (small symbols).
Small open dots are for galaxies detected at 100 |
The values of X obtained for the sample galaxies are compared with those of the template galaxies in Fig. 5 (small symbols). In spite of the larger scatter, it is encouraging to see that the new values of X, at any given luminosity, metallicity and UV radiation field, are in rough agreement with those obtained for the template. The large uncertainty and systematic effects are not unexpected given the number of assumptions underlying the method. From Fig. 5 we conclude that the luminosity-dependent X conversion factor given in Table 5 is appropriate for estimating the molecular gas content of late-type galaxies from 12CO(1-0) line intensity measurements. From now on, the molecular gas content of the 266 sample galaxies, M(H2), is estimated using the H band luminosity-dependent X value given in Table 5.
Copyright ESO 2002
![\begin{figure}
\par\includegraphics[width=8.1cm,clip]{MS1894f4.ps}\end{figure}](/articles/aa/full/2002/10/aa1894/img94.gif)