A&A 383, 905-915 (2002)
DOI: 10.1051/0004-6361:20011809
A. Puss 1,2 - L. Leedjärv 1
1 - Tartu Observatory, EE 61602 Tõravere, Estonia
2 - Tartu University, Department of Physics, EE 50090, 4 Tähe Street,
Tartu, Estonia
Received 5 October 2001 / Accepted 17 December 2001
Abstract
The interacting binary system
AX Mon (K-giant + B(e) star) has been observed at the Tartu
Observatory, Estonia, from 1985 to 2000. In the present paper, mostly the
behaviour of the hydrogen H![]() line from 1996 to 2000 is investigated.
We have found that the H
line from 1996 to 2000 is investigated.
We have found that the H![]() profiles are variable on time scales from
hours to years, with main features appearing around the conjunctions of the
stars (K-star in front).
Those features include weakening of the
main absorption component of the P Cygni like profile and appearance of
additional absorption and/or emission components.
Occasionally, the H
profiles are variable on time scales from
hours to years, with main features appearing around the conjunctions of the
stars (K-star in front).
Those features include weakening of the
main absorption component of the P Cygni like profile and appearance of
additional absorption and/or emission components.
Occasionally, the H![]() line as a whole shifts on the wavelength scale.
All those effects seem to occur much stronger at every second conjunction,
which we propose to call "strong'' conjunctions.
We propose that this variability is due to a gas cloud close to the Be star.
This cloud is a region, where a stream of matter from the K-giant
collides with the circumstellar gas from the Be-star.
The mass transfer
process seems to have become more unstable than in 1960s.
It is possible that a cyclic behaviour of the H
line as a whole shifts on the wavelength scale.
All those effects seem to occur much stronger at every second conjunction,
which we propose to call "strong'' conjunctions.
We propose that this variability is due to a gas cloud close to the Be star.
This cloud is a region, where a stream of matter from the K-giant
collides with the circumstellar gas from the Be-star.
The mass transfer
process seems to have become more unstable than in 1960s.
It is possible that a cyclic behaviour of the H![]() line with a
periodicity of about two orbital periods is present.
line with a
periodicity of about two orbital periods is present.
Key words: stars: binaries: spectroscopic - stars: emission-line, Be -stars: individual: AX Mon
AX Mon (HD 45910, SAO 113947, GC 8442, MWC 145) is known as an
interacting
binary system, with orbital period of 232.5
days, consisting of a K-type giant and a B-type hot star.
For the components, spectral types in the ranges K0-M2 III and B0.5-B6
II-V, respectively, have been proposed by various authors.
From extensive observations of optical spectra Cowley (1964)
deduced spectral type K0 III + B3 V,
while the observations of ultraviolet spectra have yielded K0 III + B2 III
(Sahade et al. 1984). It is evident, that the AX Mon
system contains
large amounts of circumstellar matter.
It is possible that the AX Mon
system is just at the end of the dynamically
unstable
phase of mass exchange (Harmanec 1974).
During this phase the mass-losing star became the
less massive component.
Such a configuration generates spectra and light curves of complicated
character, which makes it more difficult to find exact parameters of the
components
of the system. In the process of investigating spectral lines it has become
evident,
that around the time of conjunction of the stars (K-star in front) there
appear
narrow absorption lines of ionized metals (mostly Fe II) and hydrogen
Balmer lines (H![]() ,
H
,
H![]() ). This phenomenon is explained by a gaseous stream
from the K-star to the B-star, projected in front of the
B-star (Cowley 1964).
Photometric
measurements show that a nearly 0.5 mag dip exists in the
U light curve close
to phase 0.75. This is interpreted as attenuation of the hot-star light by a
dense circumstellar gas cloud (Elias et al. 1997).
). This phenomenon is explained by a gaseous stream
from the K-star to the B-star, projected in front of the
B-star (Cowley 1964).
Photometric
measurements show that a nearly 0.5 mag dip exists in the
U light curve close
to phase 0.75. This is interpreted as attenuation of the hot-star light by a
dense circumstellar gas cloud (Elias et al. 1997).
In the present paper we analyze spectroscopic observations of AX Mon, performed at Tartu Observatory, Estonia.
Section 2 gives an overview of observational data and results from the literature and describes our observations.
In Sect. 3 we discuss the analysis and possible explanations of the observational data. Section 4 gives the disscussion and Sect. 5 the conclusions.
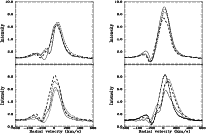 |
Figure 1:
H |
| Open with DEXTER | |
AX Mon system was for the first time mentioned when Fleming
(1898) noted that it had bright hydrogen lines in the spectrum.
In 1921 Humason and Merrill
included AX Mon in a list of B stars with bright H![]() .
Merrill
(1923) and Plaskett (1923, 1927)
independently observed AX Mon.
They found that the spectrum is variable. Most pronounced phenomenon in the
photographic region was occasional appearance of a shell spectrum of
ionized metals and variable hydrogen lines with one or more components.
Guthnick & Prager (1930)
found irregular light variations fluctuating
between 6.7 and 6.9 magnitudes.
Plaskett (1927) detected a periodicity of about 235 days in the
displacements of the hydrogen lines (both in emission and in
absorption). Struve
(1943) concluded from the spectra, that if any periodicity exists,
it probably lasts only for a short
time. Merrill found in 1945 from high-dispersion spectra weak absorption lines
characteristic of a late-type star. From these lines Merrill (1952)
found an orbital period of 232 days.
.
Merrill
(1923) and Plaskett (1923, 1927)
independently observed AX Mon.
They found that the spectrum is variable. Most pronounced phenomenon in the
photographic region was occasional appearance of a shell spectrum of
ionized metals and variable hydrogen lines with one or more components.
Guthnick & Prager (1930)
found irregular light variations fluctuating
between 6.7 and 6.9 magnitudes.
Plaskett (1927) detected a periodicity of about 235 days in the
displacements of the hydrogen lines (both in emission and in
absorption). Struve
(1943) concluded from the spectra, that if any periodicity exists,
it probably lasts only for a short
time. Merrill found in 1945 from high-dispersion spectra weak absorption lines
characteristic of a late-type star. From these lines Merrill (1952)
found an orbital period of 232 days.
Extensive spectroscopic investigations of AX Mon were performed by Cowley (1964). A summary of her results is as follows:
(1) Hydrogen lines exhibit P Cygni-like profiles corresponding to expansion
velocities of approximately 200 kms-1. They can undergo rapid
variations. Usually H![]() and H
and H![]() lines were investigated.
They have frequently multiple components which are usually seriously
blended, and which
are variable in various ways, especially the high-velocity
components.
lines were investigated.
They have frequently multiple components which are usually seriously
blended, and which
are variable in various ways, especially the high-velocity
components.
(2) Around the conjunction of the stars, or little before that (mostly between phases 0.7 and 1.1) a metal rich shell spectrum appears with sharp absorption lines of FeII, TiII, CrII, MnII, NiII. Its duration is variable. Lines have maximal intensities approximately at phase 0.92. (Phase 1.0 corresponds to superior conjunction of the B-star.) This phenomenon is interpreted by a mass transfer stream from the K-giant to the B-star, moving at about +25 kms-1.
(3) Broad He I absorption lines form in the vicinity of the B-star. The width of the lines makes it difficult to determine the B star orbital velocity. Cowley connected broad lines to rapid rotation of the B star.
(4) The semi-amplitudes of the radial velocities of the B star were
estimated
from the H![]() and H
and H![]() emission lines
(with some difficulty).
The most accurate estimate is for the K-star from neutral metallic
absorption lines. From the H
emission lines
(with some difficulty).
The most accurate estimate is for the K-star from neutral metallic
absorption lines. From the H![]() emission line
a mass ratio of
emission line
a mass ratio of
![]() has been determined.
The inclination of the orbit is estimated to amount to about 65
has been determined.
The inclination of the orbit is estimated to amount to about 65![]() (there are different estimates ranging from 50
(there are different estimates ranging from 50![]() to 80
to 80![]() ).
With these
assumptions the masses
).
With these
assumptions the masses
![]() and
and
![]() were derived
as well as the semi-major axis
of the orbit:
were derived
as well as the semi-major axis
of the orbit: ![]() sin
sin
![]() AU.
AU.
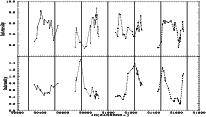 |
Figure 2:
Intensities of the H |
| Open with DEXTER | |
Harmanec (1974) proposed that AX Mon is just at the end of the dynamically unstable phase of mass exchange. Therefore, the initially more massive mass-losing star has become the less massive component. In the same work he proposed that the orbital period of the system should rapidly increase. Mastenova (1989) analysing neutral metallic lines of the K-star concluded that the orbital period of the system was still 232.5 days. Consequently, an increase of the orbital period was not confirmed.
The paper by Peton (1974) treats UBV photometry and spectroscopic
observations in the photographic region during 11 years. Peton states,
that there exists two
absorbing envelopes: an exterior shell of hydrogen and an interior metal
rich
shell. Photometric variations on three different timescales were found:
very short variations (![]() 4 hr); short variations (>1 day); long-time
variations (
4 hr); short variations (>1 day); long-time
variations (![]() 3 yr). Peton estimated an orbital inclination
3 yr). Peton estimated an orbital inclination
![]() .
In spite of the small orbital eccentricity, tidal effects
might be present.
Peton preferred to use an orbital phasing from the periastron passage
(If
.
In spite of the small orbital eccentricity, tidal effects
might be present.
Peton preferred to use an orbital phasing from the periastron passage
(If
![]() ,
then
,
then
![]() ).
).
Sahade et al. (1984) and Sahade & Brandi (1985)
obtained IUE (184-323 nm and
116-213 nm) spectra at the phase
![]() .
They determined
the B-star
temperature to be about 20000 K and estimated a spectral class
B2III. Also, based on the MgII absorption at 280 nm, they
confirm the presence of a large amount of circumstellar matter.
.
They determined
the B-star
temperature to be about 20000 K and estimated a spectral class
B2III. Also, based on the MgII absorption at 280 nm, they
confirm the presence of a large amount of circumstellar matter.
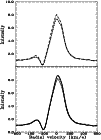 |
Figure 3:
Upper panel: example of the variability of the H |
| Open with DEXTER | |
Danezis et al. (1991) performed similar analyses of IUE spectra.
AX Mon has been observed with the Einstein X-ray satellite in the 0.1-1.4 KeV range (Guinan et al. 1984), but AX Mon was not proven to be an X-ray source. This may be due to the lack of hot plasma, or due to large amount of interstellar absorption.
Dougherty et al. (1994) have revealed an excess infrared radiation from a near-IR survey. This excess is caused by the presence of the cool giant in the AX Mon system.
Extensive multiwavelength observations and modelling of AX Mon have been performed by Elias et al. (1997). The main results are as follows:
1) Contrary to Cowley's (1964) interpretation, the broad He I lines are not connected to the B-star's rapid rotation. They rather originate from circumstellar gas clouds.
2) Specified parameters of the K-star:
![]() sin
sin
![]() ;
;
![]() K;
K;
![]() ;
;
![]() ;
;
![]() .
3) The same for the B-star:
.
3) The same for the B-star:
![]() ;
;
![]() ;
;
![]() ;
;
![]()
4) The parameters of the system:
semi-major axis
![]() AU;
inclination
AU;
inclination
![]() ;
distance from Earth
;
distance from Earth
![]() ;
mass ratio q = 0.331;
;
mass ratio q = 0.331;
![]() ;
MV = -5.0;
V = 6.8.
;
MV = -5.0;
V = 6.8.
5) A large gas cloud exists near the B-star, with dimensions similar to the B-star radius. The cloud generates a 0.5 mag dip in the U magnitude near phase 0.75 (computed from conjunction). The cloud may arise, when the stream from the K-star swings around the B-star, falls back and intersects its earlier trajectory. An alternative explanation: the stream impacts a pre-existing disk around the B-star. (We prefer the second scenario.)
In our earlier work (Puss ![]() Leedjärv 1997)
spectral investigations of AX Mon from 1985 to 1997 were presented.
We examined mostly H
Leedjärv 1997)
spectral investigations of AX Mon from 1985 to 1997 were presented.
We examined mostly H![]() ,
H
,
H![]() and
H
and
H![]() lines, and metallic, mostly Fe II lines. The results were:
lines, and metallic, mostly Fe II lines. The results were:
1) The variations of the Balmer lines are caused largely by the variability of the extent and the physical characteristics of the B star envelope;
2) The large scatter in the characteristics of FeII lines indicates that they could arise in several locations, e.g. in the hot star's envelope and in the stream of matter between the K giant and the B star.
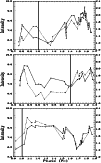 |
Figure 4:
Intensities of the H |
| Open with DEXTER | |
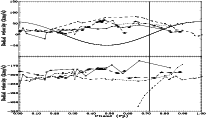 |
Figure 5:
H |
| Open with DEXTER | |
Spectroscopic observations of AX Mon have
been carried out at the Tartu
Observatory, Estonia, since 1985. The spectra obtained until early 1997 have
been described and analyzed in Puss ![]() Leedjärv (1997).
The most regular
and homogeneous set of CCD observations starts in 1996. In the present paper
we concentrate mostly on the spectra in the H
Leedjärv (1997).
The most regular
and homogeneous set of CCD observations starts in 1996. In the present paper
we concentrate mostly on the spectra in the H![]() region, recorded
between 1996 and 2000, with some reference to the earlier spectra and to
other spectral regions.
region, recorded
between 1996 and 2000, with some reference to the earlier spectra and to
other spectral regions.
The 1.5 meter telescope and the Cassegrain grating spectrograph have been
used. From 1996 to early 1999, the SpectraSource Instruments CCD camera
HPC-1 (Tek
![]() chip, pixel size
chip, pixel size
![]()
![]() m,
Peltier cooled) has been used.
Since March 1999 the spectra have been obtained with the cryogenically
cooled CCD camera ORBIS-16 (also SpectraSource Instruments, Tek
m,
Peltier cooled) has been used.
Since March 1999 the spectra have been obtained with the cryogenically
cooled CCD camera ORBIS-16 (also SpectraSource Instruments, Tek
![]() chip, pixel size
chip, pixel size
![]()
![]() m).
Altogether 97 spectra of AX Mon
in the H
m).
Altogether 97 spectra of AX Mon
in the H![]() region have been recorded,
most of them (from 6490 to 6610 Å) with a linear dispersion
region have been recorded,
most of them (from 6490 to 6610 Å) with a linear dispersion ![]() 12 Åmm-1 or 0.2 Åpix-1.
A few spectra with lower dispersion (28 Åmm-1) also have been obtained. In
addition, some spectra in the blue spectral region (H
12 Åmm-1 or 0.2 Åpix-1.
A few spectra with lower dispersion (28 Åmm-1) also have been obtained. In
addition, some spectra in the blue spectral region (H![]() ,
H
,
H![]() )
have
been obtained.
)
have
been obtained.
Preliminary reduction of the CCD spectra (subtracting the dark frame and sky background, flat-fielding) has been performed using the ESO MIDAS package. The spectrum of a star usually occupies 6-12 rows in the CCD frame. The readings in each row have been divided by the weights obtained from the vertical (y-direction) cross-section of the spectrum. The final one-dimensional spectrum is computed as a median value of those weighted rows, thereby excluding cosmic ray spikes and other random noises.
In further reduction of the spectra we used the software package KASPEK, developed and modified by Annuk (1986, and private communication) at the Tartu Observatory. For a wavelength calibration, the spectrum of a Ne-Ar (until October 1999) or Th-Ar (from October 1999 onward) hollow cathode lamp has been recorded together with all the stellar spectra. The wavelength-calibrated spectra have been normalized to the continuum. The KASPEK package has been used also for measurements of radial velocities, equivalent widths and other quantities from the normalized spectra.
 |
Figure 6: Intensities of the additional emission/absorption components over the two observed "strong" conjunctions (1999 and 1997). Solid line: intensities of the absorption component around JD 2451227; dotted line: intensities of the emission component around JD 2451227; short-dashed line: intensities of the absorption component around JD 2450762; long-dashed line: intensities of the emission component around JD 2450762. |
| Open with DEXTER | |
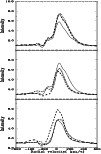 |
Figure 7:
H |
| Open with DEXTER | |
In Fig. 1 we present H![]() profiles of AX Mon
at phases of about 0.5, 0.75, 0.0 and 0.2 from 1996 to 2000 in four different orbital cycles, respectively.
Phases are computed from the conjunction of the stars (K-star in
front). Very generally speaking, the H
profiles of AX Mon
at phases of about 0.5, 0.75, 0.0 and 0.2 from 1996 to 2000 in four different orbital cycles, respectively.
Phases are computed from the conjunction of the stars (K-star in
front). Very generally speaking, the H![]() lines show a
P Cygni profile with the main emission component at about +20 kms-1 and an absorption component at about -200 kms-1.
Actually, however, in most cases we can detect emission blueward of the PCygni absorption component. Thus, the H
lines show a
P Cygni profile with the main emission component at about +20 kms-1 and an absorption component at about -200 kms-1.
Actually, however, in most cases we can detect emission blueward of the PCygni absorption component. Thus, the H![]() profiles of AX Mon resemble
those of Be-stars, with V/R mostly less than 0.3. The H
profiles of AX Mon resemble
those of Be-stars, with V/R mostly less than 0.3. The H![]() profile is
quite smooth around phase 0.5, while more details in the H
profile is
quite smooth around phase 0.5, while more details in the H![]() profile
appear at the time closer to the conjunction.
profile
appear at the time closer to the conjunction.
Intensities of the main emission and absorption components depending on time are given in Fig. 2. Weakening of the main absorption around zero-phase is well visible, but during different conjunctions the time scales and intensity of the weakening are different.
Figure 1 shows, that the H![]() main emission component is
strongest around phase 0.5, weakest around conjunction, and in the
meantime also
somewhat variable in intensity.
Figure 2 also presents the intensity of the H
main emission component is
strongest around phase 0.5, weakest around conjunction, and in the
meantime also
somewhat variable in intensity.
Figure 2 also presents the intensity of the H![]() main emission component. To a certain extent there exists a local minimum
close to the conjunction, but this phenomenon is not clearly periodical.
The intensity of the emission component mostly seems to be irregularly
variable, therefore it is
possible, that such a minimum is an incidental case.
Changes in the
intensity of the main emission component can be fast, in a time scale of
a few days, or even of a few hours (see Fig. 3).
main emission component. To a certain extent there exists a local minimum
close to the conjunction, but this phenomenon is not clearly periodical.
The intensity of the emission component mostly seems to be irregularly
variable, therefore it is
possible, that such a minimum is an incidental case.
Changes in the
intensity of the main emission component can be fast, in a time scale of
a few days, or even of a few hours (see Fig. 3).
The weaker secondary (violet) emission component
(not to mix up with additional component in blue edge
of the main (red) emission component, see later!) of H![]() is
variable similarily
to the main emission
component (see Fig. 4). This is a hint that in the
AX Mon
system a variable disk or disk-like
structure, exists.
is
variable similarily
to the main emission
component (see Fig. 4). This is a hint that in the
AX Mon
system a variable disk or disk-like
structure, exists.
Figure 5 shows radial velocities of the H![]() main emission
component depending on the phase.
The dependency varies from cycle to cycle
indicating that a region, where the line arises, has no
permanent extent. Sometimes this region seems to be concentrated closer to
the B-star, the velocity curve is then approximately
in opposite phase
with that of the cool star. Sometimes the H
main emission
component depending on the phase.
The dependency varies from cycle to cycle
indicating that a region, where the line arises, has no
permanent extent. Sometimes this region seems to be concentrated closer to
the B-star, the velocity curve is then approximately
in opposite phase
with that of the cool star. Sometimes the H![]() radial velocity is almost independent of the orbital phase, which means that
the region, where the H
radial velocity is almost independent of the orbital phase, which means that
the region, where the H![]() emission line arises, has moved further
away from the B-star.
emission line arises, has moved further
away from the B-star.
The H![]() absorption component is also variable. Often,
the component as a whole shifts together with
the blue edge of the main emission component.
In Fig. 5, lower panel, radial velocities of the H
absorption component is also variable. Often,
the component as a whole shifts together with
the blue edge of the main emission component.
In Fig. 5, lower panel, radial velocities of the H![]() main absorption component depending on the orbital phase are shown.
But here we cannot find a clear phase dependency.
Radial velocities of the H
main absorption component depending on the orbital phase are shown.
But here we cannot find a clear phase dependency.
Radial velocities of the H![]() secondary, blue emission component are
poorly determined, because of its large width.
secondary, blue emission component are
poorly determined, because of its large width.
Figure 1 also shows that around the time of the
conjunction
additional emission and/or absorption components
arise in the blue wing of the H![]() main emission
component. Their duration differs from cycle to cycle and is
correlated with the
duration of the weak intensity of the H
main emission
component. Their duration differs from cycle to cycle and is
correlated with the
duration of the weak intensity of the H![]() main absorption component.
In Fig. 6
we present the trend of the intensities of additional
components in two different cycles. In both cases the
intensities of
emission and absorption components drop until the conjunction.
Unfortunately, we have no spectrum with additional H
main absorption component.
In Fig. 6
we present the trend of the intensities of additional
components in two different cycles. In both cases the
intensities of
emission and absorption components drop until the conjunction.
Unfortunately, we have no spectrum with additional H![]() components immediately after the conjunction in 1997. The first spectrum has
been
obtained one month later, in phase 0.119 after conjunction. However,
from Fig. 7, middle panel, we are able to draw some conclusions.
It seems that
additional components of H
components immediately after the conjunction in 1997. The first spectrum has
been
obtained one month later, in phase 0.119 after conjunction. However,
from Fig. 7, middle panel, we are able to draw some conclusions.
It seems that
additional components of H![]() weaken after the conjunction,
until being fused and associated with the stronger main absorption component
of the H
weaken after the conjunction,
until being fused and associated with the stronger main absorption component
of the H![]() .
However, two orbital periods later, the situation after the
conjunction is different (see Fig. 8, right).
In this case additional components do not disappear immediately
after the conjunction,
but their intensities begin to increase. Eventually, they seem to be
associated
with the blue edge of the main emission component of H
.
However, two orbital periods later, the situation after the
conjunction is different (see Fig. 8, right).
In this case additional components do not disappear immediately
after the conjunction,
but their intensities begin to increase. Eventually, they seem to be
associated
with the blue edge of the main emission component of H![]() ,
which becomes wider.
,
which becomes wider.
If we consider all the H![]() spectra obtained
during the observing period from
1996 to 2000, it seems that the effects in connection with conjunction
of the
stars are alternately stronger and weaker.
In the case of a "strong conjunction''
weakening of the H
spectra obtained
during the observing period from
1996 to 2000, it seems that the effects in connection with conjunction
of the
stars are alternately stronger and weaker.
In the case of a "strong conjunction''
weakening of the H![]() main absorption component lasts longer
and reaches greater intensity. Then, also
additional absorption/emission components appear
in the blue edge of the H
main absorption component lasts longer
and reaches greater intensity. Then, also
additional absorption/emission components appear
in the blue edge of the H![]() main emission
component. In the case of a "weak conjunction" weakening of the main
absorption component is not so intense
and it may remain below the continuum level. In this case we do not find
additional absorption/emission components. With some reserve we can
consider the conjunctions at JD 2450297, JD 2450762,
JD 2451227, JD 2451692
as "strong" and those at JD 2450529.5,
JD 2450994.5, JD 2451459.5 as "weak".
main emission
component. In the case of a "weak conjunction" weakening of the main
absorption component is not so intense
and it may remain below the continuum level. In this case we do not find
additional absorption/emission components. With some reserve we can
consider the conjunctions at JD 2450297, JD 2450762,
JD 2451227, JD 2451692
as "strong" and those at JD 2450529.5,
JD 2450994.5, JD 2451459.5 as "weak".
This idea acquired some confirmation by the observed cyclically shifts
of the edges of
the H![]() main emission component (see Fig. 10),
although this
process is not very regular:
main emission component (see Fig. 10),
although this
process is not very regular:
1) Around
![]() a reddening of the
violet wing (with weakening of the line);
2) Around
a reddening of the
violet wing (with weakening of the line);
2) Around
![]() a reddening of the red
wing (with strengthening of the line);
a reddening of the red
wing (with strengthening of the line);
3) Around
![]() a blueing of the red
wing (with weakening of the line);
a blueing of the red
wing (with weakening of the line);
4)Around
![]() a blueing of the violet
wing (with strengthening of the line).
a blueing of the violet
wing (with strengthening of the line).
We have measured
radial velocities of the points of the H![]() profile at the
intensity level 3.5 (continuum level = 1.0).
The "four-phase cycle" mentioned above becomes evident at times with
"strong conjunctions" as at JD 2450762 and JD 2451227
(see Fig. 8 for the conjunction around JD 2451227).
For the orbital periods with "weak conjunction" this cycle is not so
distinctive.
However, some problems exist. If our supposition is true, in May 2000,
JD 2451692, a "strong conjunction"
should have taken place.
The two first parts of the expected cycle are well visible in
Fig. 10,
but then a discrepancy appears. In the phase interval 0.752-0.863 the red
edge of H
profile at the
intensity level 3.5 (continuum level = 1.0).
The "four-phase cycle" mentioned above becomes evident at times with
"strong conjunctions" as at JD 2450762 and JD 2451227
(see Fig. 8 for the conjunction around JD 2451227).
For the orbital periods with "weak conjunction" this cycle is not so
distinctive.
However, some problems exist. If our supposition is true, in May 2000,
JD 2451692, a "strong conjunction"
should have taken place.
The two first parts of the expected cycle are well visible in
Fig. 10,
but then a discrepancy appears. In the phase interval 0.752-0.863 the red
edge of H![]() is shifting to the blue. This is somewhat earlier
than supposed. But at
the same time the blue edge shifts to the blue too (see Fig. 9),
which is in contrast with earlier "strong conjunctions", when
shifting of the blue edge has taken
place after the conjunction.
This shift of the blue edge to the blue "ahead of time" arises
suspicion that
during the present "strong conjunction" also additional components will not
appear.
Unfortunately, more observations of the AX Mon system
were made impossible by the sunset glow.
Thus, there is no strict proof, that "strong" and "weak"
conjunctions appear alternately.
is shifting to the blue. This is somewhat earlier
than supposed. But at
the same time the blue edge shifts to the blue too (see Fig. 9),
which is in contrast with earlier "strong conjunctions", when
shifting of the blue edge has taken
place after the conjunction.
This shift of the blue edge to the blue "ahead of time" arises
suspicion that
during the present "strong conjunction" also additional components will not
appear.
Unfortunately, more observations of the AX Mon system
were made impossible by the sunset glow.
Thus, there is no strict proof, that "strong" and "weak"
conjunctions appear alternately.
It seems, that the appearance of the additional components in the blue edge
of the H![]() main emission component is possible, if the
blue edge
shifts sufficiently to the red.
An additional condition is that it should happen around the
conjunction, but from cycle to cycle the physical conditions
appear to change. Even during different
"strong conjunctions" the additional components behave differently (see
above).
main emission component is possible, if the
blue edge
shifts sufficiently to the red.
An additional condition is that it should happen around the
conjunction, but from cycle to cycle the physical conditions
appear to change. Even during different
"strong conjunctions" the additional components behave differently (see
above).
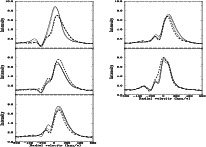 |
Figure 8:
H |
| Open with DEXTER | |
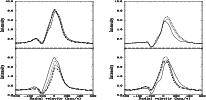 |
Figure 9:
H |
| Open with DEXTER | |
In this subsection we try to find some simple phenomenological explanations
for the behaviour of the H![]() line in the spectrum of AX Mon.
line in the spectrum of AX Mon.
(1)The main profile of H![]() is a mixture of a P Cygni profile and of a
profile with two emission components (like in Be-stars).
is a mixture of a P Cygni profile and of a
profile with two emission components (like in Be-stars).
It is known that P Cygni profile implies a spherically symmetric ejection of matter. Profiles with two emission components indicate on the other hand the existence of a disk-like structure in the system. This may be an accretion disk, formed from the material accreted from the cool star. However, the disk may indicate that the hot component is a Be-star, which ejects material itself.
Figure 4 shows that generally
intensities
of the H![]() main and secondary emission component increase or
decrease simultaneously. This
confirms the possible presence of a disk. However, because the red component
(previously known as the main emission component) is much stronger than
the violet,
or the secondary component (it is not the additional component!), it may
indicate ejection of matter from
the whole binary system.
main and secondary emission component increase or
decrease simultaneously. This
confirms the possible presence of a disk. However, because the red component
(previously known as the main emission component) is much stronger than
the violet,
or the secondary component (it is not the additional component!), it may
indicate ejection of matter from
the whole binary system.
(2) The H![]() line is variable,
but the main features
appear around the
conjunction of the stars (see Fig. 1).
line is variable,
but the main features
appear around the
conjunction of the stars (see Fig. 1).
Around the conjunction the H![]() main absorption
component becomes weaker up to the continuum level.
Duration and extent of the weakening is different for every
conjunctions. Moments, when the absorption component is faintest
are not periodic
(see Figs. 1
and 2).
It is interesting to mention
that H
main absorption
component becomes weaker up to the continuum level.
Duration and extent of the weakening is different for every
conjunctions. Moments, when the absorption component is faintest
are not periodic
(see Figs. 1
and 2).
It is interesting to mention
that H![]() and H
and H![]() absorption components
become stronger during the conjunctions (Cowley 1964).
absorption components
become stronger during the conjunctions (Cowley 1964).
Since the effects connected to the conjunction of the stars are
associated with the viewing
angle, those effects have
mainly a geometrical origin. Since the variability of
the H![]() line varies from cycle to cycle, it suggests
changing physical conditions in the AX Mon system.
line varies from cycle to cycle, it suggests
changing physical conditions in the AX Mon system.
A possible reason: around the conjunction the H![]() absorption
component is being suppressed by cloud or clouds between the two stars,
which generates the H
absorption
component is being suppressed by cloud or clouds between the two stars,
which generates the H![]() emission. Parameters of the cloud
(clouds) are most likely not constant. At shorter
wavelengths, this region may not be able
to generate emission, but only add to the absorption. As a result,
the H
emission. Parameters of the cloud
(clouds) are most likely not constant. At shorter
wavelengths, this region may not be able
to generate emission, but only add to the absorption. As a result,
the H![]() and H
and H![]() absorption components can
become stronger .
absorption components can
become stronger .
(3) Around the conjunction additional
absorption or emission
components on the blue edge of the H![]() main emission component
sometimes appear (see
Fig. 1). Their evolution in time
is different for every conjunction (see
Figs. 7 and 8). This phenomenon implies
that flows of the matter between
the components of the binary system
are non-stationary (see (2)).
Figure 7 presents the evolution of the additional components
in 1997. They influence also the secondary emission
component, which evolves parallel to the
additional emission component
(see Fig. 4). Finally, the latter becomes
weaker and fuses with the
main absorption component (at the same time also the secondary
emission component becomes weaker).
main emission component
sometimes appear (see
Fig. 1). Their evolution in time
is different for every conjunction (see
Figs. 7 and 8). This phenomenon implies
that flows of the matter between
the components of the binary system
are non-stationary (see (2)).
Figure 7 presents the evolution of the additional components
in 1997. They influence also the secondary emission
component, which evolves parallel to the
additional emission component
(see Fig. 4). Finally, the latter becomes
weaker and fuses with the
main absorption component (at the same time also the secondary
emission component becomes weaker).
Figure 8 presents the situation two orbital periods later. Here, the additional components vary in a more complex manner. At first, the main absorption component disappears totally, then arises again at very negative radial velocity, about -305 kms-1, moves to the red and becomes stronger. The secondary emission component changes analogously. The additional components last for a longer time.
(4) Wings of the main emission component seem to be variable in
a "four-phase" cycle
(see Sect. 3.2 and Fig. 10). This cycle appears
only, when
phenomena associated with the conjunction of the stars are
stronger (additional
H![]() components appear, H
components appear, H![]() main absorption component becomes
weaker). In "weak conjunctions" this cycle does
not turn up completely.
However, in 2000, when a "strong conjunction" should have happened,
the "four-phase" cycle was cut off at the third phase. Actually,
the third and the fourth
phase took place
together! Figure 10 (upper panel) shows that the
reddening of the blue edge of the
H
main absorption component becomes
weaker). In "weak conjunctions" this cycle does
not turn up completely.
However, in 2000, when a "strong conjunction" should have happened,
the "four-phase" cycle was cut off at the third phase. Actually,
the third and the fourth
phase took place
together! Figure 10 (upper panel) shows that the
reddening of the blue edge of the
H![]() main emission component lasted much shorter compared
with the reddening in other "strong conjunctions"
(see also Fig. 9, lower left panel and the right panel).
This all indicates again a non-homogeneous distribution of the
circumstellar material.
main emission component lasted much shorter compared
with the reddening in other "strong conjunctions"
(see also Fig. 9, lower left panel and the right panel).
This all indicates again a non-homogeneous distribution of the
circumstellar material.
(5) It seems,
that all these effects appear more or less
alternately.
Consequently, we presume
that in the AX Mon system a cyclicity could exist in the H![]() line with the duration of about two orbital
periods (see Sect. 3.2).
line with the duration of about two orbital
periods (see Sect. 3.2).
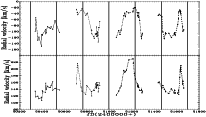 |
Figure 10:
Radial velocities of the edges of the H |
| Open with DEXTER | |
According to Cowley (1964), narrow shell-lines of ionized
metals appear in
the spectrum of AX Mon near the time of conjunction, and they are
interpreted as arising in a stream of matter moving from the K-giant to the
hot star at about +25 kms-1. At the same time, absorption components
of the Balmer H![]() and H
and H![]() lines become stronger. In the present
paper, we have shown that around the time of the conjunction of the two
stars the H
lines become stronger. In the present
paper, we have shown that around the time of the conjunction of the two
stars the H![]() line is also variable in quite a complex manner.
line is also variable in quite a complex manner.
At the risk of some oversimplification, we can state that the
H![]() profiles indicate that in the AX Mon system an
extended disk-like envelope exists around
the B(e)-star where the H
profiles indicate that in the AX Mon system an
extended disk-like envelope exists around
the B(e)-star where the H![]() emission
line originates. On top of the H
emission
line originates. On top of the H![]() emission variable absorption components are
superimposed. Around phase 0.5 (B-star in front) the H
emission variable absorption components are
superimposed. Around phase 0.5 (B-star in front) the H![]() profile resembles a classical P Cygni profile. During orbital
phases closer to the conjunction, the H
profile resembles a classical P Cygni profile. During orbital
phases closer to the conjunction, the H![]() profiles become more
complicated: additional absorption components appear, sometimes the "normal"
main absorption component disappears at all and the line as a whole shifts
on the velocity scale etc. Assuming the orbital inclination i=650, the
eclipses by the gas cloud (see below)
alone cannot explain all the phenomena observed
close to the conjunction.
profiles become more
complicated: additional absorption components appear, sometimes the "normal"
main absorption component disappears at all and the line as a whole shifts
on the velocity scale etc. Assuming the orbital inclination i=650, the
eclipses by the gas cloud (see below)
alone cannot explain all the phenomena observed
close to the conjunction.
When the orbital motion brings the stars closer to the quadrature
(phase 0.75),
usually the main emission component of H![]() will be distorted by
additional absorption(s) at radial velocities
will be distorted by
additional absorption(s) at radial velocities ![]() -50 kms-1.
Around the same orbital phase (0.75) a 0.5 mag dip in the U light
curve has been observed. Elias et al. (1997) explain
this drop as
due to a gas cloud close to the B-star
scattering and/or absorbing light. The absence of dips at longer
wavelengths requires a strongly bandpass-specific opacity,
which could be caused
by the Balmer continuum shortward of the jump and by the many high-order
Balmer lines. Most likely it is the same cloud which
is responsible for the
additional absorption components appearing in the H
-50 kms-1.
Around the same orbital phase (0.75) a 0.5 mag dip in the U light
curve has been observed. Elias et al. (1997) explain
this drop as
due to a gas cloud close to the B-star
scattering and/or absorbing light. The absence of dips at longer
wavelengths requires a strongly bandpass-specific opacity,
which could be caused
by the Balmer continuum shortward of the jump and by the many high-order
Balmer lines. Most likely it is the same cloud which
is responsible for the
additional absorption components appearing in the H![]() profile near
phase 0.75. Relying mostly on the photometric observations by Magalashvili
& Kumsishvili (1969), Elias et al.
(1997) have found that the 0.5
mag dip in the U bandpass is a persistent
feature over at least five orbital
cycles. However, our spectroscopic observations show that additional
absorption components do not necessarily occur in every orbital cycle (see
Fig. 1,
upper left panel, H
profile near
phase 0.75. Relying mostly on the photometric observations by Magalashvili
& Kumsishvili (1969), Elias et al.
(1997) have found that the 0.5
mag dip in the U bandpass is a persistent
feature over at least five orbital
cycles. However, our spectroscopic observations show that additional
absorption components do not necessarily occur in every orbital cycle (see
Fig. 1,
upper left panel, H![]() profile from January 25, 1997 = JD 2450474).
profile from January 25, 1997 = JD 2450474).
Variations of the H![]() profile closer to the conjunction (phase 0.0)
and
after that also vary from cycle to cycle. As discussed in
Sect. 3.2, it seems that so called "strong" and "weak" conjunctions take
place alternately. A correlation between the photometric
and spectroscopic characteristics is not always present.
Assuming that the more or less
regular fading of the ultraviolet light of AX Mon around phase 0.75
is persistent up to the time of our observations,
we noticed that during photometric constancy, spectroscopic features come
and go.
This is possible, considering that the attenuating cloud in front of the
B-star probably is
consisting of many small cloudlets, which may move to-and-fro
and with different speeds. The overall extent of the attenuating
cloud, which determines the photometric behaviour, remains more or less
constant, while the forming of additional absorption components in the
H
profile closer to the conjunction (phase 0.0)
and
after that also vary from cycle to cycle. As discussed in
Sect. 3.2, it seems that so called "strong" and "weak" conjunctions take
place alternately. A correlation between the photometric
and spectroscopic characteristics is not always present.
Assuming that the more or less
regular fading of the ultraviolet light of AX Mon around phase 0.75
is persistent up to the time of our observations,
we noticed that during photometric constancy, spectroscopic features come
and go.
This is possible, considering that the attenuating cloud in front of the
B-star probably is
consisting of many small cloudlets, which may move to-and-fro
and with different speeds. The overall extent of the attenuating
cloud, which determines the photometric behaviour, remains more or less
constant, while the forming of additional absorption components in the
H![]() profile depends on the prevailing direction and velocity
of motion of
the cloudlets at any given time. As suggested by Elias et al. (1997),
some
material can occasionally be blown up high enough to be projected
against the
B-star's photosphere even at phases rather far away from the conjunction.
For example, Fig. 7 in Elias et al. (1997) shows that the main
absorption
of H
profile depends on the prevailing direction and velocity
of motion of
the cloudlets at any given time. As suggested by Elias et al. (1997),
some
material can occasionally be blown up high enough to be projected
against the
B-star's photosphere even at phases rather far away from the conjunction.
For example, Fig. 7 in Elias et al. (1997) shows that the main
absorption
of H![]() has been vanished and additional absorption components are
present at phase 0.209 (JD 2449416). Also, our spectra have shown a
somewhat
similar H
has been vanished and additional absorption components are
present at phase 0.209 (JD 2449416). Also, our spectra have shown a
somewhat
similar H![]() profile at phase 0.177 (Fig. 1,
lower left panel).
profile at phase 0.177 (Fig. 1,
lower left panel).
On the other hand, by the absence of simultaneous photometric and spectroscopic data, we cannot be absolutely sure that the photometric behaviour of AX Mon in 1990s has been the same as in 1960s. Referring again to Elias et al. (1997), one can see from their Fig. 2 that during about one year (March 1995 to March 1996), there has been a rather large scatter in the star's brightness in the Strömgren u filter. Although the dip at phase 0.75 is well visible, its duration is much shorter than in the broadband U filter data from 1960s (Fig. 1 in Elias et al. 1997). The difference in the bandwidths of the Johnson U and Strömgren u filters hardly accounts for this discrepancy, as both filters include the Balmer jump. According to our "schedule" of alternating conjunctions, the time interval from March 1995 to March 1996 includes a "weak" conjunction in December 1995. Thus, there is a hint that during "weak" conjunctions the dip in the U magnitude could last shorter as compared to "strong" conjunctions.
Still an intriguing question remains, viz. whether the "strong" and "weak" conjunctions really alternate over longer time intervals, and if so, what the reason might be for this type of variability. A search for a possible physical mechanism which drives gas flows in the AX Mon system with a periodicity of approximately two orbital periods requires understanding of the formation mechanism of the cloud in the vicinity of the B-star.
Elias et al. (1997) put forward two alternative mechanisms for generating the attenuating cloud. The first one: the cloud is the self-intersection "point", where incoming cloudlets from the K-star collide with other cloudlets which have encircled the B-star before. An alternative mechanism is, that the stream from the K-star impacts a pre-existing disk- or shell-structure that orbits the B-star. This structure may consist of matter ejected by the B-star itself. Thus, the hot component could actually be a Be-star.
Be-stars are generally known as rapidly rotating objects which eject matter,
mainly in their equatorial plane. This process can be variable on different
time scales. Also, it is known that transitions B
![]() Be
Be
![]() Be shell star can occur on a time scale from years to decades.
Some time ago Kriz & Harmanec (1975) suggested that all the
Be-stars could
be members of binary systems being spun up to rapid rotation by mass
transfer. This suggestion has not been entirely confirmed by later
investigations, for instance, Gies (2000) has presented arguments
that most of
Be-stars cannot be components of active mass transfer systems. In the
AX Mon system,
however, a clear evidence of mass transfer can be found. Tarasov
(2000) has
classified AX Mon as a W Ser type active binary.
Be shell star can occur on a time scale from years to decades.
Some time ago Kriz & Harmanec (1975) suggested that all the
Be-stars could
be members of binary systems being spun up to rapid rotation by mass
transfer. This suggestion has not been entirely confirmed by later
investigations, for instance, Gies (2000) has presented arguments
that most of
Be-stars cannot be components of active mass transfer systems. In the
AX Mon system,
however, a clear evidence of mass transfer can be found. Tarasov
(2000) has
classified AX Mon as a W Ser type active binary.
AX Mon is an interacting
binary system in the stage of active mass transfer
between the components. Our study of the variability of the H![]() emission line has led to the following conclusions:
emission line has led to the following conclusions:
(1) The H![]() profile which is a mixture of a PCygni profile and of a
profile with two emission peaks indicates that an extended gaseous envelope
exists around the hot component of the
AX Mon system. The hot component
is most
likely a Be-star and the shape of the envelope might be something
intermediate between a spherically symmetric expanding envelope and a flat
equatorial disk.
profile which is a mixture of a PCygni profile and of a
profile with two emission peaks indicates that an extended gaseous envelope
exists around the hot component of the
AX Mon system. The hot component
is most
likely a Be-star and the shape of the envelope might be something
intermediate between a spherically symmetric expanding envelope and a flat
equatorial disk.
(2) The H![]() profiles are variable on time scales from hours to years,
with main features appearing around the conjunction of the stars (K-star in
front). Those features include weakening of the main absorption component
and appearance of the additional emission and absorption components. Also
the H
profiles are variable on time scales from hours to years,
with main features appearing around the conjunction of the stars (K-star in
front). Those features include weakening of the main absorption component
and appearance of the additional emission and absorption components. Also
the H![]() line as a whole shifts on the wavelength scale in a certain
"four-phase" cycle.
line as a whole shifts on the wavelength scale in a certain
"four-phase" cycle.
(3) There is a rather strong, but still no final evidence that the
effects
mentioned in (2) reveal themselves at every second conjunction. We propose
to call those conjunctions "strong" (at JD 2450297, 2450762,
2451227, 2451692), while during "weak" conjunctions (at JD 2450529.5, 2450994.5, 2451459.5) changes in the H![]() profile are quite small. This possible cyclicity with a duration of
approximately two orbital periods needs further explanation.
profile are quite small. This possible cyclicity with a duration of
approximately two orbital periods needs further explanation.
(4) The cloud of gas in the vicinity of the Be-star, proposed by Elias et al. (1997) to cause a nearly 0.5 mag dip in the U light curve near
the phase 0.75, is responsible also for most of the variations of the
H![]() profile. This high-density
cloud, most likely, arises when the stream of the
matter from the K-star collides with the pre-existing disk-like structure
around the Be-star.
profile. This high-density
cloud, most likely, arises when the stream of the
matter from the K-star collides with the pre-existing disk-like structure
around the Be-star.
In order to determine more definitely, which stage of mass transfer is taking place in the AX Mon system, one still needs more observational data in different wavelength regions such as conventional broad-band photometry. A search for a correlation between photometric and spectroscopic properties would give a significant insight into the pattern of the long-term variability. Referring once more to the paper by Elias et al (1997), one can see from their Figs. 1 and 2 that the photometric behaviour of AX Mon was slightly different in the 1960s and the 1990s. There is a possibility that mass transfer in the AX Mon system was quite stable in the 1960s, while in the 1990s more instabilities have set in.
Acknowledgements
The authors are thankful to K. Annuk, T. Eenmäe and I. Kolka for obtaining several spectra of AX Mon in the framework of the joint observing programme of the stellar physics group at Tartu Observatory. Dr. I. Kolka is acknowledged also for fruitful discussions. We thank anonymous referee for useful suggestions. The present study has been supported by the Estonian Science Foundation grants Nos. 827 and 3166.