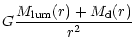
Evidence for a disturbed velocity structure in the outer regions of the galaxy NGC 1399 comes from a re-analysis of the planetary nebulae data from Arnaboldi et al. (1994). We find a strong rotation along a
A&A 383, 791-800 (2002)
DOI: 10.1051/0004-6361:20011795
N. R. Napolitano 1,2 - M. Arnaboldi 1 - M. Capaccioli 1,2
1 - Osservatorio Astronomico di Capodimonte, via Moiariello 16,
80131 Napoli, Italy
2 -
Dipartimento di Scienze Fisiche, Università di Napoli
Federico II,
complesso Monte S. Angelo, via Cintia, 80126 Napoli, Italy
Received 14 September 2001 / Accepted 17 December 2001
Abstract
Evidence for a disturbed velocity structure in the outer regions of the galaxy NGC 1399 comes from a re-analysis of the planetary nebulae data from Arnaboldi et al. (1994). We find a strong rotation along a
![]() for
for ![]() which is followed by a rapid drop off at larger radii, where the velocity dispersion starts to increase. This kinematical behavior can be interpreted as an indication for an interaction scenario. Interaction is advocated in previous analysis of the halo regions of this system, based on different dynamical tracers such as globular clusters and X-rays, but in all these studies the mass distribution is derived under the equilibrium hypothesis, which is not appropriate when an interaction takes place. Here we attempt a non-equilibrium dynamical analysis of NGC 1399: with a simple model and under the impulse approximation, we show that the observed kinematics is consistent with an energy injection caused by a flyby encounter of NGC 1399 with the nearby system NGC 1404. In this approach, we find a mass-to-light ratio,
which is followed by a rapid drop off at larger radii, where the velocity dispersion starts to increase. This kinematical behavior can be interpreted as an indication for an interaction scenario. Interaction is advocated in previous analysis of the halo regions of this system, based on different dynamical tracers such as globular clusters and X-rays, but in all these studies the mass distribution is derived under the equilibrium hypothesis, which is not appropriate when an interaction takes place. Here we attempt a non-equilibrium dynamical analysis of NGC 1399: with a simple model and under the impulse approximation, we show that the observed kinematics is consistent with an energy injection caused by a flyby encounter of NGC 1399 with the nearby system NGC 1404. In this approach, we find a mass-to-light ratio,
![]() within R=400'', which is about half of that requested when equilibrium is assumed, i.e.
within R=400'', which is about half of that requested when equilibrium is assumed, i.e.
![]() .
.
Key words: techniques: radial velocities - galaxies: elliptical - galaxies: kinematics and dynamics, dark matter - galaxies: halos - galaxies: interactions
Inner parts of galaxy clusters are the birthplaces of complex dynamical situations involving interactions between galaxies. Morphological segregation (Dressler 1980; Whitmore et al. 1993; Dressler et al. 1997), HI deficiency of cluster spirals (Haynes et al. 1984; Solanes et al. 2001), extended envelopes in density profiles of cD galaxies (Schombert 1986), structures in the density and temperature maps of X-rays (Roettiger et al. 1995; Irwin & Sarazin 1996; Kikuchi et al. 2000), are some of the signatures of environmental effects on cluster galaxies. These interactions may also produce disturbed velocity structures in the outskirts of cluster galaxies, which is a well established fact for spirals. Significant statistics based on extended rotation curves measured by coupling HI with HII emission have disclosed a decline at large galactocentric distances in contrast with the asymptotic flat behavior for field spirals (Whitmore et al. 1988; Adami et al. 1999; Rubin et al. 1999) and/or asymmetries (Dale et al. 2001). On the contrary, the situation for ellipticals is still unclear owing to the lack of classical kinematical tracers in the outer regions of these galaxies.
A recent development has been offered by the first measurements of the discrete radial velocity fields of globular clusters (GCs) and planetary nebulae (PNe) in nearby early-type galaxies. In particular, PNe follow the stellar light distribution (Ciardullo et al. 1989; Ciardullo et al. 1991; McMillan et al. 1993; Ford et al. 1996) and share the same kinematical behavior where they overlap with the integrated stellar light data (Arnaboldi et al. 1994, 1996, 1998; Hui et al. 1995). Thus, PNe appear as the natural candidates to gauge the stellar kinematics in the outskirts of ellipticals. Up to now the limiting factor in the use of discrete radial velocity fields has been the small number statistics (SNS). In distant galaxies (D>15 Mpc) the measured samples typically consist of less than a hundred radial velocities both for PNe and GCs, and some doubts may arise on the mass and angular momentum estimates based on these data alone. Recently Napolitano et al. (2001, NAFC hereafter) have shown that, even under SNS regime, discrete tracers do carry some important kinematical information and can be successfully used for mass and angular momentum estimates and search for kinematical signatures of interactions.
An interesting target in this context is NGC 1399, the cD galaxy of the Fornax cluster. Despite its apparent regular morphology, this object exhibits some peculiarities which indicate that its real dynamical status is still unclear.
The extended stellar envelop (Schombert 1986) and the unusual overabundance of globular clusters (Kissler-Patig et al. 1999 and references therein), together with an increasing velocity dispersion in the outer regions from discrete radial velocity field of both GCs (Grillmair et al. 1994; Minniti et al. 1998; Kissler-Patig et al. 1999) and PNe (Arnaboldi et al. 1994), suggest an interaction scenario, which is also supported by X-ray data. The X-ray temperature profile of the extended gaseous halo (Ikebe et al. 1996; Rangajan et al. 1995; Jones et al. 1997) is compatible with the velocity dispersion from PNe and GCs. Recently, Paolillo et al. (2002) analysed deep ROSAT HRI data with an adaptive smoothing technique. They found: 1) an extended and asymmetric hot gas halo distributed out to the cluster scale; 2) a multicomponent density profile which flattens at 1 arcmin with one "shoulder'' at R=450'', i.e. within the separation between NGC 1399 and NGC 1404; 3) filamentary structures and holes in the intensity map; 4) a displacement of the gas centroid with respect the luminous component. All these features are qualitatively expected in a tidal interaction scenario (D'Ercole et al. 2000; Barnes 2000).
In this context the dynamical description of this system is complex: interactions are associated to non-equilibrium situations which are difficult to handle.
Previous studies assumed equilibrium to infer the mass distribution of NGC 1399
(Bicknell et al. 1989; Arnaboldi et al. 1994;
Minniti et al. 1998; Kissler-Patig et al. 1999; Saglia et al.
2000).
They all show an increasing mass-to-light ratio (
![]() )
outwards. These values match the local
M/L ratios inferred for clusters from X-ray measurements, and are consistent with those derived from the equilibrium analysis of the temperature profile of the X-ray gas around NGC 1399
(Killeen & Bicknell 1988; Rangajan et al. 1995; Jones et al. 1997).
The question is whether these mass estimates are realistic: non-equilibrium kinematics can mimic an overall higher mass content and cause mass overestimates (Mihos 2000).
Here we attempt a quantitative non-equilibrium analysis to derive the mass distribution of NGC 1399.
)
outwards. These values match the local
M/L ratios inferred for clusters from X-ray measurements, and are consistent with those derived from the equilibrium analysis of the temperature profile of the X-ray gas around NGC 1399
(Killeen & Bicknell 1988; Rangajan et al. 1995; Jones et al. 1997).
The question is whether these mass estimates are realistic: non-equilibrium kinematics can mimic an overall higher mass content and cause mass overestimates (Mihos 2000).
Here we attempt a quantitative non-equilibrium analysis to derive the mass distribution of NGC 1399.
This paper is organised as follow. New estimates of the PNe kinematical quantities in the outer halo of NGC 1399 are obtained in Sect. 2, where some evidence of a disturbed rotational structure is also given. In Sect. 3 the PNe rotation curve and velocity dispersion profile are combined with the stellar and GCs kinematics to derive the mass distribution via the inversion of the Jeans equations, under equilibrium hypothesis. We then investigate whether NGC 1399 is a system out of equilibrium because of ongoing encounters with nearby systems in the core of the Fornax Cluster and derive a new mass accordingly. Conclusions are presented in Sect. 4. Throughout this paper, we will assume a distance of 17 Mpc for NGC 1399 (McMillan et al. 1993).
![\begin{figure}
\par\includegraphics[width=6.8cm,clip]{h3150F1.ps}\end{figure}](/articles/aa/full/2002/09/aah3150/img32.gif) |
Figure 1:
PNe radial velocity field of
NGC 1399 from Arnaboldi et al. (1994).
Full dots are velocities above the mean velocity,
|
| Open with DEXTER | |
![\begin{figure}
\par\includegraphics[width=6.2cm,clip]{h3150F2.ps}\hspace*{8mm}
\includegraphics[width=6.2cm,clip]{h3150F3.ps}\end{figure}](/articles/aa/full/2002/09/aah3150/img33.gif) |
Figure 2:
Left panel: radial velocities (open circles), which are selected along a 100'' wide strip about the Z1 axis, are plotted
against distance along this axis. Full circles are the mean velocities
in each bin, while radial velocities from integrated light data
(D'Onofrio et al. 1995; Graham et al. 1998; Saglia et al. 2000) are indicated with open symbols (triangles, squares, pentagons).
The solid line is the bilinear fit and the dot-dashed line represents the flat curve fit to the data along Z1. Vertical dashed lines indicate the bin size
adopted for the kinematical estimates. Right panel: radial velocities (with the related PN ID numbers)
are plotted as a function of the projected distance from the center,
|
| Open with DEXTER | |
Rotation - The binned
![]() data (Table 2) suggest that the PNe system rotates quite strongly inside
data (Table 2) suggest that the PNe system rotates quite strongly inside
![]() ,
while it does not in the outer regions. This behavior was not seen by Arnaboldi et al. (1994), who discussed only the results from the bilinear fit.
Grillmair et al. (1994) and Minniti et al. (1998) do not report any rotation of the GCs system out to
,
while it does not in the outer regions. This behavior was not seen by Arnaboldi et al. (1994), who discussed only the results from the bilinear fit.
Grillmair et al. (1994) and Minniti et al. (1998) do not report any rotation of the GCs system out to ![]() 8', while Kissler-Patig et al. (1999) found evidence of rotation only at large radii (
8', while Kissler-Patig et al. (1999) found evidence of rotation only at large radii (
![]() km s-1 for
km s-1 for
![]() along a
along a
![]() ). They attribute this feature to a tidal interaction or merging of cluster galaxies passing throughout the core of the Fornax Cluster, rather than to the sign of a relative high local angular momentum. We shall discuss this possibility in more details later. In any case, the lack of an inner rotation of the GC system supports its decoupling from the stellar component.
). They attribute this feature to a tidal interaction or merging of cluster galaxies passing throughout the core of the Fornax Cluster, rather than to the sign of a relative high local angular momentum. We shall discuss this possibility in more details later. In any case, the lack of an inner rotation of the GC system supports its decoupling from the stellar component.
Velocity dispersion - In each Z1 bin, the projected velocity dispersion is the standard deviation of the sample (e.g. no-fit procedure, see NAFC), corrected for the measurement errors,
![]() ,
where
,
where
![]() km s-1 from Arnaboldi et al. (1994). Outside
km s-1 from Arnaboldi et al. (1994). Outside
![]() ,
where no rotation is found, the velocity dispersion is obtained in radial annuli in order to retain all data (Fig. 2, right panel) and improve precision. The results are summarized in Table 2.
The velocity dispersion has a minimum at
,
where no rotation is found, the velocity dispersion is obtained in radial annuli in order to retain all data (Fig. 2, right panel) and improve precision. The results are summarized in Table 2.
The velocity dispersion has a minimum at
![]() ,
where
,
where
![]() drops, and increases outwards (see also Fig. 4). PN
drops, and increases outwards (see also Fig. 4). PN
![]() values are consistent with the integrated light's at small R and with GCs' at large R.
values are consistent with the integrated light's at small R and with GCs' at large R.
This peculiar kinematical behavior possibly calls for a complex dynamical situation. In particular, the evidence that decoupled populations, such as PNe and GCs, exhibit the same "heating'' in the outer regions appears peculiar. In the following we shall consider different scenarios for the dynamical status of the system, to be extensively analysed in the next section:
Case a) The system, at equilibrium, has two decoupled dynamical components: an inner, rotating, cold component (possibly a disk) and an outer, non-rotating, hot component, and the transition region occurs at
![]() .
In principle, we can expect some signatures of this multicomponent structure in the surface brightness profile. Improved photometric studies and a more detailed kinematics are needed for any significant treatments of this picture. The possibility of an inner extended disk as cold component seems, however, unlikely because such large disk sizes are not observed in ellipticals (Nieto et al. 1991; van den Bosch et al. 1994; Scorza et al. 1998) or expected from multicomponent models (van den Bosch 1998): this scenario will not be included in the analysis which follows.
.
In principle, we can expect some signatures of this multicomponent structure in the surface brightness profile. Improved photometric studies and a more detailed kinematics are needed for any significant treatments of this picture. The possibility of an inner extended disk as cold component seems, however, unlikely because such large disk sizes are not observed in ellipticals (Nieto et al. 1991; van den Bosch et al. 1994; Scorza et al. 1998) or expected from multicomponent models (van den Bosch 1998): this scenario will not be included in the analysis which follows.
| PNe global kinematical quantities | |||||
| Bilinear Fit | Flat-Curve Fit | ||||
| Sample |
|
gradV |
|
||
| 37 PNe |
|
|
|||
| 34 PNe |
|
|
|
|
|
Case b) In a more conservative way, if PNe are a system at equilibrium in
the gravitational potential of NGC 1399, the rise of
![]() (i.e. of
the pressure gradient) is needed to compensate the lack of rotation at large radii.
In this and the above picture, the external regions are fading into the cluster as
we can infer from both the luminosity and velocity dispersion profiles which are
consistent with the cluster profiles (Grillmair et al. 1994; Arnaboldi et al.
1994; Kissler-Patig et al. 1999).
In the following dynamical analysis, we will refer to this as
Model I.
(i.e. of
the pressure gradient) is needed to compensate the lack of rotation at large radii.
In this and the above picture, the external regions are fading into the cluster as
we can infer from both the luminosity and velocity dispersion profiles which are
consistent with the cluster profiles (Grillmair et al. 1994; Arnaboldi et al.
1994; Kissler-Patig et al. 1999).
In the following dynamical analysis, we will refer to this as
Model I.
Case c) An alternative picture is that the regions at radii R>140''
experienced some forms of interaction with the cluster. This possibility has
been invoked in previous works on PNe and GCs kinematics and also in X-ray
studies (Rangajan et al. 1995; Ikebe et al. 1996; Jones et al.
1997; Paolillo et al. 2002). In this case there might be
objects which are no more bound to NGC 1399. There are three outliers in the
distribution of
![]() for the last radial bin (Fig. 3). Their
large velocities are inconsistent with the Gaussian-like behavior expected for
the radial velocity distributions based on small statistical
samples
for the last radial bin (Fig. 3). Their
large velocities are inconsistent with the Gaussian-like behavior expected for
the radial velocity distributions based on small statistical
samples![]() . Moreover they are responsible for the number overdensity in the outer regions of the galaxy (see Fig. 3).
Were NGC 1399 a relaxed system, these objects should not be included
when computing the mass at equilibrium
(Model II, hereafter).
The global kinematical quantities computed after
discarding PN
. Moreover they are responsible for the number overdensity in the outer regions of the galaxy (see Fig. 3).
Were NGC 1399 a relaxed system, these objects should not be included
when computing the mass at equilibrium
(Model II, hereafter).
The global kinematical quantities computed after
discarding PN ![]() ,
13 and 36
(Fig. 2), are listed in Table 1, and the rotation
velocity and velocity dispersion values in Table 2.
,
13 and 36
(Fig. 2), are listed in Table 1, and the rotation
velocity and velocity dispersion values in Table 2.
Case d) Finally, we assume that the outer halo of NGC 1399 is not at equilibrium (Model III, hereafter). This picture is treated separately in the next section.
![\begin{figure}
\par\includegraphics[width=5.8cm,clip]{h3150F4.ps}\hspace*{6mm}
\includegraphics[width=5.8cm,clip]{h3150F5.ps}\end{figure}](/articles/aa/full/2002/09/aah3150/img55.gif) |
Figure 3:
Left panel: distribution of the radial velocities in the last radial bin,
|
| Open with DEXTER | |
| PNe projected kinematical quantities | ||||||
| 37 PNe | 34 PNe | |||||
| Distance |
|
|
Distance |
|
|
Procedure |
| 39'' | 28'' | NF(Z1) | ||||
| 101'' | 101'' | NF(Z1) | ||||
| 116'' | 116'' | BF(R)(*) | ||||
| 156'' | 157'' | NF(R) | ||||
| 182'' | 173'' | NF(Z1) | ||||
| 225'' | 224'' | NF(R) | ||||
By combining PN and GC data with the inner stellar kinematics it is possible to infer the mass distribution out to the halo regions of NGC 1399![]() .
As in previous work with larger samples
(Hui et al. 1995), one solves the
Jeans equations in the equatorial plane and obtains the mass distribution in some analytical form. NGC 1399 is a nearly round (E0-E1) galaxy. Its dynamics depends on the ellipticity of the potential, which is much rounder than its density distribution (
.
As in previous work with larger samples
(Hui et al. 1995), one solves the
Jeans equations in the equatorial plane and obtains the mass distribution in some analytical form. NGC 1399 is a nearly round (E0-E1) galaxy. Its dynamics depends on the ellipticity of the potential, which is much rounder than its density distribution (
![]() ;
Binney & Tremaine 1987). Therefore, spherical symmetry is adopted for this system.
;
Binney & Tremaine 1987). Therefore, spherical symmetry is adopted for this system.
For sake of simplicity, we assume isotropy for the velocity ellipsoid in the Jeans equations, accordingly with previous works based on discrete radial velocity fields in different early-type systems (Grillmair et al. 1994;
Hui et al. 1995; Arnaboldi et al. 1998; Kissler-Patig et al. 1999). Indeed, isotropy is not excluded by previous dynamical studies, based on integrated light data: i) Bicknell et al. (1989) found a variable anisotropy parameter within 100'' around a central null value for a constant mass-to-light ratio,
![]() ;
ii) Saglia et al. (2000) found that a wide range of anisotropy parameter, including the isotropic case, are compatible with the dispersion profiles from PNe and GCs.
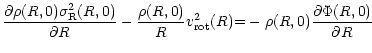
On the equatorial plane (z=0), the isotropic axisymmetric Jeans equation
;
ii) Saglia et al. (2000) found that a wide range of anisotropy parameter, including the isotropic case, are compatible with the dispersion profiles from PNe and GCs.
On the equatorial plane (z=0), the isotropic axisymmetric Jeans equation
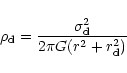
1) under spherical symmetry, we compute ![]() by deprojecting the Killeen & Bicknell's (1988) surface brightness profile
by deprojecting the Killeen & Bicknell's (1988) surface brightness profile
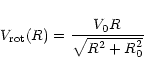
2) Due to the lack of detailed data, a simplified model of
![]() is assumed: we have a linear regime out to
is assumed: we have a linear regime out to
![]() ,
then
,
then
![]() drops to zero.
This artificial model is deprojected assuming circular orbits and no correction is adopted for inclination (the reason is that the peak velocity is already large enough to accommodate a high inclination).
drops to zero.
This artificial model is deprojected assuming circular orbits and no correction is adopted for inclination (the reason is that the peak velocity is already large enough to accommodate a high inclination).
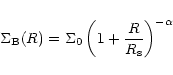
3) We consider a dark mass contribution to the potential by a simple pseudo-isothermal sphere:
| = |  |
||
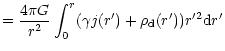 |
(4) |
4)
![]() and
and ![]() are assigned by matching the velocity dispersion
solution of the IRJE, once projected along the line-of-sight, to the observed velocity dispersion estimates by minimizing the
are assigned by matching the velocity dispersion
solution of the IRJE, once projected along the line-of-sight, to the observed velocity dispersion estimates by minimizing the ![]() .
.
This procedure implicitly assumes that the system is at equilibrium.
Model I: We consider the complete sample of 37 PNe plus the GCs data from Kissler-Patig et al. (1999).
The fit to the velocity dispersion profile is shown in Fig. 4
with the confidence regions for the best-fit parameters (
![]() km s-1,
km s-1,
![]() ). The mass distribution is shown in Fig. 5: it gives
). The mass distribution is shown in Fig. 5: it gives
![]() within 400'', where the quoted errors are related to the extreme values of
within 400'', where the quoted errors are related to the extreme values of
![]() and
and ![]() in 68% confidence region and produce the dot-dashed dispersion models in Fig. 4.
in 68% confidence region and produce the dot-dashed dispersion models in Fig. 4.
![\begin{figure}
\par\includegraphics[width=6cm,clip]{h3150F6.ps}\hspace*{5mm}
\in...
...3150F8.ps}\hspace*{5mm}
\includegraphics[width=6cm,clip]{h3150F9.ps}\end{figure}](/articles/aa/full/2002/09/aah3150/img97.gif) |
Figure 4:
Velocity dispersion profiles observed and modeled and the confidence regions for the model parameters.
Upper left box: the PNe estimates in Z1 bins (filled pentagons) and radial annuli
(filled circles) are plotted with the mean stellar kinematics in spatial bins (filled triangles) obtained from
different authors (plotted with different symbols) and GCs estimates
(open pentagons, corrected for the factor 1.08, see discussion in the text).
Under equilibrium hypothesis (Model I), the solid line is the best-fit
(
|
| Open with DEXTER | |
Model II: Here only 34 PNe (the three PNe (
![]() ,
13, 36) were excluded) are considered to be at equilibrium. Figure 4 shows the fit to the velocity dispersion estimates with the related confidence regions in parameter space. The best-fit parameter are
,
13, 36) were excluded) are considered to be at equilibrium. Figure 4 shows the fit to the velocity dispersion estimates with the related confidence regions in parameter space. The best-fit parameter are
![]() km s-1 and
km s-1 and
![]() .
In this case, we introduced a tidal radius,
.
In this case, we introduced a tidal radius,
![]() ,
where the stellar distribution
is truncated, which has improved the fit to the data. This possibly indicates the most external radius of NGC 1399, while the cluster potential dominates at larger radii. The derived mass distribution is also shown in Fig. 5: in this case we obtain
,
where the stellar distribution
is truncated, which has improved the fit to the data. This possibly indicates the most external radius of NGC 1399, while the cluster potential dominates at larger radii. The derived mass distribution is also shown in Fig. 5: in this case we obtain
![]() within 400''.
within 400''.
Despite the oversimplified approximation for the rotation curve, the above analysis provides the mass distribution needed to match the velocity dispersion profile in the two extreme rotation regimes (i.e. rigid rotation within
![]() ,
null rotation outside).
The link between the two regions calls for a more
detailed kinematics at the intermediate radii.
The mass distribution from our analysis is in perfect agreement with estimates from Saglia et al. (2000) who found
,
null rotation outside).
The link between the two regions calls for a more
detailed kinematics at the intermediate radii.
The mass distribution from our analysis is in perfect agreement with estimates from Saglia et al. (2000) who found
![]() within R=400''.
within R=400''.
| |
Figure 5:
The modeled mass distributions for
Model I (left) and Model II (right).
Dashed line is the luminous mass using Killeen & Bicknell (1988) luminosity
profile with
|
| Open with DEXTER | |
The peculiar kinematics and the temperature profile of the hot gas from the X-ray observations may suggest that NGC 1399 is not a relaxed system.
Minniti et al. (1998) and Kissler-Patig et al. (1999) use the metallicity distribution and specific density of GCs to claim evidence for a recent interaction with the nearby companion NGC 1404.
If such interaction occurred, the most spectacular effect might be the strong heating of the intergalactic gas.
The hot gas in NGC 1399 has a temperature which, once converted into a velocity dispersion, seems systematically larger by ![]() 30 km s-1 than that of the stellar population (see the long-dashed curve in Fig. 4). Moreover, the decline of the rotation curve of NGC 1399 is similar to those observed in spiral systems and reproduced by single and/or multiple galaxy encounter (Kauffmann 1999; Salo & Laurikainen 2000).
30 km s-1 than that of the stellar population (see the long-dashed curve in Fig. 4). Moreover, the decline of the rotation curve of NGC 1399 is similar to those observed in spiral systems and reproduced by single and/or multiple galaxy encounter (Kauffmann 1999; Salo & Laurikainen 2000).
| PNe projected kinematical quantities | |||
| Model III | |||
| Distance |
|
|
Procedure |
| 33 | NF(Z1) | ||
| 88 | BF(R) | ||
| 94 | NF(Z1) | ||
| 126 | BF(R) | ||
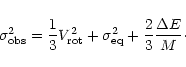
We shall then explore a model where NGC 1399 is out of equilibrium, and the stars in the outer halo are re-arranging themselves after a flyby encounter with NGC 1404. NGC 1399 and NGC 1404 have a small projected distance, b=9', and a large relative radial velocity, V=522 km s-1 (
![]() ,
Graham et al. 1998,
,
Graham et al. 1998,
![]() ,
D'Onofrio et al. 1995).
The simplest approach is to use the general scheme of the impulse approximation (Binney & Tremaine 1987), where NGC 1399 is the perturbed system and NGC 1404 is the perturber.
In this approach, the encounter does not modify the potential of the
perturbed system and the kinetic energy in the inner regions, while the outer regions (
,
D'Onofrio et al. 1995).
The simplest approach is to use the general scheme of the impulse approximation (Binney & Tremaine 1987), where NGC 1399 is the perturbed system and NGC 1404 is the perturber.
In this approach, the encounter does not modify the potential of the
perturbed system and the kinetic energy in the inner regions, while the outer regions (
![]() )
experienced
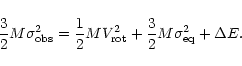
1) an energy injection, 2) the disruption of the streaming motions, i.e. of the angular momentum (Sugerman et al. 2000), both re-distributed in the random motions, and 3) no mass loss (we will discuss this assumption later). Following this scheme, the post-encounter kinetic energy of the perturbed system,
)
experienced
1) an energy injection, 2) the disruption of the streaming motions, i.e. of the angular momentum (Sugerman et al. 2000), both re-distributed in the random motions, and 3) no mass loss (we will discuss this assumption later). Following this scheme, the post-encounter kinetic energy of the perturbed system,
![]() ,
can be written as
,
can be written as
The equilibrium before the encounter -
![]() writes as
writes as
 |
(6) |
![\begin{figure}
\par\includegraphics[width=6.5cm]{h3150F12.ps}\par\includegraphics[width=6.5cm]{h3150F13.ps}\par\end{figure}](/articles/aa/full/2002/09/aah3150/img121.gif) |
Figure 6: Model III. Top panel: rotation velocities from stars (open circles) and PNe (full circles) with the modeled rotation curve from Eq. (7). Bottom panel: velocity dispersion estimates and the best-fit to the data within 140''. Symbols have the same meaning as in Fig. 4. |
| Open with DEXTER | |
![]() and
and
![]() are listed in Table 3 and shown in Fig. 6. In the left panel
are listed in Table 3 and shown in Fig. 6. In the left panel
![]() is interpolated with a flat rotation curve of the form
is interpolated with a flat rotation curve of the form![]()
![\begin{figure}
\par\includegraphics[angle=-90,width=8.8cm,clip]{h3150F14.ps}\end{figure}](/articles/aa/full/2002/09/aah3150/img126.gif) |
Figure 7: Model III. The total mass distribution (heavier solid line) for Model III is compared with mass distributions from Model I (short-dashed line) and II (dotted line). Heavier long-dashed line and dot-dashed have the same meaning than as in Fig. 5. The contribution of the dark halo becomes important for R > 60'' in all models. |
| Open with DEXTER | |
Following Aguilar & White (1985), this is consistent with the energy change expected in similar flyby encounters analysed in their work (for our model we obtain ![]() and p=4, see r1/4 model in Figs. 2 and 4 in Aguilar & White 1985). The corresponding
and p=4, see r1/4 model in Figs. 2 and 4 in Aguilar & White 1985). The corresponding
![]() is about 4%, which is well within our M/L uncertainty: this means that our assumption of null mass loss is consistent with our model precision. Similar conclusions are found by comparing our results with Funato & Makito (1999): in this case the expected
is about 4%, which is well within our M/L uncertainty: this means that our assumption of null mass loss is consistent with our model precision. Similar conclusions are found by comparing our results with Funato & Makito (1999): in this case the expected
![]() is about 5% (for
is about 5% (for
![]() and
and
![]() for their Hernquist model, Figs. 11c) and d)).
for their Hernquist model, Figs. 11c) and d)).
Equation (8) is the most direct way to estimate the injected energy, but not the most accurate. Aguilar & White (1985) pointed out that this "distant encounter'' approximation can overestimate the real amount of energy change for a large range of impact parameters. From inspection of their Fig. 4, however, we can expect some effect for our encounter geometry: ![]() and p=4 imply an overestimate of
and p=4 imply an overestimate of ![]() 0.02 in
0.02 in
![]() .
We will consider this source of uncertainty in the following discussion about the error budget of this analysis.
.
We will consider this source of uncertainty in the following discussion about the error budget of this analysis.
In conclusion, we stress that, within the flyby encounter scenario, we have neglected possible effects of the relative nearby system, NGC 1380. This galaxy has a projected distance of 38', an equally large relative velocity, V'=452 km s-1, with respect NGC 1399 and is as bright as NGC 1404 and possibly as massive. This large projected distance, anyway, would produce a negligible ![]() in a present tangential encounter (a flyby encounter in the past cannot be excluded, as suggested by Kissler-Patig et al. 1999).
in a present tangential encounter (a flyby encounter in the past cannot be excluded, as suggested by Kissler-Patig et al. 1999).
Using the value for ![]() in the definition of the post-encounter energy,
in the definition of the post-encounter energy,
![]() we obtain
we obtain
 |
(9) |
Larger uncertainties come from our assumption on the encounter geometry. The tangential configuration is neither the most obvious, nor the most favorable: it is not difficult to envisage configurations where the relative velocity between the systems is lower than their relative velocity along the line of sight and/or their projected distance is larger than their distance at closest approach. In this latter case the amount of injected energy increases together with
![]() .
In Fig. 8,
.
In Fig. 8,
![]() from Eq. (10) is shown as a function of b and V: the contours cover the
from Eq. (10) is shown as a function of b and V: the contours cover the ![]() 1 rms range of the
1 rms range of the
![]() in the last bin, the cross is our tangential estimate,
in the last bin, the cross is our tangential estimate,
![]() ,
and the grey region is the overlap between
,
and the grey region is the overlap between ![]() 1 rms values of both
1 rms values of both
![]() and
and
![]() .
The tangential estimate should be considered as an indicative result, because a wide range of configurations can match the observed dispersion. Conclusive results can be obtained by acquiring information on the geometry of the encounter. This uncertainty can be solved with more extended surveys of PNe in the NGC 1399-NGC 1404 system which can possibly disclose the orbit of an ongoing encounter (Moore et al. 1996).
.
The tangential estimate should be considered as an indicative result, because a wide range of configurations can match the observed dispersion. Conclusive results can be obtained by acquiring information on the geometry of the encounter. This uncertainty can be solved with more extended surveys of PNe in the NGC 1399-NGC 1404 system which can possibly disclose the orbit of an ongoing encounter (Moore et al. 1996).
![\begin{figure}
\par\includegraphics[width=8.8cm,clip]{h3150F15.ps}\end{figure}](/articles/aa/full/2002/09/aah3150/img151.gif) |
Figure 8:
|
| Open with DEXTER | |
So far the discrete radial velocity fields of PNe and GCs are the only viable diagnostics to extend the dynamical studies into the outer regions of spheroidal galaxies. Furthermore PNe, being associated to the stellar population, allow us to extend the stellar kinematics out to the halo regions. Despite the small number statistics, PNe and GCs can be used efficiently for "normal'' systems, while they suffer some limitations for the "disturbed'' systems, where a more detailed kinematical information is needed. In this latter case, we can still hope to derive some indications of the actual dynamical state of their parent galaxies.
This is possibly the case of NGC 1399, the cD galaxy in the center of the Fornax cluster. Here, the re-analysis of the PNe data from Arnaboldi et al. (1994), by mean of the procedure tested in Napolitano et al. (2001), shows a peculiar rotational structure:
![]() has a peak of
has a peak of ![]() 250 km s-1 at
250 km s-1 at
![]() and then declines. At the same distance from the center, the velocity dispersion has a minimum: it decreases out to R=140'' and then increases.
This could be a kinematical signature of dynamical substructures (a truncated disk, for example) in the inner regions which is not highlighted in published photometrical studies. Anyway, the fact that GCs show the same dispersion profile as the PNe, even if they are a decoupled population (they do not rotate in the regions where they overlap with the PNe data), make this multicomponent scenario inappropriate to explain the observed "heating'' of the outer kinematics. This heating possibly calls for a different dynamical justification.
and then declines. At the same distance from the center, the velocity dispersion has a minimum: it decreases out to R=140'' and then increases.
This could be a kinematical signature of dynamical substructures (a truncated disk, for example) in the inner regions which is not highlighted in published photometrical studies. Anyway, the fact that GCs show the same dispersion profile as the PNe, even if they are a decoupled population (they do not rotate in the regions where they overlap with the PNe data), make this multicomponent scenario inappropriate to explain the observed "heating'' of the outer kinematics. This heating possibly calls for a different dynamical justification.
In a conventional way, assuming equilibrium, we derived the mass distribution of NGC 1399 accounting for the observed kinematics and found a large dark-mass content with M/L=56 (Model I) at R=400'', fully consistent with previous analyses. In a different approach, the peculiar kinematics is interpreted as the signature of an interaction situation. Such an interaction scenario has been invoked in previous work to account for the peculiarities of this system: the extended stellar envelope (Schombert 1986), the unusual overabundance of globular clusters (Kissler-Patig et al. 1999 and references therein), and their metallicity distribution (Minniti et al. 1998). The interaction scenario is also compatible with X-ray observations: Paolillo et al. (2002) have recently analysed new data from ROSAT HRI deep observations and found features (holes, filamentary, shoulders in the density profile) which are qualitatively expected in a tidal interaction scenario as shown by analytical works (D'Ercole et al. 2000) and by N-body simulations (Barnes 2000). These independent evidences of ongoing interaction make any equilibrium analyses in the outer regions of this galaxy quite uncertain: in order to be conservative, this is done, however, in Model II, where we find M/L=33 at R=400''.
Here we have presented a simplified model as an attempt to approach non-equilibrium
situations in a quantitative way. The lack of a detailed kinematics implies assumptions
on the geometry of the encounter which affect the final result and therefore the dynamical
situation of NGC 1399 requires further investigations. However, this simple dynamical
analysis gives two interesting indications: 1) the observed kinematics is coherent with
a scenario of non-equilibrium due to a galaxy-galaxy flyby
encounter; 2) by considering
non-equilibrium, the total mass content required within R=400'' is ![]() 30% less than for the equilibrium model (Model I) and implies M/L=26.
30% less than for the equilibrium model (Model I) and implies M/L=26.
Acknowledgements
The authors are grateful to the referee, Dr. E. Emsellem, and to O. Gerhard and M. Dopita for their useful comments and suggestions. N.R.N. is receiving financial support from the European Social Found.