A&A 382, 1070-1080 (2002)
DOI: 10.1051/0004-6361:20011694
A. Veronig1 - M. Temmer1 - A. Hanslmeier1 - W. Otruba2 - M. Messerotti3
1 - Institut für Geophysik, Astrophysik &
Meteorologie, Universität Graz, Universitätsplatz 5, 8010 Graz, Austria
2 - Sonnenobservatorium Kanzelhöhe, 9521 Treffen, Austria
3 - Osservatorio Astronomico di Trieste, Via
G. B. Tiepolo 11, 34131 Trieste, Italy
Received 13 September 2001 / Accepted 15 November 2001
Abstract
A statistical analysis of almost 50000 soft X-ray
(SXR) flares observed by GOES during the period 1976-2000 is presented.
On the basis of this extensive data set, statistics on
temporal properties of soft X-ray flares, such as duration, rise
and decay times with regard to the SXR flare classes is presented.
Correlations among distinct flare parameters, i.e. SXR peak flux,
fluence and characteristic times, and frequency distributions of
flare occurrence as function of the peak flux, the fluence and the
duration are derived. We discuss the results of the analysis
with respect to statistical flare models, the idea of coronal heating
by nanoflares, and elaborate on implications of the obtained results on
the Neupert effect in solar flares.
Key words: methods: statistical - sun: flares - sun: X-rays
With the availability of space-borne instrumentation, observations of solar flare phenomena in X-rays became possible in the 1960s. Disk-integrated soft X-ray emission measurements of the Sun have been collected more or less continuously since 1974 by the National Oceanic and Atmospheric Administration (NOAA), providing an almost unbroken record fully covering solar cycles 21 and 22 and the rising phase of cycle 23 (Garcia 2000).
Statistical investigations on temporal aspects of solar flares observed in various soft X-ray wavelengths have been carried out by Culhane & Phillips (1970), Drake (1971), Thomas & Teske (1971), Phillips (1972), Datlowe et al. (1974), and Pearce & Harrison (1988). In the meantime a wealth of data has accumulated, which makes worthwhile re-investigating the temporal characteristics of soft X-ray (SXR) flares on an extensive statistical basis. In the present analysis we make use of SXR flares observed by GOES during 1976-2000.
Moreover, on the basis of this comprehensive data set, we calculate frequency distributions of SXR flares as function of the peak flux, the fluence, i.e. the integrated flux from the start to the end of a flare, and the event duration. Frequency distributions of flare occurrence are related to the observational expectations from different flare models. Furthermore, they contain information about the possibility of coronal heating by nanoflares. Frequency distributions of solar flares from disk-integrated SXR measurements as function of the peak flux have been carried out by Drake (1971), Lee et al. (1995) and Feldman et al. (1997). However, only in the paper by Drake (1971) are frequency distributions of SXR fluence measurements also presented. Shimizu (1995) used spatially resolved observations from transient SXR brightenings and investigated frequency distributions as function of energy.
Soft X-ray measurements are an important counterpart to observations of flares in hard X-rays (HXR). From several observations it is reported that the SXR light curve has a similar shape as the time integral of the HXR curve. This led to the idea that there is a causal relationship between hard and soft X-ray emission of a flare, the so-called Neupert effect (Neupert 1968; Dennis & Zarro 1993). It supports a flare model, known as the thick-target model (Brown 1971), in which the HXR emission is electron-ion bremsstrahlung produced by energetic electrons as they reach the dense layers of the chromosphere. Only a small fraction of the electron beam energy is lost through radiation; most of the loss is due to Coulomb collisions, which serve to heat the ambient plasma. Due to the rapid deposition of energy by the particle beams, the energy cannot be radiated away at a sufficiently high rate and a strong pressure imbalance develops, causing the heated plasma to expand up into the corona ("chromospheric evaporation"), where this hot dense plasma gives rise to the enhanced SXR emission (e.g., Antonucci et al. 1984; Fisher et al. 1985; Antonucci et al. 1999, and references therein). In this paper we make use of the flare frequency distributions and the correlations among distinct flare parameters to infer information about the validity of the Neupert effect in solar flares by statistical means.
The paper is structured as follows. The data set is described in Sect. 2. In Sect. 3.1 a statistical investigation of temporal properties of SXR flares is presented. Correlations among various flare parameters, such as characteristic times, peak flux and fluence, are analyzed in Sect. 3.2. In Sect 3.3 frequency distributions as function of the peak flux, the fluence and the duration are derived. In Sect. 4 we give a summary and discussion of the main results. Finally, the conclusions are drawn in Sect. 5.
The present analysis is based on solar SXR flares observed by GOES in the 0.1-0.8 nm wavelength band during the period January 1976 to December 2000. We make use of the GOES flare listing in the Solar Geophysical Data (SGD), which contains almost 50000 single events for the time span considered.
Since 1974 broad-band soft X-ray emission of the Sun has been measured almost continuously by the meteorology satellites operated by NOAA: the Synchronous Meteorological Satellite (SMS) and the Geostationary Operational Environment Satellite (GOES). The first GOES was launched by NASA in 1975, and the GOES series extends to the currently operational GOES 8 and GOES 10. From 1974 to 1986 the soft X-ray records are obtained by at least one GOES-type satellite; starting with 1983, data from two co-operating GOES are generally available (Garcia 1994, 2000).
The X-ray sensor, part of the space environment monitor system aboard GOES, consists of two ion chamber detectors, which provide whole-sun X-ray fluxes in the 0.05-0.4 and 0.1-0.8 nm wavelength bands. The initial series of satellites maintained attitude control via spin-stabilization. GOES 8, launched in April 1994, and all subsequent GOES are three-axis stabilized, making it possible to observe the Sun uninterrupted by spacecraft rotations. This new operational mode facilitated an improved signal-to-background ratio and a higher time resolution, 0.5 s (prior to 1994, the time resolution was 3 seconds). Aside from the observing mode, the basic X-ray detector is unchanged with respect to the previous instrumentation (Garcia 2000). However, beginning with GOES 8, the dynamic range of the X-ray sensor was extended in order to permit the most energetic SXR events to be recorded.
Solar soft X-ray flares are classified according to their peak burst intensity
measured in the 0.1-0.8 nm wavelength band by GOES. The letters (A, B, C, M, X)
denote the order of magnitude of the peak flux on a logarithmic scale, and
the number following the letter gives the multiplicative factor, i.e.,
![]() ,
,
![]() ,
,
![]() ,
,
![]() ,
and
,
and
![]() W m-2.
In general, n is given as a float number with one decimal (prior to
1980, n is listed as an integer). No background subtraction is applied to
the data.
W m-2.
In general, n is given as a float number with one decimal (prior to
1980, n is listed as an integer). No background subtraction is applied to
the data.
In the present statistical analysis we utilize the 1-min average GOES data, as listed in the SGD. The definition of the start of a GOES X-ray event comprises the fulfillment of three conditions during four consecutive 1-min long intervals of observation: 1) all four values are above the B1 threshold; 2) all four values are strictly increasing; 3) the last value is greater than 1.4 times the value which occurred three minutes earlier. The maximum time is given by the 1-min averaged value of the SXR peak time. The end time is defined by the return of the flux to half the peak value above the pre-flare level. The temporal parameters calculated in the present analysis refer to these definitions of the start, end and maximum times of the SXR flares.
Table 1 lists the number of flares reported for
the period January 1976 to December 2000, subdivided into the
different SXR flare classes. No class A flares are listed,
since the SGD cover only SXR events ![]() B1 (see also the
definition of flare onset in Sect. 2.1). As it can be
seen from Table 1, the bulk of flares belongs
to class C (
B1 (see also the
definition of flare onset in Sect. 2.1). As it can be
seen from Table 1, the bulk of flares belongs
to class C (![]() 66%). Larger flares, i.e. M and
X, are less frequent and occur primarily during times of
maximum solar activity. Smaller flares, i.e. A and B,
actually occur more frequently than C class flares. However, during
periods of maximum activity the X-ray background is too high to
detect A and B class flares from full-disk measurements (in extreme cases
the X-ray background may even reach M-level). Thus, the distribution
of detected flares among the SXR classes with the distinct maximum at
class C results as an interaction of both these effects, i.e. the
infrequent occurrence of large flares and the restriction of
detecting small flares to periods of minimum solar activity.
The increased X-ray background during maximum solar activity may be
due to emission from many flare events as well as due to a steady coronal
heating mechanism (e.g., Feldman et al. 1997).
66%). Larger flares, i.e. M and
X, are less frequent and occur primarily during times of
maximum solar activity. Smaller flares, i.e. A and B,
actually occur more frequently than C class flares. However, during
periods of maximum activity the X-ray background is too high to
detect A and B class flares from full-disk measurements (in extreme cases
the X-ray background may even reach M-level). Thus, the distribution
of detected flares among the SXR classes with the distinct maximum at
class C results as an interaction of both these effects, i.e. the
infrequent occurrence of large flares and the restriction of
detecting small flares to periods of minimum solar activity.
The increased X-ray background during maximum solar activity may be
due to emission from many flare events as well as due to a steady coronal
heating mechanism (e.g., Feldman et al. 1997).
| Class | No. events | No. (%) |
| B | 11558 | 23.4 |
| C | 32784 | 66.4 |
| M | 4708 | 9.5 |
| X | 359 | 0.7 |
| T | 49409 | 100.0 |
The present paper investigates temporal flare parameters as well as
characteristics of the measured SXR flux. For the temporal analysis, the
reported start, maximum and end times were checked.
Moreover, due to the fact that prior to 1997 the reported SXR flare times
were taken from the H![]() event, if there was a correlated one, also those
flares were rejected from further analysis. Applying these selection criteria,
for the temporal part of the analysis the data set was reduced to a number of 26745 events, covering 8844 B,
16507 C, 1331 M and 63 X class flares. Peak flux values are basically listed
for each event and the respective analysis makes use of the overall data set as
listed in Table 1. SXR fluence data, i.e. the integrated
flux from the start to the end of an event, are available since January
1997, amounting to 8400 events.
event, if there was a correlated one, also those
flares were rejected from further analysis. Applying these selection criteria,
for the temporal part of the analysis the data set was reduced to a number of 26745 events, covering 8844 B,
16507 C, 1331 M and 63 X class flares. Peak flux values are basically listed
for each event and the respective analysis makes use of the overall data set as
listed in Table 1. SXR fluence data, i.e. the integrated
flux from the start to the end of an event, are available since January
1997, amounting to 8400 events.
We statistically analyzed temporal aspects of SXR flares, i.e. the duration, rise and decay times. The temporal parameters have been derived only from those events, which fulfilled the selection criteria given in Sect. 2.2. Figure 1 shows the distributions of the duration, rise and decay times considering the total of events. Each histogram reveals a pronounced negative skewness.
![\begin{figure}
\par\includegraphics[width=6.8cm,clip]{ms1910f1.eps} \end{figure}](/articles/aa/full/2002/06/aa1910/img10.gif) |
Figure 1: Histograms of duration, rise and decay times calculated from the total of flares passing the temporal selection criteria. The solid line indicates the median value of the distribution. The dotted line represents the 90th percentile, which indicates the abscissa range covering 90% of events. |
| Open with DEXTER | |
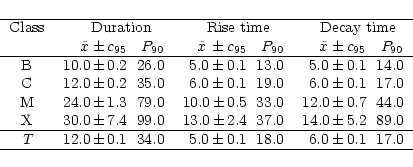
In Table 2 we list various statistical measures characterizing the distributions of the temporal parameters, the arithmetic mean, the median, the mode and the 90th percentile P90. The obtained results for the mode of the duration, 7.0 min, is in agreement with previous studies, although different definitions of the start and end time of SXR events are used. Phillips (1972) and Pearce & Harrison (1988) report a mode in the range 5-10 min. Feldman et al. (1997) obtained SXR lifetime peaks in the range 6-8 min. Drake (1971) reports higher values, 16 min, considering only flares greater than about C2.
| Stat. measure | Duration | Rise time | Decay time |
| (min) | (min) | (min) | |
| Mean | 18.2 | 9.1 | 9.1 |
| Median | 12.0 | 5.0 | 6.0 |
| Mode | 7.0 | 4.0 | 3.0 |
| P90 | 34.0 | 18.0 | 17.0 |
Figure 2 shows the distributions of the duration
separately for the different classes of SXR flares. It can
be seen that with increasing flare class the skewness of the
distributions decreases and the center of the distribution moves
to larger values. In Table 3 we list the median values
(plus confidence intervals) and the 90th percentile values of the
temporal parameters calculated for the different classes of SXR flares.
Since the relevant distributions are significantly asymmetric (see
Figs. 1 and 2), they are better represented by
the median, ![]() ,
than by the arithmetic mean.
As a measure of statistical significance we make use of the 95% confidence
interval,
,
than by the arithmetic mean.
As a measure of statistical significance we make use of the 95% confidence
interval,
![]() ,
with
,
with
![\begin{figure}
\par\includegraphics[width=6.8cm,clip]{ms1910f2.eps} \end{figure}](/articles/aa/full/2002/06/aa1910/img14.gif) |
Figure 2: Histograms of duration for the different SXR flare classes. The solid line indicates the median of the distribution, the dotted line the 90th percentile. The histograms of the B, C and M class flares are represented with a bin size of 2 min; for the X class flares it is 4 min to account for the poor statistics. |
| Open with DEXTER | |
|
Table 3 reveals that on average the characteristic times increase with the flare class. The differences from one class to the other are larger than the 95% confidence limits, indicating the statistical significance of the effect. However, due to the rather poor statistics of X class flares, the respective 95% confidence limits are somewhat larger. From Tables 2 and 3 it follows that the median values of the rise and decay times are quite similar, for the overall number of flares as well as for the different flare classes. We want to stress that this fact is in particular related to the used definition of the end time of an event, i.e. the return of the flux to half the peak value above the background level at the time of the flare onset, which obviously underestimates the decay phase. However, the actual end of an X-ray event, i.e. the return of the coronal plasma to the state before the SXR flare, is difficult to determine, since the background level may change during the flare endurance and/or the decay phase may be overlaid by other events. Therefore, definitions of the characteristic times based on the peak flux are commonly used in statistical SXR flare studies (e.g., Culhane & Phillips 1970; Drake 1971; Pearce & Harrison 1988; Lee et al. 1995).
![\begin{figure}
\par\includegraphics[width=8.8cm,height=9.8cm,clip]{ms1910f3.eps} \end{figure}](/articles/aa/full/2002/06/aa1910/img17.gif) |
Figure 3: Scatter plots of the flare duration (top panel), rise time (middle panel) and decay time (bottom panel) as function of the peak flux. The solid line represents the linear regression fit to the data. For better illustration not the whole flare sample is plotted but a number of 1500 randomly chosen events from the period 1976-2000. |
| Open with DEXTER | |
Figure 3 shows the correlation scatter plots of the characteristic times, i.e.
duration, rise and decay times, as function of the peak flux.
The cross-correlation coefficients, calculated in log-log space,
give similar values with
![]() ,
indicating a low correlation
between the characteristic times and the peak flux.
,
indicating a low correlation
between the characteristic times and the peak flux.
![\begin{figure}
\par\includegraphics[width=8.8cm,height=9.8cm,clip]{ms1910f4.eps} \end{figure}](/articles/aa/full/2002/06/aa1910/img19.gif) |
Figure 4: Scatter plots of the flare duration (top panel), rise time (middle panel) and decay time (bottom panel) as function of the fluence. The solid line represents the linear regression fit. 1500 randomly chosen events from the sample 1997-2000 are plotted. |
| Open with DEXTER | |
In Fig. 4 the scatter plots of the characteristic times as function of the fluence are shown. The cross-correlation coefficients give r=0.68 for the duration, r=0.64 for the rise times, and r=0.61 for the decay times. The outcome that the correlation between the fluence and the characteristic times is distinctly higher than those between the peak flux and the characteristic times is not unexpected, since the fluence intrinsically increases with the endurance of the event.
The top panel of Fig. 5 shows the scatter plot of the fluence versus the peak
flux. The corresponding cross-correlation coefficient, r=0.88, is higher than
that of the fluence and the duration, r=0.68. From the linear fit in log-log
space we obtain the relation
![]() with
with ![]() denoting the fluence and
denoting the fluence and ![]() the peak flux.
The bottom panel of Fig. 5 shows the scatter
plot of the fluence versus the peak flux multiplied by the flare duration,
yielding r=0.99. From this high cross-correlation coefficient it follows
that the product of the peak flux and the duration,
the peak flux.
The bottom panel of Fig. 5 shows the scatter
plot of the fluence versus the peak flux multiplied by the flare duration,
yielding r=0.99. From this high cross-correlation coefficient it follows
that the product of the peak flux and the duration,
![]() ,
is a good estimate of the fluence,
,
is a good estimate of the fluence, ![]() ,
without accounting
for the actual time profile. From the regression analysis we obtain
the relation:
,
without accounting
for the actual time profile. From the regression analysis we obtain
the relation:
![]() .
.
![\begin{figure}
\par\includegraphics[width=8.8cm,clip]{ms1910f5.eps} \end{figure}](/articles/aa/full/2002/06/aa1910/img25.gif) |
Figure 5: Scatter plots of the fluence as function of the peak flux (top panel) and as function of the peak flux times duration (bottom panel). The solid line represents the linear regression fit. 1500 randomly chosen events from the sample 1997-2000 are plotted. |
| Open with DEXTER | |
Frequency distributions have been calculated for various types
of flare-associated activity, such as radio bursts, soft X-rays, hard X-rays,
interplanetary type III bursts and interplanetary particle events
(cf. Crosby et al. 1993; Aschwanden et al. 1998; and references therein).
It has been shown that above a certain threshold (often attributed to the
sensitivity of the observations) most of these frequency distributions
can be represented by power-laws of the form
![\begin{figure}
\par\includegraphics[width=8.8cm,clip]{ms1910f6.eps} \end{figure}](/articles/aa/full/2002/06/aa1910/img30.gif) |
Figure 6: Frequency distributions as function of the peak flux (top panel), fluence (middle panel) and duration (bottom panel). The dotted line indicates the least squares fit to the data. |
| Open with DEXTER | |
![\begin{figure}
\par\includegraphics[width=8.8cm,clip]{ms1910f7.eps} \end{figure}](/articles/aa/full/2002/06/aa1910/img31.gif) |
Figure 7: Frequency distributions as function of the peak flux calculated separately for periods of minimum and maximum activity of solar cycle 22 (top panel) and solar cycle 23 (bottom panel). Frequency distributions for times of minimum activity are represented by full lines, for times of maximum activity by dashed-dotted lines. |
| Open with DEXTER | |
In Fig. 6 we show the frequency distributions for the peak flux,
the fluence and the duration. The distributions of the
peak flux and the fluence reveal power-laws over 2-3
decades. From the slopes of the distributions in log-log space we obtain
![]() for the peak flux, and
for the peak flux, and
![]() for the fluence. The frequency distribution of the event
duration can also be well represented by a power-law, with
for the fluence. The frequency distribution of the event
duration can also be well represented by a power-law, with
![]() .
.
Figure 7 illustrates the frequency distributions of the peak fluxes calculated separately for periods of minimum and maximum solar activity. The top panel shows the respective distributions of solar cycle 22 (calculated from the years 1986 and 1989), the bottom panel for the current cycle 23 (1996/2000). From the figure it can be clearly seen that during times of minimum activity the power-law behavior extends to smaller peak fluxes, since during these periods also less intense flares can be detected, evidence that the turn-over of the power-law distribution in fact is caused by the sensitivity of the observations, and the power-law is expected to extend to even smaller sizes. On the other hand, during times of maximum solar activity the power-law ranges to larger peak fluxes due to the enhanced occurrence of intense flares. However, as it can be inferred from Fig. 7, the slope of the distribution, i.e. the power-law index, does not reveal any remarkable change in the course of the solar cycle.
A few previous papers present frequency distributions as function of the
SXR peak flux and fluence, respectively.
Drake (1971) analyzed SXR flares measured in the 0.2-1.2 nm
wavelength range from Explorer 33 and 35, finding
![]() for the peak flux
distribution, and
for the peak flux
distribution, and
![]() for the fluence distribution. Lee et al.
(1995), investigating the peak fluxes of SXR flares with hard X-ray counterparts
observed by GOES in the 0.1-0.8 nm band during 1981-1989, obtained
for the fluence distribution. Lee et al.
(1995), investigating the peak fluxes of SXR flares with hard X-ray counterparts
observed by GOES in the 0.1-0.8 nm band during 1981-1989, obtained
![]() .
Additionally, they investigated peak count rates for the Ca XIX
soft X-ray line emission measured by the BCS instrument aboard SMM, finding
.
Additionally, they investigated peak count rates for the Ca XIX
soft X-ray line emission measured by the BCS instrument aboard SMM, finding
![]() .
Feldman et al. (1997) investigated GOES peak fluxes observed in the 0.1-0.8 nm
wavelength band during the period 1993-1995. By dividing the flares into domains according
to the X-ray background level, they were able to extend the power-law relationship to A1
brightness level, obtaining an average value of
.
Feldman et al. (1997) investigated GOES peak fluxes observed in the 0.1-0.8 nm
wavelength band during the period 1993-1995. By dividing the flares into domains according
to the X-ray background level, they were able to extend the power-law relationship to A1
brightness level, obtaining an average value of
![]() from a
least squares fit and
from a
least squares fit and
![]() from a non-parametric fit to the data.
from a non-parametric fit to the data.
It has to be noted that the value of ![]() obtained in the present paper for the peak
flux distribution is somewhat larger than those of the above cited papers. This difference
might be caused by the fact that we did not apply a background subtraction, as some
other authors did (e.g., Drake 1971; Feldman et al. 1997). Since the background subtraction
is relatively stronger on smaller flares than large ones, it is expected to
result in a slightly flattened frequency distribution. In the analysis of the peak
flux distributions, Drake (1971) applied a correction in order to account for the
effect that his data analysis method discriminates against small events on the basis
of the actual background level. However, no such correction was applied in the analysis
of the fluence distribution, which probably is the cause for the significantly smaller
value of the power-law index of the fluence distribution he obtained.
obtained in the present paper for the peak
flux distribution is somewhat larger than those of the above cited papers. This difference
might be caused by the fact that we did not apply a background subtraction, as some
other authors did (e.g., Drake 1971; Feldman et al. 1997). Since the background subtraction
is relatively stronger on smaller flares than large ones, it is expected to
result in a slightly flattened frequency distribution. In the analysis of the peak
flux distributions, Drake (1971) applied a correction in order to account for the
effect that his data analysis method discriminates against small events on the basis
of the actual background level. However, no such correction was applied in the analysis
of the fluence distribution, which probably is the cause for the significantly smaller
value of the power-law index of the fluence distribution he obtained.
A loose correlation was found between the characteristic times and the
flare peak fluxes,
![]() .
This outcome is also reflected in
the increasing values for the duration, rise and decay times with increasing
flare class, as listed in Table 3. The average values
of the duration (defined as the median of the distribution) give
10 min for B, 12 min for C, 24 min for M, and 30 min for X class
flares. Thus, on average the duration increases from B to X class
flares by a factor 3.
.
This outcome is also reflected in
the increasing values for the duration, rise and decay times with increasing
flare class, as listed in Table 3. The average values
of the duration (defined as the median of the distribution) give
10 min for B, 12 min for C, 24 min for M, and 30 min for X class
flares. Thus, on average the duration increases from B to X class
flares by a factor 3.
As it can be inferred from Table 3, this increase is caused
in a similar manner by the rise as well as the decay times.
This differs to what was found for H![]() flares (Temmer et al. 2001),
revealing a distinctly more pronounced increase of the decay
times than of the rise times with increasing flare importance, indicating that
the cooling phase of the H
flares (Temmer et al. 2001),
revealing a distinctly more pronounced increase of the decay
times than of the rise times with increasing flare importance, indicating that
the cooling phase of the H![]() flare is more strongly affected
by the event strength than the phase of heating-up the plasma at the
flare site. However, we cannot exclude that a similar effect
might exist in the case of the SXR flares, since the definition of the
event end time by the return of the flux to half the peak
value possibly causes a stronger underestimation of the actual decay time
of intense events than weaker ones.
flare is more strongly affected
by the event strength than the phase of heating-up the plasma at the
flare site. However, we cannot exclude that a similar effect
might exist in the case of the SXR flares, since the definition of the
event end time by the return of the flux to half the peak
value possibly causes a stronger underestimation of the actual decay time
of intense events than weaker ones.
The distributions of the peak flux, the fluence and the duration
revealed a power-law behavior over several decades, the determined power-law indices
are
![]() ,
,
![]() and
and
![]() ,
respectively. The first attempt to explain
the power-law distributions of flare-related phenomena
was done by Rosner & Vaiana (1978), who developed a model based on a stochastic
flaring probability and exponential energy build-up between successive events.
However, the correlation between the strength of a flare and
the elapsed time since the previous event, predicted by the model, is
not supported by observations (Biesecker 1994; Crosby et al. 1998; Hudson et al. 1998;
Wheatland 2000).
,
respectively. The first attempt to explain
the power-law distributions of flare-related phenomena
was done by Rosner & Vaiana (1978), who developed a model based on a stochastic
flaring probability and exponential energy build-up between successive events.
However, the correlation between the strength of a flare and
the elapsed time since the previous event, predicted by the model, is
not supported by observations (Biesecker 1994; Crosby et al. 1998; Hudson et al. 1998;
Wheatland 2000).
Lu & Hamilton (1991) were the first to propose an avalanche
model of solar flares, relating the power-law distributions
to the scale-invariant properties of a self-organized system in a critical
state. Contrary to the energy storage model, no correlation between elapsed
time and event size is expected from avalanche flare models. Moreover, since the
avalanche size distribution is insensitive to much of the microphysics, from such
a model it is also expected that the power-law distributions do not change over
the solar cycle (see, e.g., Lu & Hamilton 1991; Lu et al. 1993).
Crosby et al. (1993) and Lu et al. (1993) reported such invariance of ![]() in the course of the solar cycle for the occurrence of hard X-ray flares.
In the present analysis we calculated peak flux distributions separately
from periods of minimum and maximum solar activity (see Fig. 7), which
confirms the invariance of
in the course of the solar cycle for the occurrence of hard X-ray flares.
In the present analysis we calculated peak flux distributions separately
from periods of minimum and maximum solar activity (see Fig. 7), which
confirms the invariance of ![]() also for SXR flares. This outcome is similar to the
finding of Feldman et al. (1997) that the power-law index of the peak flux
distributions of SXR flares is insensitive to the actual SXR background level,
which is closely related to the solar cycle (e.g., Wilson 1993).
also for SXR flares. This outcome is similar to the
finding of Feldman et al. (1997) that the power-law index of the peak flux
distributions of SXR flares is insensitive to the actual SXR background level,
which is closely related to the solar cycle (e.g., Wilson 1993).
Significant correlations among the characteristic times and the fluence,
![]() ,
were found. (Note that all cross-correlations
were calculated in log-log space.) The correlation analysis of the
fluence,
,
were found. (Note that all cross-correlations
were calculated in log-log space.) The correlation analysis of the
fluence, ![]() ,
and the peak flux,
,
and the peak flux, ![]() ,
revealed a high
cross-correlation coefficient, r = 0.88. From the regression analysis it
follows
,
revealed a high
cross-correlation coefficient, r = 0.88. From the regression analysis it
follows
![]() .
It is also shown that
it is justified to estimate the fluence of an event by the product of the
peak flux and the duration, since the respective
cross-correlation coefficient amounts to r=0.99,
whereas
.
It is also shown that
it is justified to estimate the fluence of an event by the product of the
peak flux and the duration, since the respective
cross-correlation coefficient amounts to r=0.99,
whereas
![]() .
.
The obtained power-law index of the peak flux distribution,
![]() ,
is similar to that of the fluence distribution,
,
is similar to that of the fluence distribution,
![]() .
Assuming that
on average the fluence
.
Assuming that
on average the fluence ![]() of an event corresponds to its peak flux
of an event corresponds to its peak flux ![]() ,
which
can be justified by the high correlation among these parameters, then
,
which
can be justified by the high correlation among these parameters, then
![]() ,
where both quantities can be represented by power-law
functions with power-law index
,
where both quantities can be represented by power-law
functions with power-law index
![]() and
and
![]() ,
respectively.
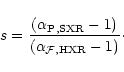
On the other hand, from the scatter plot (Fig. 5, top panel) we find that
,
respectively.
On the other hand, from the scatter plot (Fig. 5, top panel) we find that ![]() versus
versus
![]() is well fitted by the relation
is well fitted by the relation
![]() with s=1.10. Thus we obtain (cf. Lu et al. 1993):
with s=1.10. Thus we obtain (cf. Lu et al. 1993):
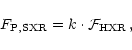
Several observations revealed that the shape of the SXR light curve closely matches the time integral of the HXR emission. It has been argued that this observation is evidence for a causal relationship between the nonthermal hard X-ray emission and the thermal soft X-ray emission, the so-called Neupert effect (Neupert 1968; Dennis & Zarro 1993). The underlying idea is that the hard X-rays come from accelerated electrons impinging on coronal or chromospheric plasma, whereas the bulk of the energy deposited by the nonthermal electrons is converted into heating of the ambient thick-target plasma (Brown 1971). The soft X-ray emission is due to thermal bremsstrahlung from hot dense plasma that evaporated into the corona, as a consequence of the rapid energy deposition. In this case, the hard X-ray emission is proportional to the time profile of the accelerated electrons. The soft X-ray emission, which is emitted by the plasma heated by the same nonthermal electron population, is proportional to the accumulated energy deposited by the electrons up to a given time. Thus, it is expected to see the Neupert effect (see McTiernan et al. 1999).
The Neupert effect, as it is commonly stated in the literature,
can be expressed as
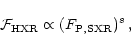
A possible explanation for this discrepancy might be that the HXR and SXR emissions
are not necessarily indicative for the energies involved. As discussed in Lee
et al. (1995),
the Neupert effect should exist not necessarily between the X-ray emissions but between
the energies. Namely the energy deposited by the nonthermal electrons,
![]() ,
should be equal to the maximum thermal energy contained in the plasma heated by
the same electrons,
,
should be equal to the maximum thermal energy contained in the plasma heated by
the same electrons,
![]() , i.e.
, i.e.
Another possibility, of course, is that the Neupert effect is not working for the bulk of
flares but just a subset of it. Most evidence for the Neupert effect indeed has been found
for large and impulsive flares (e.g., Dennis & Zarro 1993; McTiernan 1999).
Applying the same considerations as in Sect. 4.3, whereas
On the other hand, if we assume that the Neupert effect formulated for the energies (Eq. (6)) is valid for the bulk of flares, but the SXR and HXR emissions are not directly indicative for the nonthermal and thermal energies (i.e., k may depend systematically on the flare size), then the difference of the power-law indices of the HXR fluence and the SXR peak flux distributions can be considered to contain information on k as function of the flare size. Since s > 1, and comparing Eqs. (5) and (7), k is expected to decrease with increasing HXR fluence or increasing SXR peak flux, respectively. In that case, the functional dependency of k on the flare size gives an indication that the amount of SXR emission per HXR electron is smaller for large flares than for small ones. However, in the present study we cannot decide on these different possibilities.
The actual value of the power-law index ![]() determined from
various flare-related phenomena is in particular of interest with respect to
the idea of heating the corona by numerous small magnetic
reconnection events extending below the observational limit, so-called
nanoflares (Parker 1988). Hudson (1991) calculated that if the total power needed to heat
the corona is generated by flare-like events of different sizes, then the
total power is equal to the integral of event energies times their
frequency of occurrence. Assuming that the frequency of events as function of
the event energy follows a power-law of the form given in
Eq. (2) and that the energies of the largest events are much larger than
those of the smallest ones, Hudson (1991) has shown that if
determined from
various flare-related phenomena is in particular of interest with respect to
the idea of heating the corona by numerous small magnetic
reconnection events extending below the observational limit, so-called
nanoflares (Parker 1988). Hudson (1991) calculated that if the total power needed to heat
the corona is generated by flare-like events of different sizes, then the
total power is equal to the integral of event energies times their
frequency of occurrence. Assuming that the frequency of events as function of
the event energy follows a power-law of the form given in
Eq. (2) and that the energies of the largest events are much larger than
those of the smallest ones, Hudson (1991) has shown that if
![]() ,
large
events dominate the total power in the distribution and nanoflares cannot
contribute much to it. Otherwise, if
,
large
events dominate the total power in the distribution and nanoflares cannot
contribute much to it. Otherwise, if
![]() ,
the more
numerous small-scale events dominate and may provide a significant contribution
to coronal heating.
,
the more
numerous small-scale events dominate and may provide a significant contribution
to coronal heating.
However, the flare energy is not an observable quantity, and the investigations of
flare frequency distributions most often rely on peak flux or peak count rate measurements.
In a few papers though, the observed quantities have been transformed into
flare energies, and frequency distributions as function of energy
have been determined (see also Benz & Krucker 2001).
Krucker & Benz (1998) and Parnell & Jupp (2000)
analyzed energy distributions of events from quiet Sun regions, so-called
network flares (Krucker et al. 1997), observed in Extreme Ultraviolet
emission, finding ![]() in the range 2.3-2.6 and 2.1-2.6, respectively.
Such outcome suggests that the events at the low energy range dominate the
total power in the distribution. However, using data from the Soft X-ray
Telescope aboard Yohkoh, Shimizu (1995) studied transient brightenings
discovered in solar active regions, obtaining frequency distributions
as function of energy with
in the range 2.3-2.6 and 2.1-2.6, respectively.
Such outcome suggests that the events at the low energy range dominate the
total power in the distribution. However, using data from the Soft X-ray
Telescope aboard Yohkoh, Shimizu (1995) studied transient brightenings
discovered in solar active regions, obtaining frequency distributions
as function of energy with ![]() in the range 1.5-1.6. He estimated
that the energy provided by small events is at most 20% of the total energy
required to heat the active region corona. Crosby et al. (1993) analyzed
frequency distributions of HXR flares. Assuming a thick-target model, they
calculated the total energy in electrons and obtained from the distribution
in the range 1.5-1.6. He estimated
that the energy provided by small events is at most 20% of the total energy
required to heat the active region corona. Crosby et al. (1993) analyzed
frequency distributions of HXR flares. Assuming a thick-target model, they
calculated the total energy in electrons and obtained from the distribution
![]() .
.
In general, one has to be cautious in relating the frequency distributions
of observed quantities to those of flare energies, as the energy available from
flares in detail depends on their number, emission measure and temperature
(e.g., Feldman et al. 1997). Hudson (1991) made use of empirical conversion
formulae to obtain the frequency distributions of the total (radiated) flare
energy from observed peak flux measurements in various wavelengths. The
assumed proportionalities, which ensure a one-to-one correspondence
of the respective power-law indices, are criticized, e.g., by Feldman et
al. (1997). However, the fluence is a better representation of the total
energy available in flares than peak flux measurements. Under the
assumption that the fluence is proportional to the total radiated
flare energy (e.g. Krucker & Benz 1998), the found power-law index
of the fluence distribution,
![]() ,
is also representative
of the energy distribution.
,
is also representative
of the energy distribution.
Since the determined power-law index relevant to coronal heating,
![]() ,
is very close to the critical
value of 2, we investigated the influence of the background subtraction
on the fluence distribution, using the SXR flux just before the onset of the
flare. For the analysis we integrated this background level
over the event duration and subtracted it from the given fluence data
for the subsample January 1997 - July 1999. As expected, from the distribution
of the background subtracted fluence data we obtain a somewhat smaller
power-law index,
,
is very close to the critical
value of 2, we investigated the influence of the background subtraction
on the fluence distribution, using the SXR flux just before the onset of the
flare. For the analysis we integrated this background level
over the event duration and subtracted it from the given fluence data
for the subsample January 1997 - July 1999. As expected, from the distribution
of the background subtracted fluence data we obtain a somewhat smaller
power-law index,
![]() .
However, within the given
error limits this value is still rather close to 2. Moreover, it has to be noted
that the derived power law index is still distinctly larger than
those obtained by Drake (1971), with
.
However, within the given
error limits this value is still rather close to 2. Moreover, it has to be noted
that the derived power law index is still distinctly larger than
those obtained by Drake (1971), with
![]() ,
which
is the only other paper dealing with fluence distributions of SXR flares.
,
which
is the only other paper dealing with fluence distributions of SXR flares.
Frequency distributions of SXR flare occurrence as function of the peak flux, the fluence and the event duration have been calculated. All distributions can be described by power-law functions over several decades. The distributions, derived separately for the times of minimum and maximum solar activity do not reveal any remarkable change in the power-law index, consistent with the predictions of avalanche flare models (e.g., Lu & Hamilton 1991; Lu et al. 1993).
Relating the SXR fluence measurements to the total radiated flare
energy, the determined power-law index
![]() is also representative
of the flare energy distribution. The obtained values of
is also representative
of the flare energy distribution. The obtained values of
![]() are 2.03 for the raw fluence data and 1.88 for the background subtracted fluence data.
Both values are rather close to the critical value of 2, and no distinct conclusion
can be drawn whether small-scale events provide a significant contribution to coronal
heating or not. Moreover, deviations from the assumed proportionality between
SXR fluence and flare energies would also cause deviations from the one-to-one
correspondence of the respective power-law indices. If the slope of energy
versus fluence in log-log space is less than one, then the power-law index
of the energy distribution would be smaller than those of the fluence distribution,
and vice versa.
are 2.03 for the raw fluence data and 1.88 for the background subtracted fluence data.
Both values are rather close to the critical value of 2, and no distinct conclusion
can be drawn whether small-scale events provide a significant contribution to coronal
heating or not. Moreover, deviations from the assumed proportionality between
SXR fluence and flare energies would also cause deviations from the one-to-one
correspondence of the respective power-law indices. If the slope of energy
versus fluence in log-log space is less than one, then the power-law index
of the energy distribution would be smaller than those of the fluence distribution,
and vice versa.
The power-law index of SXR peak flux distributions (see Drake 1971; Lee et al. 1995; Feldman et al. 1997; this paper) is significantly larger than those reported for HXR fluence distributions (cf. Lee et al. 1993, and references therein), statistical evidence that the Neupert effect in its commonly stated form relating the X-ray emissions (Eq. (5)) is not valid for the bulk of flares. However, this outcome does not necessarily mean that the Neupert effect does not work for the more fundamental relationship between the energies (Eq. (6)). Depending on the validity of the Neupert effect for the bulk of solar flares, the differences in the power-law indices contain information upon additional energy sources for the SXR-emitting plasma, or upon the amount of SXR emission per HXR electron as a function of the flare size. From the present analysis, based only on SXR data, we cannot distinguish between these different possibilities. Moreover, a mixing of both cases might exist, making a distinction even more difficult. Therefore, a detailed statistical analysis of related SXR and HXR flares is in preparation in order to obtain deeper insight into the Neupert effect.
Acknowledgements
The authors are very grateful to Bojan Vrsnak for the careful reading of the manuscript and his helpful comments. A. V. thanks Hana Mészárosová for the provision of a cross-check on the flare frequency distributions. The authors also would like to thank James M. McTiernan for instructive comments on the Neupert effect. A. V., M. T. and A. H. acknowledge the Austrian Fonds zur Förderung der wissenschaftlichen Forschung (FWF grant P13655-PHY) for supporting this project. M. M. acknowledges the support of the Italian Space Agency (ASI) and the Ministry for University and Research (MURST).