A&A 382, 573-582 (2002)
DOI: 10.1051/0004-6361:20011519
The molecular disk surrounding the
protostellar binary L1551 IRS5
C. V. M. Fridlund1 - P. Bergman2
- G. J. White3 - G. L. Pilbratt1
- J. A. Tauber1
1 - ESA Astrophysics Mission Division, Research and Scientific
Support Department,
ESTEC, PO Box 299, 2200 AG Noordwijk, The Netherlands
2 - Centre for Astrophysics and Space Science at Chalmers University
of Technology, Onsala Space Observatory, 439 92 Onsala, Sweden
3 - Unit for Space Sciences and Astronomy, Physics Department, University of
Kent, Canterbury CT2 7NR, UK
Received 24 July 2001 / Accepted 23 October 2001
Abstract
The inner three arcminutes surrounding the Class 0/1 binary
protostar L1551 IRS5 have been observed using the
 transitions of the
HCO+, H13CO+, 12CO and 13CO molecular species. Since the line
core of HCO+ is self reversed over a substantial part of our map,
observations of isotopomers such as H13CO+ are required in order to
estimate the mass
of the molecular gas in the immediate vicinity
of IRS5. Our observations demonstrate the presence of
a large (
transitions of the
HCO+, H13CO+, 12CO and 13CO molecular species. Since the line
core of HCO+ is self reversed over a substantial part of our map,
observations of isotopomers such as H13CO+ are required in order to
estimate the mass
of the molecular gas in the immediate vicinity
of IRS5. Our observations demonstrate the presence of
a large ( 7000 AU radius) dense, possibly rotating, molecular disk
with a mass of a few
7000 AU radius) dense, possibly rotating, molecular disk
with a mass of a few  oriented
perpendicular to the major axis of an extended molecular outflow. The disk
is surrounded by an envelope with a radius of 10000 AU that
contains two massive (each 1 )
clumps. One
of these features appears to be kinematically disconnected from both the disk
and the molecular outflow.
oriented
perpendicular to the major axis of an extended molecular outflow. The disk
is surrounded by an envelope with a radius of 10000 AU that
contains two massive (each 1 )
clumps. One
of these features appears to be kinematically disconnected from both the disk
and the molecular outflow.
Key words: ISM: clouds - ISM: individual objects: L1551 - ISM: jets and
outflows - stars: formation - stars: pre-main sequence - radio lines: ISM
Among bipolar molecular outflows, the one centered on the young
stellar object IRS5 in L1551 was the
first discovered (Snell et al. 1980). It is nearby - 140 pc (Reipurth 1999) -
allowing the study of small
spatial elements, and oriented with its major outflow axis at a
small angle (15 -20,
Liseau & Sandell 1986; Moneti et al. 1988;
Rainey et al. 1987) with respect to the plane of the sky. This results in
red- and blue-shifted outflow lobes which are spatially well separated on the
sky. In combination with the recognition that bipolar molecular
outflows play a central role in the star formation process, L1551 has been
well studied over the last 20 years
(see e.g. Fridlund et al. 1997 for a review).
L1551 IRS5 has been classified as a low mass object (Fridlund et al. 1980), and
shown to be double (Rodriguez et al. 1986; Bieging & Cohen
1985; Looney et al. 1997; Fridlund & Liseau
1998; Rodriguez et al. 1998).
The two embedded protostellar objects are separated by 45 AU
(0
-20,
Liseau & Sandell 1986; Moneti et al. 1988;
Rainey et al. 1987) with respect to the plane of the sky. This results in
red- and blue-shifted outflow lobes which are spatially well separated on the
sky. In combination with the recognition that bipolar molecular
outflows play a central role in the star formation process, L1551 has been
well studied over the last 20 years
(see e.g. Fridlund et al. 1997 for a review).
L1551 IRS5 has been classified as a low mass object (Fridlund et al. 1980), and
shown to be double (Rodriguez et al. 1986; Bieging & Cohen
1985; Looney et al. 1997; Fridlund & Liseau
1998; Rodriguez et al. 1998).
The two embedded protostellar objects are separated by 45 AU
(0
 3), and obscured
by up to AV
150 mag (e.g. Stocke et al. 1988;
Smith et al. 1987; White et al.
2000).
The structure responsible for this visual extinction is most likely in the
form of a dense
dust and gas disk, as indicated by a number of studies (summarised in
Table 1).
3), and obscured
by up to AV
150 mag (e.g. Stocke et al. 1988;
Smith et al. 1987; White et al.
2000).
The structure responsible for this visual extinction is most likely in the
form of a dense
dust and gas disk, as indicated by a number of studies (summarised in
Table 1).
The aperture synthesis observations of Sargent et al. (1988) in
C18O, and the continuum (Woody et al. 1989) revealed a disk-like envelope,
with an extension of roughly 700 AU, and a mass of 0.1 .
Observing the continuum, Keene & Masson (1990) reported a very dense object with a
radius of 45 AU and a mass of 0.6
centered on L1551 IRS5. This
condensed object
appeared to be surrounded by an envelope with a radius of 1600 AU and
an estimated mass of 2 -3 .
A larger flattened structure with
a diameter of 4000 AU and a total mass of 0.3
has been
detected in interferometric observations in H13CO+ (Saito et al.
1996).
These authors find evidence for mass
infall. A large molecular disk had previously been inferred from single
dish observations of CS (Kaifu et al. 1984), albeit with a higher mass in the range
of 1-5
depending on the assumed geometry. The latter authors
also suggested that the disk
was rotating. Fridlund (1987) and Fridlund et al. (1989)
suggested that a possible interpretation of their 13CO observations was
that a large (5000-10000 AU) disk is rotating around IRS5.
Mizuno et al. (1994) surveyed 15 protostellar cores,
using H13CO+. For L1551 they arrive - under the assumption of a spherical,
dynamically relaxed distribution - at a virial mass of 4.2 .
Hogerheijde et al. (1997, 1998) have carried out
mapping observations in a number of transitions (including HCO+ and
H13CO+) of
several young embedded objects including L1551. A disk mass (within
radius 2800 AU) of 0.1-0.3
and a mass loss of
 yr-1 (both lobes) is indicated. Finally,
Momose et al. (1998) used aperture synthesis observations of C18O
to
derive a mass of 0.062
for a
yr-1 (both lobes) is indicated. Finally,
Momose et al. (1998) used aperture synthesis observations of C18O
to
derive a mass of 0.062
for a
 AU central
condensation.
AU central
condensation.
The inner region (r  15
15
 equals 2000 AU)
have been observed with very high signal to noise in
the 12CO 13CO & HCO+
molecular
transitions (Fridlund & Knee 1993). Their main result was - after concluding that
the HCO+ emission is optically thin in the line wings - that the mass
loss rate
is
equals 2000 AU)
have been observed with very high signal to noise in
the 12CO 13CO & HCO+
molecular
transitions (Fridlund & Knee 1993). Their main result was - after concluding that
the HCO+ emission is optically thin in the line wings - that the mass
loss rate
is 

 yr-1.
This value of is consistent with that found
from the average properties of the complete outflow indicating
that the "current''
is representative for the whole
dynamical life time of the outflow (105 yrs).
yr-1.
This value of is consistent with that found
from the average properties of the complete outflow indicating
that the "current''
is representative for the whole
dynamical life time of the outflow (105 yrs).
Because of the apparent disparity of the results for the sizes and
masses of the structures surrounding L1551 IRS5, we have extended on
previous work by carrying out:
- Single-dish, high
spectral resolution, high signal/noise molecular line observations in order to
verify the presence of a (molecular) disk like structure;
- Determination of the disk properties;
- Observation of the interfaces between
this disk like structure and the surrounding envelope/outflow through
multi-species and isotopomer observations.
We observed transitions of 12CO, 13CO, HCO+ and H13CO+,
during two observing runs in March 1998 and June 2000, using the Onsala Space
Observatory (OSO) 20m telescope located at Onsala, Sweden.
Data for the observations can be found in Table 2. The SIS SSB
tuned receiver temperature was 100 K for all transitions
utilised. The signal was fed into two backends. The
multichannel filterbank backend used have
256 channels each with 250 kHz resolution. An autocorrelator backend was used
in parallel. This was configured to have 1600 channels with a channel
separation of 25 kHz.
We mainly used data obtained
with the latter, using the former as an independent check
on the quality of our observations. Atmospheric calibration was carried out
using the chopper wheel method (Kutner & Ulich 1981). The forward scattering
efficiency,
 ,
is estimated to be 0.70-0.57 at
the 86 GHz-115 GHz frequency range. During the 1998 run,
the observations were carried out under very good weather conditions resulting
in SSB temperatures on the sky (above the atmosphere) of
between 200 K and 400 K for H13CO+, HCO+ and 13CO, with
higher values of 1000 K for 12CO. In 2000 conditions
were
a little worse with system noise temperatures of 600 K. This run was
only used to expand the map of H13CO+, and the lower quality of the data had
no significant impact on our interpretation. All observations were obtained
using frequency switching, and reduced in the standard fashion (folding,
removal of low-order polynomials from the baselines and scaling with
)
resulting in spectra with a
,
is estimated to be 0.70-0.57 at
the 86 GHz-115 GHz frequency range. During the 1998 run,
the observations were carried out under very good weather conditions resulting
in SSB temperatures on the sky (above the atmosphere) of
between 200 K and 400 K for H13CO+, HCO+ and 13CO, with
higher values of 1000 K for 12CO. In 2000 conditions
were
a little worse with system noise temperatures of 600 K. This run was
only used to expand the map of H13CO+, and the lower quality of the data had
no significant impact on our interpretation. All observations were obtained
using frequency switching, and reduced in the standard fashion (folding,
removal of low-order polynomials from the baselines and scaling with
)
resulting in spectra with a
 temperature scale. All data have been
reduced using
the XS-package written by P. Bergman. Maps around the position of IRS5 were
made according to Table 2. All offset positions in this
paper are with respect to the IRS5 position.
temperature scale. All data have been
reduced using
the XS-package written by P. Bergman. Maps around the position of IRS5 were
made according to Table 2. All offset positions in this
paper are with respect to the IRS5 position.
In Fig. 1 our H13CO+ spectra are displayed superposed on top
of the corresponding HCO+ spectra. A
visual inspection of the data show a doubled peaked structure of the
HCO+ lines. This observation, as well as the
line ratios of
HCO+ and H13CO+, shows that the former is optically
thick in the line core and suggests that the observed dip is a self reversal
effect, in agreement with the results of Hogerheijde et al. (1997). There is also a third
peak or strong extended wing
emission in
some of the HCO+ spectra which we identify with the outflow signature of
L1551 IRS5.
In addition we also note the more puzzling presence of
red-shifted material to the west of IRS5 where we find the blue-shifted wing
(outflow) emission. There is also blue
wing emission on the east side of IRS5, where the outflow component is
present as red-shifted wing emission. This effect is also visible in the other
molecular
species studied by us (see e.g. Fig. 4). In
Sect. 4.3 we comment on possible interpretations of this effect.
![\begin{figure}
\par\includegraphics[angle=270,width=18cm,clip]{h3036F1.eps} \end{figure}](/articles/aa/full/2002/05/aah3036/Timg22.gif) |
Figure 1:
Superposition of H13CO+ and HCO+ spectra. The
HCO+ spectra are displayed in red. Note the outflow
signatures (the "third peak'') towards the East (left,
red-shifted wing emission) and West (right,
blue-shifted wing emission). Some of the outflow signatures
(which are only detectable in the HCO+ spectra) have been
marked by bold lines and circles. The position of the binary
class I source L1551 IRS5 is at 0
,
0
,
and the major
axis of the molecular outflow (and the optically visible jet)
towards the lower right (SW) and the upper right (NE) and have
also been marked by long bold lines. |
| Open with DEXTER |
In the top panel of Fig. 2 we display an overlay of the integrated
line temperatures of the H13CO+ for two different velocity ranges. This
shows velocity variations over the inner regions of the L1551 IRS5 region. In
this figure we can see a somewhat flattened structure with its major axis more
or less perpendicular to the outflow axis. In addition, at least two discrete
"clumps'' can also be identified at
positions of +20
,
-60
and at +60
,
+20
(see text below).
In the left bottom panel of Fig. 2a position-velocity diagram
taken along an axis in the north-south direction of the top panel of
that figure is shown. There
is clearly a velocity gradient along this direction such that "redder'' (more
positive velocities) are found towards the north. A detailed
analysis of the individual spectra reveals two emission peaks at different
velocities. The
"red'', northern, velocity peak have an offset of
(-5
,
+20
,
6.4 km s-1), while the "blue'' velocity peak
is found at offset (0
,
-15
,
+6.1 km s-1). These
peaks are found to be coincident with those found in the interferometric
observations by Saito et al. (1996). When those data are convolved with
our beam the agreement is perfect. The flattened structure can be
traced in the position-velocity diagrams of Fig. 2 for at least
100
,
thus indicating a structure larger than what can be discerned from
the
interferometric observations which were not
sensitive to structures larger than about 50
.
At this point we tentatively identify this flattened feature with a
large (radius 7000 AU) disk-like structure surrounding both of
the protostars. This is also consistent with the results
of White et al. (2000), who based their modelling work on ISO
spectroscopy of L1551 IRS5.
In the bottom right panel of Fig. 2 we display a
position-velocity diagram taken along an axis between
coordinates +30
,
-80
and -30
,
+80
,
and thus passing
through the "southern clump" noted above. A comparison between the two
bottom panels of
Fig. 2 indicate that this "southern clump" is
kinematically decoupled from the disk. This cut is along the plane of
the tentative disk-like structure, and with a velocity gradient of
 km s-1 (pc)-1 (disregarding the
"southern clump"). This result is in excellent agreement with the
early result of Kaifu et al. (1984).
From our data it appears
that the size of the disk is about 100
by
40
.
The disk structure is thus well resolved along the major
axis.
km s-1 (pc)-1 (disregarding the
"southern clump"). This result is in excellent agreement with the
early result of Kaifu et al. (1984).
From our data it appears
that the size of the disk is about 100
by
40
.
The disk structure is thus well resolved along the major
axis.
We have further analysed the
kinematic structure of the envelope by making
position-velocity cuts along different directions. This has allowed us to
infer a division between material belonging to the disk,
and material assumed to form part of the surrounding envelope.
We have produced similar diagrams at other orientations, and we find no
obvious trace of the infall signature reported by Saito et al. (1996) in our
H13CO+ data. In a similar diagram of our HCO+ data, however, the
blueshifted signature identified with infall by Saito et al. is present at a
velocity 5.5 kms-1. We note
here, however, that because of the geometry of the
situation this material could also be due to outflow material spreading along
the nearer surface of the outflow cone (see Sect. 4.3).
Inspection of Fig. 1 shows that the minimum emission (the self
reversal) in HCO+ is found at the same velocity (within errors) all
over our map. It is thus probably representative of the envelope.
In Fig. 3 our new 12CO and 13CO spectra are displayed
superposed on each other, at the same temperature scale. The signature of the
outflow lobes are clearly
visible. In Fig. 4 the spectra obtained in all
transitions for the position -20
,
+20
are displayed
superposed on each other, demonstrating the velocity range of
the outflow compared to the disk/envelope material as inferred from
the HCO+and H13CO+ spectra.
![\begin{figure}
\par\includegraphics[width=12.6cm,clip]{h3036F2.eps}\\ [4mm] \inc...
...6F3.PS}\hspace*{4mm}\includegraphics[width=5.85cm,clip]{h3036F4.PS} \end{figure}](/articles/aa/full/2002/05/aah3036/Timg24.gif) |
Figure 2:
(Top) The integrated H13CO+ line emission between 6.5 kms-1 and
7.4 kms-1 (white contours and grey scale) overlayed with the
contours for the H13CO+ emission integrated between 6.0 kms-1 and
6.5 kms-1 (red). The major axis of the molecular outflow is from the
upper left corner through the position of L1551 IRS5 (0
,
0
),
towards the lower right corner. The orientation along which the two
cuts in the bottom panels of the figure have been taken are marked in
this panel. Note the
flattened contours along a direction orthogonal to the outflow axis.
Also note the two distinct "clumps'' at positions (+20
,
-60
)
and (+60
,
+20
).
(Bottom left) Velocity Intensity plot of the H13CO+ line emission
between 5.0 kms-1 and 8.0 kms-1. Contours are in K kms-1. The orientation
is along the cut through our map in the north - south direction with
north towards the top. (Bottom right) A cut through our map from
position +30
,
-80
towards
-30
,
+80
,
and passing through the "south clump''. Again, North
is towards the top. The velocity resolution is 86 m s-1 in both
panels, and IRS5 is found at position-coordinate 85
.
See
top panel for a display of the cuts along which the
velocity-intensity plots have been made. Note the slightly
different velocity scale in the right panel. |
| Open with DEXTER |
![\begin{figure}
\par\includegraphics[angle=270,width=16cm,clip]{h3036F5.PS} \end{figure}](/articles/aa/full/2002/05/aah3036/Timg25.gif) |
Figure 3:
Superposition of the 13CO and the 12CO spectra. The 12CO
are shown in red. Note the wing emission on both sides of the central
peak at positions of RA offset 0
and progressing to the maps
limits both north and south. |
| Open with DEXTER |
![\begin{figure}
\par\includegraphics[angle=270,width=12cm,clip]{h3036F6.PS} \end{figure}](/articles/aa/full/2002/05/aah3036/Timg26.gif) |
Figure 4:
Superposition of all transitions obtained towards the position
-20
,
+20
.
The outermost controur is that of 12CO, followed
by 13CO, HCO+(in black) and innermost H13CO+. All intensities
are in units of
. |
| Open with DEXTER |
Our H13CO+ data can be used to calculate the physical
properties of the molecular gas
close to L1551 IRS5. The results in Sect. 3 indicate that the
H13CO+ emission is
optically thin. From Goldsmith et al. (1992) we may then write
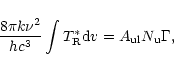 |
(1) |
where the integral represents the antenna temperature of the line in question,
corrected for atmospheric losses and coupling efficiency and integrated
over velocity.
 is the Einstein coefficient for spontaneous
emission and
is the Einstein coefficient for spontaneous
emission and
 is a correction
factor.
depends on the
excitation temperature,
is a correction
factor.
depends on the
excitation temperature,
 ,
which relates the populations in the upper
and lower levels of the transition and is given by
,
which relates the populations in the upper
and lower levels of the transition and is given by
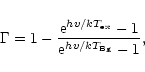 |
(2) |
and is of order 1 for
6 K (
 is the temperature
of the cosmic background radiation, 2.73 K). The upper level column
density,
is the temperature
of the cosmic background radiation, 2.73 K). The upper level column
density,  ,
is
related to the total column density, N, through
,
is
related to the total column density, N, through
 |
(3) |
where  is the fraction of the total number of molecules that are
found in the upper level of the transition. Assuming a common excitation
temperature for the lower 9 levels of the H13CO+ molecule, we can
derive
from the partition function (keeping in mind that
this is only true under conditions of LTE, and otherwise likely to
overestimate the value of the partition function. Note that an
overestimation leads to an increased mass)
is the fraction of the total number of molecules that are
found in the upper level of the transition. Assuming a common excitation
temperature for the lower 9 levels of the H13CO+ molecule, we can
derive
from the partition function (keeping in mind that
this is only true under conditions of LTE, and otherwise likely to
overestimate the value of the partition function. Note that an
overestimation leads to an increased mass)
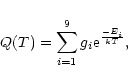 |
(4) |
where gi is the statistical weight for the ith level. This will give
us the upper level fraction for the 1-0 transition through
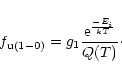 |
(5) |
In order to apply this formalism to our result, we also have to assume
a temperature structure through the disk and envelope surrounding the
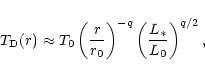
IRS5 binary. Following Emerson (1988), and Terebey et al. (1993), we may
write:
 |
(6) |
for the dust temperature
 as a function of distance from the
protostar. (We are implicitly assuming that the dust is optically thin
with respect to the infrared radiation, and that the dust and the molecular
gas is in equlibrium.) Here
as a function of distance from the
protostar. (We are implicitly assuming that the dust is optically thin
with respect to the infrared radiation, and that the dust and the molecular
gas is in equlibrium.) Here
 and depends
on the actual dust properties;
and depends
on the actual dust properties;  is the
emissivity, generally assumed to be between 1 and 2.
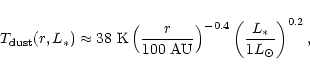
We then have:
is the
emissivity, generally assumed to be between 1 and 2.
We then have:
 |
(7) |
with L* equal to 28  (see Motte & André 2001) for the IRS5 binary.
Using this simple 2-dimensional temperature model we have calculated the
mass of the molecular envelope surrounding L1551 IRS5. The result
is 4.4
of
molecular material, assuming that the abundance ratio
[H13CO+]/[H2] is
 (Butner et al. 1995).
The accuracy of this result depends on how sensitive the solution is
with respect to the assumptions we made. Under the given assumptions,
0.15
0.5. It is
however, only for temperatures 20 K that significant
deviations of will occur and only
the innermost portion of our central beam (r 10
)
will be
important in this respect. The solution for the column density is then
relatively insensitive to the hypothesis of a constant excitation
temperature along each line of sight (the third dimension). Assumning a
constant
10 K in the complete envelope and disk lowers the
total mass with only 20%. Our mass estimate is sensitive, however, to
the
assumed abundance of H13CO+, as well as to the actual value of the dipole
moment. Following Butner et al. (1995) we have assumed a dipole moment of
4.07 Debye noting that using the lower `standard' value of 3.3 Debye
(Pickett et al. 1998) will increase the mass estimate with
50%. For the value of
the abundance X[H13CO+] Hogerheijde et al. (1997) have found about
(Butner et al. 1995).
The accuracy of this result depends on how sensitive the solution is
with respect to the assumptions we made. Under the given assumptions,
0.15
0.5. It is
however, only for temperatures 20 K that significant
deviations of will occur and only
the innermost portion of our central beam (r 10
)
will be
important in this respect. The solution for the column density is then
relatively insensitive to the hypothesis of a constant excitation
temperature along each line of sight (the third dimension). Assumning a
constant
10 K in the complete envelope and disk lowers the
total mass with only 20%. Our mass estimate is sensitive, however, to
the
assumed abundance of H13CO+, as well as to the actual value of the dipole
moment. Following Butner et al. (1995) we have assumed a dipole moment of
4.07 Debye noting that using the lower `standard' value of 3.3 Debye
(Pickett et al. 1998) will increase the mass estimate with
50%. For the value of
the abundance X[H13CO+] Hogerheijde et al. (1997) have found about
 for a sample of
dense cores in Taurus. Pratap et al. (1997) find similar values. On the other
hand, Butner et al. (1995) determine
for L1551 itself, and about
for a sample of
dense cores in Taurus. Pratap et al. (1997) find similar values. On the other
hand, Butner et al. (1995) determine
for L1551 itself, and about
 for a number of similar sources.
If we disregard
the kinematically decoupled material (i.e. the clump mentioned in
Sect. 3), as well as the clump found within the ``red'' outflow lobe
(see Fig. 2), we can arrive at a
tentative disk mass. We find that the
disk contain (
 )
of molecular material (with the
higher value representing the lowest values of X[H13CO+]) and the
dipole moment, while the two clumps contain (
)
of molecular material (with the
higher value representing the lowest values of X[H13CO+]) and the
dipole moment, while the two clumps contain (
 )
and
(
)
and
(
 )
respectively.
These results are in good agreement with the original
suggestions by Kaifu et al. (1984), which were based on single dish CS observations.
)
respectively.
These results are in good agreement with the original
suggestions by Kaifu et al. (1984), which were based on single dish CS observations.
We have also calculated the radiative transfer of HCO+ and H13CO+
of a model approximating the region surrounding L1551 IRS5. The
solution is reached by means of accelerated lambda iteration
(e.g. Rybicki & Hummer 1991) for a spherical core-envelope model, assuming the
following
parameters:
- Core radius = 5000 AU;
- Envelope radius = 12500 AU;
- Constant abundances are kept for both HCO+ and H13CO+
throughout the model;
- The turbulent velocity
 ,
of 0.45 kms-1 is set to
match the observed FWHM of the H13CO+ line (0.8 kms-1);
,
of 0.45 kms-1 is set to
match the observed FWHM of the H13CO+ line (0.8 kms-1);
- The spectra have been calculated
for beam sizes 44
(H13CO+) and 43
(HCO+) with unity beam
filling factor.
The resulting model is summarised in Table 3. While our model is a
simplification (e.g. simplified geometry, beam filling
of one, constant abundances), it should at least provide qualitative
agreement. Note that
 (in the core) could be somewhat higher if the
source is clumpy. For a beam filling factor of 2/3,
could
be set to 15 K in the core (and 10 K in the envelope) without
affecting the line shapes too much. The H2 density in the envelope is
- on the other hand - quite critical. It must be
(in the core) could be somewhat higher if the
source is clumpy. For a beam filling factor of 2/3,
could
be set to 15 K in the core (and 10 K in the envelope) without
affecting the line shapes too much. The H2 density in the envelope is
- on the other hand - quite critical. It must be
 cm-3
n[H2]
cm-3
n[H2]
 cm-3 if the
self-absorption is to be as strong as is actually observed. A sample
of the calculated model spectra are displayed in Fig. 5. The model
is indeed in good agreement with the observations both qualitatively and
quantitatively given the
uncertainties.
cm-3 if the
self-absorption is to be as strong as is actually observed. A sample
of the calculated model spectra are displayed in Fig. 5. The model
is indeed in good agreement with the observations both qualitatively and
quantitatively given the
uncertainties.
![\begin{figure}
\par\includegraphics[angle=270,width=8.8cm,clip]{h3036F7.PS} \end{figure}](/articles/aa/full/2002/05/aah3036/Timg57.gif) |
Figure 5:
Representative calculated model spectrum for HCO+ (outer
spectrum) and H13CO+ (inner spectrum). The position is the one of
L1551 IRS5 (0
,
0
). All intensities are in units of
. |
| Open with DEXTER |
The molecular gas observed in the vicinity of L1551 IRS5 thus appears to
consist of four components:
- 1.
- An elongated dense structure - best
traced in H13CO+;
- 2.
- An envelope - outlined by the self-reversed HCO+;
- 3.
- Wing emission in the central part of the
HCO+ profile - including the so called anomalous emission (see
Sect. 4.3;
- 4.
- The outflow - seen in HCO+, 12CO and 13CO, at higher
relative velocities (see e.g. Fig. 4).
One explanation for the flattened
structure seen in the H13CO+ and HCO+ data, taking also the associated
velocity gradient into account, is a rotating dense molecular disk.
Two optical jets have been identified by Fridlund & Liseau (1998) to be emanating
from behind the obscuration of IRS5. These authors find it likely that each of
the stellar components is the source of one of these jets (for reasons of
morphology and from the velocity field of the jets). The
major axis of these two jets are in the same general direction, which is also
that of the major axis of the molecular outflow. The symmetry axis of the jets
also roughly define what the orientation of
the accretion disk plane will be for both stellar components
(approximately orthogonal to the major axis of the jets). This is also the
major axis of the flattened structure. We thus conclude that a likely
explanation for the structure observed by us in HCO+ and H13CO+ is a
massive (1-4 )
molecular disk rotating around the
protostellar binary L1551 IRS5. This disk, with a size scale of
7000 AU, is thus likely to be both rotationally and
magnetically supported. It is important in this context to understand
that structures at these scales will have different
properties from the much smaller (<100 AU-1000 AU)
structures that are directly accreting onto the protostar(s), and that
therefore the term "disk'' will have to be used with this in mind.
With our data, we can make an improved
determination of the outflow mass and energetics in the inner two
arcminutes of
the molecular outflow. The line intensity wing ratio I(13CO)/I(12CO)
is much less than what would be expected if both
lines where optically thin in the wing (see e.g. Fig. 4). We
therefore assume that at least 12CO is optically thick. If we ignore
the 2.7 K background radiation we have:
![\begin{displaymath}\frac{T_{\rm R}^*(\nu)}{b_{\rm f}} = \left[\frac{h\nu/k}{{\rm...
.../kT_{\rm ex}}-1}\right]
\left(1 - {\rm e^{-\tau_\nu}}\right).
\end{displaymath}](/articles/aa/full/2002/05/aah3036/img58.gif) |
(8) |
Assuming the same
as in the model described in the previous
subsection, we can calculate the molecular outflow mass. This will be
a minimum mass because of the beam filling factor,  ,
which
is set equal to unity in these calculations. We
determine a value of 0.4
at velocities between +3 kms-1 and +6 kms-1, while
between +7 kms-1 and +10 kms-1 we obtain 0.5 .
Completing the same
exercise for HCO+ we arrive at 0.15
in each velocity interval.
Taking the inclination into account, this translates to a mass loss
of
10-5 yr-1-
,
which
is set equal to unity in these calculations. We
determine a value of 0.4
at velocities between +3 kms-1 and +6 kms-1, while
between +7 kms-1 and +10 kms-1 we obtain 0.5 .
Completing the same
exercise for HCO+ we arrive at 0.15
in each velocity interval.
Taking the inclination into account, this translates to a mass loss
of
10-5 yr-1-
 yr-1. These
values are in good agreement with the results of Fridlund & Knee (1993) and
Hogerheijde et al. (1998).
yr-1. These
values are in good agreement with the results of Fridlund & Knee (1993) and
Hogerheijde et al. (1998).
4.3 Infall or outflow? - the anomalous ``red'' and ``blue''
emission signatures
As mentioned previously, there is a significant amount of wing emission found
on the "wrong'' side of the line core in several transitions. This has been
commented on by several authors - using both single dish and interferometric
observations (see below).
![\begin{figure}
\par\includegraphics[angle=270,width=10.1cm,clip]{h3036F8.PS} \end{figure}](/articles/aa/full/2002/05/aah3036/Timg61.gif) |
Figure 6:
The anomalous wing emission demonstrated in 13CO and
HCO+. The data in this figure is from the position offset
0
, -60
. |
| Open with DEXTER |
The available data suggest two possibilities:
- 1.
- It is assumed that the major axis of the outflow in L1551 is oriented
at a small angle with respect to the plane of the sky (Liseau & Sandell 1986), and
that the outflow has the shape of bipolar cones of swept-up shells of
molecular gas (Fridlund et al. 1989) - the cones also being filled with some
molecular gas.
As we view the outflow essentially from the side, the anomalous wings could
then be caused by emission emanating from the
far side of the outflow cone (relative to the major part of the gas on
either side of L1551 IRS5) and due to the geometry of the
situation (with the outflow axis emerging out of the plane of the sky
at a relatively shallow angle), thus receeding from or approaching the Earth
(Fridlund et al. 1989).
- 2.
- These anomalous signatures could be due to infall of
molecular gas towards the surface of the disk-like structure as has
been suggested by Saito et al. (1996), Ohashi et al. (1996) and Momose et al. (1998).
We favour the first of these options for the following reasons:
Originally, Kaifu (1987) and Uchida et al. (1987) interpreted this effect as
signs
of rotation in the outflow lobes, such as predicted by the Uchida-Shibata
theory (Uchida & Shibata 1984). A similar effect was also reported by Liljeström (1989).
Fridlund (1987) and Fridlund et al. (1989) noted that since this behaviour is present
all across the extent of the outflow (more than 105 AU), it is not likely
that
it is due to infall. Further, referring to Fig. 6 we see that the
anomalous wing emission tend to be stronger in HCO+ than in
13CO.
This is the case in general over our map, and indicates that the gas
responsible for the anomalous wing tends to be very dense. This is exactly
what would be expected if we were observing a dense swept up shell from the
side.
- 1.
- The HCO+ gas detected in the close vicinity of
IRS5, is found in our observations to possess an optically thick core
with a self-reversal in the line core over much of our map. The
strength of the self-reversal is at a maximum along a line roughly
orthogonal to the major axis of the molecular outflow. We interpret
this as defining the disk plane.
- 2.
- The H13CO+ line profile is roughly gaussian with a slight
assymetry that appears as a velocity gradient
of
km s-1 (pc)-1. The line peak
is found close to the velocity of the self reversal seen in the
HCO+ transition. Our data indicate that H13CO+ is optically thin, or
nearly so, and we use it to calculate the mass of the disk and its
associated envelope.
- 3.
- The mass of the molecular envelope and
disk is found, from H13CO+, to be (
) ,
strongly
supporting the original interpretation of Kaifu et al. (1984) CS observations.
- 4.
- Two isolated clumps with masses 0.5 -1
are found in the vicinity of L1551 IRS5. They both appear
kinematically unconnected to the disk/envelope structure, and in one case is
(for morphological reasons) believed not connected with the outflow either.
- 5.
- The
line wings of 13CO and HCO+ are optically thin and we use this
to calculate the outflow mass in the two transitions. We find a value of
0.9
for 13CO and 0.3
for HCO+. This is the sum
of the molecular gas in both the red- and the blue-shifted gas.
- 6.
- The outflow mass loss rate determined from our data is found to be
10-5 yr-1-
yr-1, confirming
the result of Fridlund & Knee (1993) that L1551 IRS5 has a high rate of
outflow.
- 7.
- The anomalous wing emission found near IRS5 is interpreted as being due
to emission emanating from the far side of the outflow lobes and not
likely to be caused by infall.
Acknowledgements
We are grateful to the staff at Onsala Space
Observatory (OSO), in particular to Dr. L. E. B. Johansson for help during the
observations. The OSO 20m telescope is operated by the Swedish
National Facility for Radio Astronomy, Onsala Space Observatory at Chalmers
University of Technology. We also acknowledge fruitful discussions
with Drs. G. Olofsson, P. Papadopoulos and R. Liseau. Finally, we
acknowledge the constructive comments of the referee, Dr G. A. Blake,
which resulted in improvements to the paper.
-
Bieging, J. H., & Cohen, M. 1985, ApJL, 289, L5
In the text
NASA ADS
-
Butner, H. M., Lada, E. A., & Loren, R. B. 1995, ApJ, 448, 207+
In the text
NASA ADS
-
Emerson, J. P. 1988, in NATO ASIC Proc. 241, Formation and Evolution of Low
Mass Stars, 21+
In the text
-
Fridlund, C. 1987, Ph.D. Thesis, University of Stockholm, Sweden
In the text
-
Fridlund, C. V. M., & Knee, L. B. G. 1993, A&A, 268, 245
In the text
NASA ADS
-
Fridlund, C. V. M., & Liseau, R. 1998, ApJL, 499, L75
In the text
NASA ADS
-
Fridlund, C. V. M., Nordh, H. L., van Duinen, R. J., Aalders, J. W. G.,
& Sargent, A. I. 1980, A&A, 91, L1
In the text
NASA ADS
-
Fridlund, C. V. M., Sandqvist, A., Nordh, H. L., & Olofsson, G. 1989,
A&A, 213, 310
In the text
NASA ADS
-
Fridlund, M., Huldtgren, M., & Liseau, R. 1997, in IAU Symp. 182,
Herbig-Haro Flows and the Birth of Stars, 19
In the text
-
Fuller, G. A., Ladd, E. F., Padman, R., Myers, P. C., & Adams, F. C.
1995, ApJ, 454, 862+
In the text
NASA ADS
-
Goldsmith, P. F., Margulis, M., Snell, R. L., & Fukui, Y. 1992, ApJ,
385, 522
In the text
NASA ADS
-
Hogerheijde, M. R., van Dishoeck, E. F., Blake, G. A., & van Langevelde, H. J. 1997, ApJ, 489, 293+
In the text
NASA ADS
-
Hogerheijde, M. R., van Dishoeck, E. F., Blake, G. A., & van Langevelde, H. J. 1998, ApJ, 502, 315+
In the text
NASA ADS
-
Kaifu, N. 1987, in Star Forming Regions, IAU Symp., 115, 275
In the text
-
Kaifu, N., Hasegawa, T., Morimoto, M., et al.
1984, A&A, 134, 7
In the text
NASA ADS
-
Keene, J., & Masson, C. R. 1990, ApJ, 355, 635
In the text
NASA ADS
-
Kutner, M. L., & Ulich, B. L. 1981, ApJ, 250, 341
In the text
NASA ADS
-
Ladd, E. F., Fuller, G. A., Padman, R., Myers, P. C., & Adams, F. C.
1995, ApJ, 439, 771
In the text
NASA ADS
-
Lay, O. P., Carlstrom, J. E., Hills, R. E., & Phillips, T. G. 1994,
ApJL, 434, L75
In the text
NASA ADS
-
Liljeström, T. 1989, A&A, 219, L19
In the text
NASA ADS
-
Liseau, R., & Sandell, G. 1986, ApJ, 304, 459
In the text
NASA ADS
-
Looney, L. W., Mundy, L. G., & Welch, W. J. 1997, ApJL, 484, L157
In the text
NASA ADS
-
Mizuno, A., Onishi, T., Hayashi, M., et al. 1994, Nature, 368, 719+
In the text
NASA ADS
-
Momose, M., Ohashi, N., Kawabe, R., Nakano, T., & Hayashi, M. 1998,
ApJ, 504, 314+
In the text
NASA ADS
-
Moneti, A., Forrest, W. J., Pipher, J. L., & Woodward, C. E. 1988,
ApJ, 327, 870
In the text
NASA ADS
-
Motte, F., & André, P. 2001, A&A, 365, 440
In the text
NASA ADS
-
Ohashi, N., Hayashi, M., Ho, P. T. P., Momose, M., & Hirano, N.
1996, ApJ, 466, 957+
In the text
NASA ADS
-
Pickett, H. M., Poynter, R. L., Cohen, E. A., et al. 1998, J. Quant.
Spectrosc. Rad. Transfer, 60, 883+
In the text
-
Pratap, P., Dickens, J. E., Snell, R. L., et al. 1997, ApJ, 486, 862+
In the text
NASA ADS
-
Rainey, R., White, G. J., Richardson, K. J., et al. 1987, A&A, 179, 237
In the text
NASA ADS
-
Reipurth, B. 1999, A general catalogue of Herbig-Haro objects, electronically
published via World Wide Web at In the text
http:casa.colorado.edu/hhcat
-
Rodriguez, L. F., Canto, J., Torrelles, J. M., & Ho, P. T. P. 1986,
ApJL, 301, L25
In the text
NASA ADS
-
Rodriguez, L. F., D'Alessio, P., Wilner, D. J., et al. 1998, Nature, 395, 355
In the text
NASA ADS
-
Rybicki, G. B., & Hummer, D. G. 1991, A&A, 245, 171
In the text
NASA ADS
-
Saito, M., Kawabe, R., Kitamura, Y., & Sunada, K. 1996, ApJ, 473,
464+
In the text
NASA ADS
-
Sargent, A. I., Keene, J., Masson, C., & Beckwith, S. 1988, ApJ, 333,
936
In the text
NASA ADS
-
Smith, H. A., Fischer, J., Schwartz, P. R., & Geballe, T. R. 1987,
ApJ, 316, 265
In the text
NASA ADS
-
Snell, R. L., Loren, R. B., & Plambeck, R. L. 1980, ApJL, 239, L17
In the text
NASA ADS
-
Stocke, J. T., Hartigan, P. M., Strom, S. E., et al. 1988, ApJS, 68, 229
In the text
NASA ADS
-
Terebey, S., Chandler, C. J., & Andre, P. 1993, ApJ, 414, 759
In the text
NASA ADS
-
Uchida, Y., Kaifu, N., Hayashi, S. S., Hasegawa, T., & Shibata, K.
1987, in Star Forming Regions, IAU Symp., 115, 287
In the text
-
Uchida, Y., & Shibata, K. 1984, PASJ, 36, 105
In the text
NASA ADS
-
White, G. J., Liseau, R., Men'shchikov, A. B., et al. 2000, A&A,
364, 741
In the text
NASA ADS
-
Woody, D. P., Scott, S. L., Scoville, N. Z., et al. 1989, ApJ, 337, L41
In the text
NASA ADS
Copyright ESO 2002
 ,
C17O
,
C17O
 ,
,

 42
42
 = 6.3 kms-1 for L1551
The higher noise for H13CO+ refers to the data obtained in 2000 and
is readily identified in Fig.
= 6.3 kms-1 for L1551
The higher noise for H13CO+ refers to the data obtained in 2000 and
is readily identified in Fig.  160
160
![\begin{figure}
\par\includegraphics[angle=270,width=18cm,clip]{h3036F1.eps} \end{figure}](/articles/aa/full/2002/05/aah3036/img22.gif)
![\begin{figure}
\par\includegraphics[width=12.6cm,clip]{h3036F2.eps}\\ [4mm] \inc...
...6F3.PS}\hspace*{4mm}\includegraphics[width=5.85cm,clip]{h3036F4.PS} \end{figure}](/articles/aa/full/2002/05/aah3036/img24.gif)
![\begin{figure}
\par\includegraphics[angle=270,width=16cm,clip]{h3036F5.PS} \end{figure}](/articles/aa/full/2002/05/aah3036/img25.gif)
![\begin{figure}
\par\includegraphics[angle=270,width=12cm,clip]{h3036F6.PS} \end{figure}](/articles/aa/full/2002/05/aah3036/img26.gif)


![\begin{figure}
\par\includegraphics[angle=270,width=8.8cm,clip]{h3036F7.PS} \end{figure}](/articles/aa/full/2002/05/aah3036/img57.gif)
![\begin{figure}
\par\includegraphics[angle=270,width=10.1cm,clip]{h3036F8.PS} \end{figure}](/articles/aa/full/2002/05/aah3036/img61.gif)