A&A 381, L37-L40 (2002)
DOI: 10.1051/0004-6361:20011630
Evidence for the extragalactic Cepheid distance bias
from the
kinematical distance scale
P. Teerikorpi
1 -
G. Paturel
2
1 - Tuorla Observatory, University of Turku, 21500 Piikkiö, Finland
2 -
CRAL-Observatoire de Lyon, 69561 Saint-Genis Laval Cedex, France
Received 11 July 2001 / Accepted 18 November 2001
Abstract
We present new evidence for
the extragalactic Cepheid distance bias.
A dependence between the Hubble parameter and the absolute Cepheid magnitude
limit for a galaxy may be interpreted as a significant bias in
the derived photometric distances:
those from Cepheid samples with a bright absolute
magnitude limit apparently are underestimated.
This may be caused not only by the dispersion
of  at a fixed Cepheid period, but also by the whole
amplitude of variation,
together with an upper limit in the period of the observed Cepheids, and other
factors.
If so, then the value of H0 based on methods
using Cepheid distances is expected to
be often overestimated (i.e. the distances underestimated).
We discuss whether the effect could be not real, but rather caused
by uncertainties
in kinematical distances.
at a fixed Cepheid period, but also by the whole
amplitude of variation,
together with an upper limit in the period of the observed Cepheids, and other
factors.
If so, then the value of H0 based on methods
using Cepheid distances is expected to
be often overestimated (i.e. the distances underestimated).
We discuss whether the effect could be not real, but rather caused
by uncertainties
in kinematical distances.
Key words: galaxies: general - cosmology
In the present letter we investigate the importance
of the Cepheid population incompleteness bias, tending to produce too
small distances:
of the Cepheids in a galaxy only those with long periods P may be fully
sampled, because of the limiting magnitude.
This was first discussed by Sandage (1988).
Lanoix et al. (1999) suggested a rule to avoid the
bias by excluding short period Cepheids.
Paturel et al. (2001)
have used an analytical correction to the bias, and they
have found evidence for
a small
differential bias in the HST Cepheid distances beyond
 by comparing
the HST values to the distances obtained via the differential
(``sosies'') method.
by comparing
the HST values to the distances obtained via the differential
(``sosies'') method.
Here we use still another route.
In analogy with the succesful
use of a kinematic distance scale for revealing the
Malmquist bias in TF distance moduli (see e.g. Teerikorpi
1997), we now study the
bias in Cepheid distances by comparing them with the kinematical distances
(corrected velocities)  derived from Peebles's infall model with
 kms-1,
 kms-1.
This same model was used
e.g. in Theureau et al. (1997). The local Hubble velocity field,
when corrected
for the infall flow towards the Virgo cluster, appears to be remarkably
smooth, with the velocity dispersion
kms-1.
This same model was used
e.g. in Theureau et al. (1997). The local Hubble velocity field,
when corrected
for the infall flow towards the Virgo cluster, appears to be remarkably
smooth, with the velocity dispersion  50 kms-1 (e.g. Sandage
1999; Ekholm
et al. 2001; Karachentsev & Makarov 2000),
and deserves to be utilized as an
independent distance measure.
In using this velocity field model, the six galaxies in the direction
of the Virgo cluster have
been put at
50 kms-1 (e.g. Sandage
1999; Ekholm
et al. 2001; Karachentsev & Makarov 2000),
and deserves to be utilized as an
independent distance measure.
In using this velocity field model, the six galaxies in the direction
of the Virgo cluster have
been put at
 kms-1.
We have excluded NGC 4414 from
the data, as it is in the sky close to, but not in the Virgo cluster
kms-1.
We have excluded NGC 4414 from
the data, as it is in the sky close to, but not in the Virgo cluster![[*]](/icons/foot_motif.gif) .
For other non-Virgo galaxies at an angular distance <30 deg we have used
the Tolman-Bondi solution from Ekholm et al. (1999), also based
on
.
For other non-Virgo galaxies at an angular distance <30 deg we have used
the Tolman-Bondi solution from Ekholm et al. (1999), also based
on
 kms-1 and
kms-1.
kms-1 and
kms-1.
We also check the result for different
infall velocities and for the more complex velocity field model preferred
by Freedman et al. (2001).
We use distances
 ,
mostly from the HST projects,
as given by Freedman et al. (2001). Table 1 gives the
data.
,
mostly from the HST projects,
as given by Freedman et al. (2001). Table 1 gives the
data.
Table 1:
Data for the Cepheid galaxy sample.
| name |
 |
V0 |
|
 |
 |
 |
| 224 |
24.48 |
-14 |
-14 |
21.0 |
1.65 |
- |
| 300 |
26.50 |
124 |
112 |
21.5 |
1.55 |
1.75 |
| 598 |
24.62 |
68 |
68 |
20.0 |
1.55 |
1.91 |
| 925 |
29.81 |
782 |
775 |
26.0 |
1.60 |
1.93 |
| 1326 |
31.00 |
1716 |
1655 |
27.0 |
1.60 |
2.02 |
| 1365 |
31.27 |
1565 |
1515 |
27.0 |
1.65 |
1.93 |
| 1425 |
31.70 |
1440 |
1394 |
27.0 |
1.65 |
1.80 |
| 2090 |
30.35 |
755 |
807 |
26.0 |
1.65 |
1.84 |
| 2403 |
27.51 |
299 |
366 |
22.0 |
1.90 |
2.06 |
| 2541 |
30.25 |
647 |
802 |
26.0 |
1.65 |
1.85 |
| 3031 |
27.80 |
123 |
141 |
24.0 |
1.60 |
1.59 |
| 3109 |
25.22 |
130 |
140 |
22.0 |
1.30 |
2.10 |
| 3198 |
30.70 |
703 |
857 |
26.0 |
1.70 |
1.79 |
| 3319 |
30.62 |
763 |
929 |
26.0 |
1.65 |
1.84 |
| 3351 |
30.00 |
641 |
552 |
26.0 |
1.65 |
1.74 |
| 3368 |
30.11 |
760 |
624 |
26.0 |
1.60 |
1.77 |
| 3621 |
29.11 |
436 |
493 |
25.0 |
1.65 |
1.87 |
| 3627 |
30.01 |
596 |
504 |
26.0 |
1.65 |
1.70 |
| 4258 |
29.51 |
510 |
512 |
26.0 |
1.50 |
1.81 |
| 4321 |
30.91 |
1481 |
1200 |
26.0 |
1.70 |
1.90 |
| 4496A |
30.86 |
894 |
1200 |
26.0 |
1.70 |
1.91 |
| 4535 |
30.99 |
1822 |
1200 |
26.0 |
1.65 |
1.88 |
| 4536 |
30.87 |
1640 |
1200 |
26.0 |
1.65 |
1.91 |
| 4548 |
31.05 |
379 |
1200 |
27.0 |
1.55 |
1.87 |
| 4639 |
31.71 |
894 |
1200 |
27.0 |
1.70 |
1.74 |
| 4725 |
30.46 |
1160 |
696 |
26.0 |
1.60 |
1.75 |
| 5253 |
27.49 |
155 |
161 |
24.5 |
1.50 |
1.71 |
| 5457 |
29.13 |
361 |
388 |
25.0 |
1.65 |
1.76 |
| 6822 |
23.27 |
8 |
8 |
19.5 |
1.50 |
- |
| 7331 |
30.84 |
1115 |
1099 |
26.5 |
1.60 |
1.87 |
| SEXA |
25.81 |
118 |
115 |
22.0 |
1.40 |
1.90 |
| SEXB |
25.72 |
139 |
134 |
22.0 |
1.40 |
1.98 |
| IC4182 |
28.37 |
337 |
303 |
25.0 |
1.60 |
1.81 |
We consider the deepness of the Cepheid
sample in a galaxy as an important parameter related to the possible bias.
This is based on the absolute magnitude limit
 for the Cepheids. The limiting magnitude
comes from
Paturel et al. (2001).
Then following the old idea that the behaviour of the Hubble parameter
for the Cepheids. The limiting magnitude
comes from
Paturel et al. (2001).
Then following the old idea that the behaviour of the Hubble parameter
 may reveal a bias in the inferred distances, we
show in Fig. 1a
versus the absolute magnitude limit
may reveal a bias in the inferred distances, we
show in Fig. 1a
versus the absolute magnitude limit
 .
The pattern in the distribution of the points is familiar from
our other selection bias studies made in the past.
On the right
one sees the expected ``unbiased plateau'', and when
gets brighter
or the Cepheid sample less deep,
starts to increase. The horizontal line is at H=58.
.
The pattern in the distribution of the points is familiar from
our other selection bias studies made in the past.
On the right
one sees the expected ``unbiased plateau'', and when
gets brighter
or the Cepheid sample less deep,
starts to increase. The horizontal line is at H=58.
It has been stated (Freedman et al. 2001)
that the
bias in the Cepheid method is very small for the present galaxies, because
of the small intrinsic scatter  in the PL-relation,
and this small bias may be removed by cutting from the data short-period
Cepheids.
The differential bias in the HST values relative to the ``sosies'' distances
(Paturel et al. 2001) was at most 0.1-0.2 mag.
in the PL-relation,
and this small bias may be removed by cutting from the data short-period
Cepheids.
The differential bias in the HST values relative to the ``sosies'' distances
(Paturel et al. 2001) was at most 0.1-0.2 mag.
But the bias indicated by Fig. 1a, if thus interpreted,
appears to reach 0.5-1.0 mag for
galaxies where the absolute limit is bright. Before presenting
more evidence for the reality of the bias, we briefly consider how this
can be possible, in spite of the precautions taken by the analyzers?
We suspect that one should take into account
not only the small dispersion ,
but also the amplitude of
variation at the detection wavelength (Sandage 1988), and the
maximal observed period.
We also note the importance of the (unknown) true average
extinction for the whole Cepheid population in a host galaxy.
![\begin{figure}
\centering
\includegraphics[width=6.8cm,clip]{DG111_f1.eps}\end{figure}](/articles/aa/full/2002/03/aadg111/Timg23.gif) |
Figure 1:
(Log) Hubble parameter H versus increasingly normalized
parameters:
a) the absolute limiting magnitude
,
b)
normalized
to account for different limiting Cepheid periods.
NGC2403 with
 ,
outside the
range in a), now
follows the trend of the other galaxies.
Open circles are
nearby galaxies having ,
outside the
range in a), now
follows the trend of the other galaxies.
Open circles are
nearby galaxies having
 kms-1. The horizontal line is
for H=58.
Note the ``unbiased plateau'',
an expected feature in such a diagram and the slope -0.2 of the biased
part, also expected in the simple scenario described in the text. kms-1. The horizontal line is
for H=58.
Note the ``unbiased plateau'',
an expected feature in such a diagram and the slope -0.2 of the biased
part, also expected in the simple scenario described in the text. |
| Open with DEXTER |
Suppose that the Cepheid magnitude
limit is
,
the true distance modulus
is ,
at the period Pthe average magnitude is M(P),
and the (half-) amplitude of variation is  .
The determination
of
.
The determination
of
 presupposes that the whole range
 is observed.
But as the average M(P) has also a dispersion ,
an unbiased
determination of
requires a still wider range, up to the faint
magnitude of
is observed.
But as the average M(P) has also a dispersion ,
an unbiased
determination of
requires a still wider range, up to the faint
magnitude of
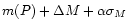 ,
where
,
where
 1-2.
This range can be covered only for periods longer than
1-2.
This range can be covered only for periods longer than
 where
where
 .
For periods shorter than
this requirement forces into the sample
only such Cepheids for which the true average M is brighter than
the unbiased average, causing an underestimate of the distance.
.
For periods shorter than
this requirement forces into the sample
only such Cepheids for which the true average M is brighter than
the unbiased average, causing an underestimate of the distance.
The bias increases sharply, if there is a maximum observable period which
is equal to or shorter than the above limit
.
Then the brightening of
the absolute magnitude limit
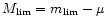 directly enters the
derived average distance modulus. In this interval of
one
expects that
changes with the slope of -0.2(coming from
directly enters the
derived average distance modulus. In this interval of
one
expects that
changes with the slope of -0.2(coming from
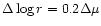 ).
).
Figure 1a shows that the slope of the increasing part of
indeed is
close to
-0.2. But does the increase start at an expected value of
?
We take the period-luminosity law as follows:
 ,
the amplitude
,
the amplitude
 mag,
mag,
 ,
,
 (1 sigma),
and calculate
(1 sigma),
and calculate
 for H= 58.
Furthermore, one must
brighten the absolute limit by the average amount of extinction in the
Milky Way and in the host galaxy. Note that this does not refer to the
extinction for the observed Cepheids, but to the true
average extinction which must be higher.
We conservatively take the (unknown) total extinction
to be 0.5 mag. It should be emphasized that just correcting for
the individual extinctions (reddenings) does not remove the fact that
it is the total extinction that changes the effective magnitude limit.
for H= 58.
Furthermore, one must
brighten the absolute limit by the average amount of extinction in the
Milky Way and in the host galaxy. Note that this does not refer to the
extinction for the observed Cepheids, but to the true
average extinction which must be higher.
We conservatively take the (unknown) total extinction
to be 0.5 mag. It should be emphasized that just correcting for
the individual extinctions (reddenings) does not remove the fact that
it is the total extinction that changes the effective magnitude limit.
Then the limiting  corresponding
to
corresponding
to
 (Fig. 1) is =1.57.
This agrees rather well with the
general period limit achieved in HST observations (Freedman et al.
2001; Paturel et al. 2001).
(Fig. 1) is =1.57.
This agrees rather well with the
general period limit achieved in HST observations (Freedman et al.
2001; Paturel et al. 2001).
In principle, one could treat this bias using the model discussed
by Teerikorpi (1987) in connection with the TF distance moduli
of galaxy clusters (cf. Paturel et al. 2001), with the
modification that now at a fixed period there are Cepheids with different
average M and the function of the absolute magnitude limit is to throw
away a Cepheid when its average magnitude is brighter than but
sufficiently close to the limit. Furthermore,
in the calculation of the mean bias
one must take into account the upper limit in the relevant parameter,
here the period P. However, at this stage we prefer this simple
demonstration. A full treatment of the bias may need
deeper understanding of the difficult art of detecting Cepheids
against the galaxy background, obscured by extinction.
One might argue that the correlation between
and
is
due to errors in the Hubble flow model, as
enters both
quantities. If so, the peculiar velocities would be large,
contrary to other evidence, and this would not explain the
bias pattern in Fig. 1a. Here we give more evidence that the culprit
is the distance and not the velocity.
We first show in Fig. 1 how
different steps of normalization sharpen the bias pattern.
In Fig. 1a the purely photometric
quantity
has been added
to the ( )
kinematical distance,
which normalization leads
to the absolute magnitude limit
and to the bias pattern.
)
kinematical distance,
which normalization leads
to the absolute magnitude limit
and to the bias pattern.
Because the limiting Cepheid period is different for different galaxies,
one may, as a further step, attempt to normalize
the limiting magnitude by adding
the quantity
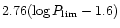 :
a small limiting period enhances
the effect discussed in Sect. 3. The approximate
comes
from Paturel
et al. (2001), but for NGC2403 it is from Tammann & Sandage
(1968).
This has been done in Fig. 1b,
where now NGC2403 is also found close to the ``0.2-line''.
The normalization still decreases the scatter, as expected if
the correlation is due to the bias.
:
a small limiting period enhances
the effect discussed in Sect. 3. The approximate
comes
from Paturel
et al. (2001), but for NGC2403 it is from Tammann & Sandage
(1968).
This has been done in Fig. 1b,
where now NGC2403 is also found close to the ``0.2-line''.
The normalization still decreases the scatter, as expected if
the correlation is due to the bias.
![\begin{figure}
\centering
\includegraphics[width=8.8cm,clip]{DG111_f2.eps}\end{figure}](/articles/aa/full/2002/03/aadg111/Timg43.gif) |
Figure 2:
(Log)H versus the normalized absolute
limiting magnitude
for galaxies in systems, using for
each system an average radial velocity. The symbols: Dot (Virgo),
open circle (Fornax), filled square (M81-gr.), open square (Leo),
filled triangle (Ant-Sex), open triangle (de Vaucouleurs's G12). |
| Open with DEXTER |
There are a few cases where two or more Cepheid sample galaxies have been
ascribed to a group or a cluster: Virgo, M81-group, Leo, Fornax, Ant-Sex,
de Vaucouleurs's G12.
We give
such galaxies the common velocity and plot them in the normalized
vs.
diagram. Figure 2 shows that the correlation remains to exist
within individual groups, as it should if distance errors are involved.
![\begin{figure}
\centering
\includegraphics[width=8.8cm,clip]{DG111_f3.eps}\end{figure}](/articles/aa/full/2002/03/aadg111/Timg44.gif) |
Figure 3:
(Log)H versus the normalized absolute
limiting magnitude
for the galaxies in Table 5 of Freedman et al.
(2001), with the corrected velocity
 .
Open circle:
the velocity <150 kms-1. The horizontal line is now for H = 65. .
Open circle:
the velocity <150 kms-1. The horizontal line is now for H = 65. |
| Open with DEXTER |
We have used the rather standard correction for the Virgo infall velocity
field. In addition to its simplicity, it has the advantage of
preserving the Hubble law for the local galaxies with good distance
estimates. There are in the literature other, more complex solutions
for the velocity field, based on large samples of galaxies and attempting to
make the corrections down to the rest frame of the CMBR. However, the
discrepancies with different solutions remain large, as was emphasized
by Freedman et al. (2001). One may suspect that systematic
errors are still present
in these solutions, influencing different samples and distance indicators
in different manners.
In order to see how a different velocity field model influences
our result, we calculated the
vs.
diagram also for the linear infall model with three mass
concentrators, used by the HST Key Project
(velocities ``
'' in Table 5 of Freedman et al.
2001). The strong correlation
remains (Fig. 3), though the average
is increased.
We also made
experiments with different values of the Virgo infall velocity around
the 220 kms-1 which was derived in Theureau et al. (1997).
The strong correlation remains, even for the large value of 440 kms-1as preferred by Marinoni et al. (1998).
One may conclude that the effect is rather robust for generally used
velocity field models.
The Cepheid method thus may
suffer from a significant selection bias, which we suspect leads
to underestimated
distances even when the usual precautions are taken.
That a bias exists (Sandage 1988; Lanoix et al.
1999; Paturel et al. 2001),
is not surprising in view of the selection
generally affecting photometric distance indicators (e.g. Teerikorpi
1997), but its strength, according to our interpretation
of Figs. 1-3, was unexpected.
If such a bias exists, its reason must be more complicated
than merely the dispersion
in the average luminosity and requires careful study. However, it seems that
the amplitude of variation at
the detection wavelength and, as we suspect, the total extinction between
us and the total Cepheid population in a galaxy are involved, together
with the observational upper limit to the Cepheid period.
We note that the exclusion of light-curves, where the faint
bottoms of the curves are poorly sampled, as generally done,
directly works towards the enhanced bias (Sect. 3).
Examination of the calibrator galaxy TF diagram suggests
that the result of the KLUN project (Theureau et al. 1997;
Ekholm et al. 1999),
 kms-1/Mpc,
does not need significant revision even in the presence of the suspected
bias (this will be discussed elsewhere).
However, generally
the approaches to H0 relying on the Cepheid distances may be
affected (depending on which host galaxies are used),
with a trend towards too high values for H0.
Note also that five out of the six galaxies
assumed to be in the Virgo cluster,
seem to be outside of the unbiased plateau,
suggesting that Virgo's Cepheid distance is too short.
kms-1/Mpc,
does not need significant revision even in the presence of the suspected
bias (this will be discussed elsewhere).
However, generally
the approaches to H0 relying on the Cepheid distances may be
affected (depending on which host galaxies are used),
with a trend towards too high values for H0.
Note also that five out of the six galaxies
assumed to be in the Virgo cluster,
seem to be outside of the unbiased plateau,
suggesting that Virgo's Cepheid distance is too short.
Acknowledgements
We thank the referee for valuable comments.
This study has been supported by the Academy of Finland
(project ``Cosmology from the local to the deep galaxy universe'').
- Ekholm, T., Lanoix, P., Teerikorpi, P., Paturel, G., & Fouqué, P. 1999, A&A, 351, 827
In the text
NASA ADS
- Ekholm, T., Teerikorpi, P., Theureau, G., et al. 1999, A&A, 347, 99
NASA ADS
- Ekholm, T., Baryshev, Yu., Teerikorpi, P., Hanski, M. O., & Paturel, G. 2001, A&A, 368, L17
In the text
NASA ADS
- Freedman, W. L., Madore, B., Gibson, B. K., et al. 2001, ApJ, 553, 47
In the text
NASA ADS
- Karachentsev, I., & Makarov, D. 2000, Preprint 151 (Russian Academy of Sciences)
In the text
- Lanoix, P., Paturel, G., & Garnier, R. 1999, ApJ, 517, 188
In the text
NASA ADS
- Marinoni, C., Monaco, P., Giuricin, G., & Costantini, B. 1998, ApJ, 505, 484
In the text
NASA ADS
- Paturel, G., Theureau, G., Fouqué, P., et al. 2001, A&A, in press
In the text
- Sandage, A. 1988, PASP, 100, 935
In the text
NASA ADS
- Sandage, A. 1999, ApJ, 527, 479
In the text
NASA ADS
- Tammann, G. A., & Sandage, A. 1968, ApJ, 151, 825
In the text
NASA ADS
- Teerikorpi, P. 1987, A&A, 173, 39
In the text
NASA ADS
- Teerikorpi, P. 1997, ARA&A, 35, 101
In the text
NASA ADS
- Theureau, G., Hanski, M., Ekholm, T., et al. 1997, A&A, 322, 730
In the text
NASA ADS
Copyright ESO 2002
![\begin{figure}
\centering
\includegraphics[width=6.8cm,clip]{DG111_f1.eps}\end{figure}](/articles/aa/full/2002/03/aadg111/img23.gif)
 to the same limiting period
![\begin{figure}
\centering
\includegraphics[width=8.8cm,clip]{DG111_f2.eps}\end{figure}](/articles/aa/full/2002/03/aadg111/img43.gif)
![\begin{figure}
\centering
\includegraphics[width=8.8cm,clip]{DG111_f3.eps}\end{figure}](/articles/aa/full/2002/03/aadg111/img44.gif)