A&A 381, 507-516 (2002)
DOI: 10.1051/0004-6361:20011575
D. Kotnik-Karuza 1 - M. Friedjung 2 - P. L. Selvelli 3
1 - Physics Department, University of Rijeka, Omladinska 14, HR 51000 Rijeka, Croatia
2 - Institut d'Astrophysique, Paris, France
3 -
Osservatorio Astronomico, Trieste, Italy
Received 12 April 2001 / Accepted 15 October 2001
Abstract
In our investigation of the region of formation of the Fe II
emission lines in RR Tel, we have applied the SAC method
to the optical Fe II emission line fluxes measured by
Crawford et al. (1999). It is possible to determine physical
parameters of the line emitting region, because of the
presence both of lines with large and much smaller optical
thicknesses. The values we obtained, given in Tables 3 and 4, are limits in most cases. The upper limit to the excitation
temperature of the metastable levels in the permitted line
region of 6600 K, is close to the value of this temperature
in the forbidden line region. Other excitation temperature
limits corresponding to level population ratios were also found.
The permitted lines are formed in a region with a radius
between
![]() cm and
cm and
![]() cm,
while the forbidden lines are formed in a region with a minimum
radius of
cm,
while the forbidden lines are formed in a region with a minimum
radius of
![]() cm. The populations of the
lower levels of the permitted lines indicate a minimum column
density of Fe+ of
cm. The populations of the
lower levels of the permitted lines indicate a minimum column
density of Fe+ of
![]() atoms cm-2 and, by assuming cosmic
abundances, to a minimum column density of
atoms cm-2 and, by assuming cosmic
abundances, to a minimum column density of
![]() atoms cm-2for H.
If we assume a minimum radius of
atoms cm-2for H.
If we assume a minimum radius of
![]() cm, which is supposed to be
that of dust condensation
of the cool Mira component of this symbiotic binary, a minimum mass loss rate
of
cm, which is supposed to be
that of dust condensation
of the cool Mira component of this symbiotic binary, a minimum mass loss rate
of
![]() yr-1 is found.
Our results support a model according to which both the permitted and the forbidden
lines are formed in the wind of the cool Mira component above the
regions where absorption by dust is important. The forbidden and
the permitted lines are not formed in quite the same region, the
former being most probably formed further out in the part of an
accelerated wind which is ionized by the hot component.
yr-1 is found.
Our results support a model according to which both the permitted and the forbidden
lines are formed in the wind of the cool Mira component above the
regions where absorption by dust is important. The forbidden and
the permitted lines are not formed in quite the same region, the
former being most probably formed further out in the part of an
accelerated wind which is ionized by the hot component.
Key words: stars: binaries: symbiotic - stars: individual: RR Tel - stars: fundamental parameters
RR Tel belongs to the group of symbiotic novae that are interacting binaries consisting of a late-type giant and a hot companion thought to be a white dwarf. They are distinguished from classic symbiotic stars because only one single major outburst, with a recovery phase typically lasting for decades, has been observed.
Since its last outburst in 1944, RR Tel has been the subject of many extensive spectroscopic investigations concerning its nature, which indicate a very complex physical situation, involving a white dwarf, a Mira variable of spectral type near M5 and pulsation period of 387 days, planetary nebula-like plasma and additional hot plasma that could be due to colliding winds from the two binary components (Contini & Formiggini 1999). The evidence for a circumstellar dust shell leads to a classification of RR Tel as a D-type symbiotic (Feast & Glass 1974).
The slowly evolving optical spectrum consists almost entirely of emission lines, while the spectrum has progressed to higher degrees of excitation with increasing time. Thus, in addition to being a fascinating and complex astronomical object, RR Tel is recognized as an excellent source of emission lines that may be used to provide insights into atomic data not readily obtainable by other means (Thackeray 1977; Penston et al. 1983; McKenna et al. 1997).
Numerous permitted and forbidden Fe II emission lines occur in a large
spectral range, from the UV to the IR. They have great potential as a means
of determining the physical conditions in the emitting regions, provided the
necessary atomic data are available (Muratorio & Friedjung 1988).
A partial Grotrian diagram of Fe+ is shown in Fig. 1.
| |
Figure 1: Energy distribution of the lowest levels of Fe II and multiplets observed in the 3180-9455 Å emission spectrum of RR Tel. The horizontal axis shows terms ranged from octets to doublets. The vertical scale indicates energy of levels in eV. For each multiplicity and orbital momentum, even terms are on the left and odd terms are on the right. Permitted and forbidden transitions are marked with solid and dotted lines respectively. The associated numbers refer to different multiplets. |
| Open with DEXTER | |
In this work we have studied RR Tel by the Self Absorption Curve (SAC) method (Friedjung & Muratorio 1980; Friedjung & Muratorio 1987; Muratorio & Friedjung 1988; Baratta et al. 1998) extensively applied in spectroscopic studies of emitting stellar regions since 1987. The approach is different than that of Viotti et al. (2001), where RR Tel is discussed together with other astronomical objects. Here we obtain information about the size of the line emitting region, its column density and the mass loss rate of the Mira variable.
We have used the flux calibrated high resolution spectrum of RR Tel observed by Crawford et al. (Crawford et al. 1999), which covers the wavelength range from 3180 Å to 9455 Å. The high spectral resolution of 6 km s-1 made reliable intensity and FWHM measurement possible also for very weak and sharp features respectively.
The database of Crawford et al. (Crawford et al. 1999) was checked critically regarding not only the line identifications but also the line intensities, at least for the lines and spectral ranges decisive for the physical parameters and their limits, determined in this work.
The list of Fe II identifications has been checked exploiting the high resolution of a UVES spectrum of RR Tel (Selvelli & Bonifacio 2000), in which the intrinsic sharpness of the Fe II emissions against other emission lines constitutes an unambiguous criterion.
The flux calibration was tested by comparing our dataset with another published optical spectrum of RR Tel (McKenna et al. 1997), taking into account the fact that the Fe II line intensities did not vary much over the 3-year period between the observations (Keenan 2001).
Since the measured lines in (McKenna et al. 1997) cover the 3430-9320 Å range, the comparison with the spectrum used by us (Crawford et al. 1999) could be made only in the overlapping 3430-9320 Å region. The calibrated fluxes agree in the limits of the declared errors bellow 6000 Å. The forbidden red lines at larger wavelengths, do not deviate very much.
Outside the 3490-5530 Å range Crawford et al. (1999) made calibrations using the expected relative intensities of He II lines, so the corrections to the measured fluxes in that range could not be those for relative interstellar absorption. The explanation of what was done is unfortunately missing from the paper. One of the authors of it, F. P. Keenan, reassured us however; according to him the relative line intensities should be good at least to the 20% level for lines not widely separated in wavelength (Keenan 2001). The effect of the uncertainty in the nature of the corrections in the red, of the order of 0.1 dex, on our results is not large.
The rapid variation of the measured/corrected fluxes given by Crawford et al. over the small wavelength range below 3400 Å made it however necessary to treat the published results for that range with some caution. This rapid variation was due to poor observing conditions, which influenced the standard star flux (Keenan 2001). According to him, comparing lines widely separated in wavelength like the red and near UV could lead to errors of 30%. The possible influence of the less accurate intensities in the near UV wavelength region has been taken into account in this paper.
The atomic data were taken from different sources (Kurucz 1981; Garstang 1962; Hansen & Lister 1988; Nussbaumer et al. 1981; Moore 1945; Muratorio 1999).
The accepted permitted (Table 1) and forbidden lines (Table 2) are separately available in electronic form at CDS.
A total number of 131 lines belonging to different multiplets originating from transitions between the lowest levels with an excitation potential up to 9 eV (Fig. 1) have been used in applying the Friedjung-Muratorio self absorption curve (SAC) method (Friedjung & Muratorio 1987). The method has proved to be effective in determining limits to relative populations of upper and lower terms, as well as in deriving other information about the line formation region.
The method has not been applied exactly as in previous papers, so we summarize it and its assumptions briefly.
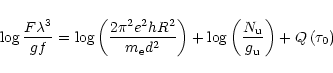
The observational log-log plot of the quantity
![]() /gf derived
from the line flux F emitted in a transition versus (gf
/gf derived
from the line flux F emitted in a transition versus (gf![]() ), which is
related to the optical thickness of that transition, is used to find the Self
Absorption Curve (SAC) whose shape is determined by self absorption effects
(Muratorio et al. 1992). Simple theory gives
), which is
related to the optical thickness of that transition, is used to find the Self
Absorption Curve (SAC) whose shape is determined by self absorption effects
(Muratorio et al. 1992). Simple theory gives
In Eqs. (1) and (2) F is the emission
line flux, R the size of the emitting region perpendicular to the
line of sight, d the distance of the object, ![]() the upper level column
density,
the upper level column
density, ![]() the lower level column density, and
the lower level column density, and ![]() ,
,
![]() their statistical weights.
their statistical weights. ![]() is the characteristic width of the line
in velocity units.
is the characteristic width of the line
in velocity units.
Q(![]() )
is the SAC function, discussed by Kastner
(Kastner 1999) for the case of plane parallel ("slab'') geometry,
the simplest geometry possible.
)
is the SAC function, discussed by Kastner
(Kastner 1999) for the case of plane parallel ("slab'') geometry,
the simplest geometry possible.
As long as level populations inside a spectroscopic term are proportional to
their statistical weights,
the log normalized flux against
![]() values for each multiplet
lie on a curve. For different multiplets the corresponding curves have relative
vertical displacements because of different populations of the upper term and
relative horizontal displacements due to differing populations of the lower term.
values for each multiplet
lie on a curve. For different multiplets the corresponding curves have relative
vertical displacements because of different populations of the upper term and
relative horizontal displacements due to differing populations of the lower term.
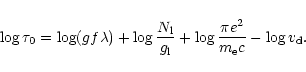
A type of excitation temperature of the line emitting region can be defined by
The SAC function will have always the same shape when population ratios between different line upper levels and also those between different line lower levels do not vary (including LTE when the excitation temperature is constant). The assumption of shape constancy is still approximately valid if most emission comes from regions where these population ratios do not change much, but is questionable if emission is received from different regions where the ratios of population densities of levels are not the same.
An upper level excitation temperature, given by
![]() ,
can be obtained by use of the vertical shift
,
can be obtained by use of the vertical shift
![]() between empirical log normalized flux against
between empirical log normalized flux against
![]() )
plots for
two multiplets with a common lower term, such empirical plots being shown in
Fig. 2 for several multiplets having the same lower term.
)
plots for
two multiplets with a common lower term, such empirical plots being shown in
Fig. 2 for several multiplets having the same lower term.
![\begin{figure}
\par\subfigure[]{\includegraphics[width=6.6cm,clip]{MS1388f2a.eps...
...m}\subfigure[]{\includegraphics[width=6.6cm,clip]{MS1388f2b.eps} }
\end{figure}](/articles/aa/full/2002/02/aa1388/img24.gif) |
Figure 2: Self absorption curves of multiplets with a common lower term a) b4P-multiplets: 25, 27, 28, 29; b) b4F-multiplets: 34, 35, 37, 38. |
| Open with DEXTER | |
Similarly the lower level excitation temperature, of multiplets having
the same upper term,
![]() ,
the horizontal
shift
,
the horizontal
shift ![]() being equal to
being equal to
![]() ,
can
be determined if the lines are fairly saturated.
,
can
be determined if the lines are fairly saturated.
Plots of log normalized flux against
![]() for multiplets having the
same upper term are shown in Fig. 3.
for multiplets having the
same upper term are shown in Fig. 3.
![\begin{figure}
\par\subfigure[]{\includegraphics[width=5.8cm,clip]{MS1388f3a.eps...
...m}\subfigure[]{\includegraphics[width=5.8cm,clip]{MS1388f3c.eps} }
\end{figure}](/articles/aa/full/2002/02/aa1388/img28.gif) |
Figure 3: Self absorption curves of multiplets with a common upper term a) z6D0-multiplets: 1, 3, 34, 40; b) z4D0-multiplets: 6, 21, 27, 38, 43, 48, 73; c) z4F0-multiplets: 7, 10, 15, 22, 28, 32, 37, 49. |
| Open with DEXTER | |
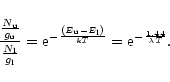
Another kind of upper to lower level population ratio can be also obtained by comparing the emission of a permitted line with that of a forbidden line, whose upper term is the lower term of a permitted line. This ratio, obtained from Eq. (1), can also be expressed as a temperature by (3). That temperature and corresponding population ratio, obtained from the normalized flux of the optically thin permitted line plateau, should be lower limits for the permitted line region, as forbidden lines do not need to be formed in the same region as permitted lines.
It was in addition possible to obtain a metastable level
excitation temperature for all forbidden lines, assuming that they
are optically thin. The value
![]() /gf) is
anticorrelated with the excitation potential, because as we shall
see, these level populations follow a Boltzmann distribution, the
temperature being found from the slope of the graph.
/gf) is
anticorrelated with the excitation potential, because as we shall
see, these level populations follow a Boltzmann distribution, the
temperature being found from the slope of the graph.
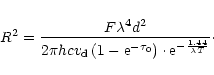
When ![]() becomes the function for the uniform slab of
Friedjung & Muratorio (1987), the size of the region where
radiation of a particular line at a wavelength
becomes the function for the uniform slab of
Friedjung & Muratorio (1987), the size of the region where
radiation of a particular line at a wavelength ![]() is
emitted, or more precisely its radius R, is given by
is
emitted, or more precisely its radius R, is given by
We assume the uniform slab
self absorption curve as an approximation, because we do not know the true
shape very well. Such radii will be correctable at a future date.
In fact the lines are formed almost certainly in an inhomogeneous region. A
best obtainable characteristic radius is that of rather weak lines, with not
too large optical depths, which are near the plateau of the SAC.
Strong lines are not typical of the whole line formation region. The assumption
![]() will in fact eventually lead to only a limit value of
the radius.
will in fact eventually lead to only a limit value of
the radius.
The forbidden line region radius can also be determined, assuming that the excitation temperature given by the approximate Boltzmann distribution of their upper term populations, is the same as that between the upper and lower terms. In such a case only minimum radii can be found since the forbidden lines are usually optically thin.
As we see later we can also obtain limits on the column density from metastable level excitation temperatures.
The question of whether the populations are really in LTE can be considered
both theoretically and empirically. From a theoretical point of view the
populations are in LTE for the lowest levels when both excitation and
de-excitation are
dominated by collisions, that is at electron densities of more than
107 cm-3 (Nussbaumer & Storey 1988).
The general problem of the approach to LTE was also
discussed by Verner et al. (Verner et al. 1999)
for emitting material with a high iron abundance. Their calculations show
that Fe II tends to LTE at the limits of high particle and radiation
densities, as well as at high Lyman continuum optical depths. The metastable
levels numbered 10 and 25 tend to approach LTE at electron densities of more
than 108 cm-3 with an electron temperature of
![]() K. When
the gas density
K. When
the gas density ![]() is 109 cm-3,
is 109 cm-3,
![]() K and the
incident radiation has a Planckian energy distribution with a colour
temperature also of 8000 K, all the metastable levels, but not the
higher levels, are in LTE for any radiation density.
Finally even high level populations reach LTE for a Lyman continuum optical
depth of more than 10 at the Lyman limit, when
K and the
incident radiation has a Planckian energy distribution with a colour
temperature also of 8000 K, all the metastable levels, but not the
higher levels, are in LTE for any radiation density.
Finally even high level populations reach LTE for a Lyman continuum optical
depth of more than 10 at the Lyman limit, when
![]() K,
K,
![]() cm-3 and at very low ionizing radiation density.
cm-3 and at very low ionizing radiation density.
We can also look for non-LTE effects empirically. In particular there remains the question of the extent of possible NLTE effects of levels inside the same upper term of the observed permitted and forbidden transitions. In our test, which has been carried out with the assumption that the line lower levels (metastable for the permitted lines and near 0 eV for the forbidden lines) are in LTE, we checked for NLTE effects inside each term by comparing the lines with upper levels having different J's. They neither show systematic deviations as a function of J for the permitted nor for the forbidden transitions, which means that there is no indication of such differential NLTE depopulation of the upper level.
The plot
![]() /gf vs.
/gf vs.
![]() (upper level excitation
potential) of the forbidden lines, which is very similar to the figure in
Viotti et al. (Viotti et al. 2001), gives evidence of good linearity for all
reliable forbidden line measurements. We can conclude that the populations of
these metastable levels are quite consistent with the assumption of LTE.
(upper level excitation
potential) of the forbidden lines, which is very similar to the figure in
Viotti et al. (Viotti et al. 2001), gives evidence of good linearity for all
reliable forbidden line measurements. We can conclude that the populations of
these metastable levels are quite consistent with the assumption of LTE.
On the contrary, the upper odd terms of the permitted transitions are far
from linearity in the plot
![]() /gf vs.
/gf vs.
![]() .
The
scatter is partly due to self absorption, but it also suggests NLTE
conditions. The NLTE effects are more pronounced for higher terms. Such
lines deviate from the SAC. The deviation is larger than the scatter caused
by measurement errors.
.
The
scatter is partly due to self absorption, but it also suggests NLTE
conditions. The NLTE effects are more pronounced for higher terms. Such
lines deviate from the SAC. The deviation is larger than the scatter caused
by measurement errors.
The SACs belonging to different multiplets can be used to test for NLTE
effects. For example, the vertical shift between the empirical log normalized
flux against
![]() )
plots belonging to the
multiplet pairs 27, 38 and 28, 37 at the same value of
)
plots belonging to the
multiplet pairs 27, 38 and 28, 37 at the same value of
![]() ), is too
large compared with the small difference of the mean level excitation
potentials of the corresponding upper terms (less than 0.01 eV). This is seen
in Fig. 4. Such a shift is hard to explain without invoking NLTE
effects.
), is too
large compared with the small difference of the mean level excitation
potentials of the corresponding upper terms (less than 0.01 eV). This is seen
in Fig. 4. Such a shift is hard to explain without invoking NLTE
effects.
![\begin{figure}
\includegraphics[angle=-90,width=8.8cm,clip]{MS1388f4.eps} \end{figure}](/articles/aa/full/2002/02/aa1388/img41.gif) |
Figure 4: Comparison of SACs belonging to the multiplet pair 27, 38 with common upper term z4D0 (open symbols) with those of the multiplet pair 28, 37 with common upper term z4F0 (filled symbols). |
| Open with DEXTER | |
Among different mechanisms, NLTE pumping might be a candidate for selective excitation of certain lines, observed for highly excited upper levels of the UV lines of RR Tel (Hartmann & Johansson 2000). However, we do not believe that this effect influences much our less excited lines.
Apart from the already corrected interstellar reddening (Crawford et al. 1999), the expected circumstellar absorption could have an influence on our results. The SACs belonging to particular multiplets offer the possibility to test for this effect.
The comparison of the log normalized flux against
![]() )
plots
belonging to multiplets 1 and 40 with a common
upper term z6D0 (Fig. 3a) suggests that the effect of
reddening is small. The lines of multiplet 40 should not have a very large
optical thickness, as their lower level excitation potentials are 0.20 eV
larger than the mean for the lower levels of multiplets 27 and 28 and 0.06 eV
larger than that for multiplets 37 and 38, while the SACs of those multiplets
appear to have only moderate slopes and could be bending in the same
)
plots
belonging to multiplets 1 and 40 with a common
upper term z6D0 (Fig. 3a) suggests that the effect of
reddening is small. The lines of multiplet 40 should not have a very large
optical thickness, as their lower level excitation potentials are 0.20 eV
larger than the mean for the lower levels of multiplets 27 and 28 and 0.06 eV
larger than that for multiplets 37 and 38, while the SACs of those multiplets
appear to have only moderate slopes and could be bending in the same
![]() )
range (see Fig. 4). The positions of the two
points of the multiplet 40 SAC graph also suggest by themselves that the
optical thickness of that multiplet is not large. If circumstellar
reddening was important, the values of
)
range (see Fig. 4). The positions of the two
points of the multiplet 40 SAC graph also suggest by themselves that the
optical thickness of that multiplet is not large. If circumstellar
reddening was important, the values of
![]() )
of the lines of multiplet 40, seen at 6433 Å and 6369 Å, would have to
be considerably larger than the
corresponding values for the optically thicker lines of multiplet 1. Multiplet
1 has a lower level excitation potential 1.84 eV below that of multiplet 40,
wavelengths of the order of 3200 Å and a SAC slope of -0.7.
The observed purely horizontal shift between multiplets 1 and 40 would then
be hard to understand in the presence of much reddening.
)
of the lines of multiplet 40, seen at 6433 Å and 6369 Å, would have to
be considerably larger than the
corresponding values for the optically thicker lines of multiplet 1. Multiplet
1 has a lower level excitation potential 1.84 eV below that of multiplet 40,
wavelengths of the order of 3200 Å and a SAC slope of -0.7.
The observed purely horizontal shift between multiplets 1 and 40 would then
be hard to understand in the presence of much reddening.
Another test exists in the comparison of multiplets with the same upper term
z4D0 (Fig. 3b). The comparison of
![]() /gf)
of the observed multiplet 73 line at 7711 Å with the corresponding values for multiplets 27 and 38 at low
/gf)
of the observed multiplet 73 line at 7711 Å with the corresponding values for multiplets 27 and 38 at low
![]() )
might indicate a larger effect of dust than the comparison
of multiplets 1 and 40. However, the measured multiplet 21 line, with the same
upper term but a much smaller wavelength of 4177 Å than the
multiplet 73 line, also has a similar exceptionally large normalized flux of
the order of 1 dex above the values of the lines with a similar
)
might indicate a larger effect of dust than the comparison
of multiplets 1 and 40. However, the measured multiplet 21 line, with the same
upper term but a much smaller wavelength of 4177 Å than the
multiplet 73 line, also has a similar exceptionally large normalized flux of
the order of 1 dex above the values of the lines with a similar
![]() )
of other multiplets
having that upper term. This suggests that reddening is not the effect which
dominates. Moreover in the case of the 4177 Å line,
the lower level excitation potential is close to that of the multiplet 27 lines.
Non-reddening effects could include for instance errors in the
oscillator strengths, an unidentified blend of the 7711 Å multiplet 73 line, etc.
)
of other multiplets
having that upper term. This suggests that reddening is not the effect which
dominates. Moreover in the case of the 4177 Å line,
the lower level excitation potential is close to that of the multiplet 27 lines.
Non-reddening effects could include for instance errors in the
oscillator strengths, an unidentified blend of the 7711 Å multiplet 73 line, etc.
Let us note that the log normalized flux against
![]() )
plot of
multiplet 73 of the Be star
)
plot of
multiplet 73 of the Be star ![]() Oph is about 0.3 dex above the plot for
other multiplets (Chauville et al. 2000).
That star does not have dust absorption, and the effect there is probably due
to the smaller optical thickness of multiplet 73.
Oph is about 0.3 dex above the plot for
other multiplets (Chauville et al. 2000).
That star does not have dust absorption, and the effect there is probably due
to the smaller optical thickness of multiplet 73.
This leads us to the conclusion that the observed Fe II emission presumably comes from outside the region of dust which surrounds the cool component, so that reddening should not have a major effect on our results. Such a conclusion suggests that, as one might expect, iron is not singly ionized in regions where ionizing radiation is strongly absorbed by dust.
It is likely, the Fe II emission lines of RR Tel have origin in an inhomogeneous region.
In the present work we do not assume a particular form for ![]() when determining population ratios, it being difficult to predict theoretically
or determine exactly observationally in view of the scatter of points on the
log normalized flux
when determining population ratios, it being difficult to predict theoretically
or determine exactly observationally in view of the scatter of points on the
log normalized flux
![]() )
graphs.
In the radius calculations, the FWHM for line broadening along the line of
sight is taken to be 14 km s-1 and the distance of our object as 3600 pc
(Feast et al. 1983; Hayes & Nussbaumer 1986).
)
graphs.
In the radius calculations, the FWHM for line broadening along the line of
sight is taken to be 14 km s-1 and the distance of our object as 3600 pc
(Feast et al. 1983; Hayes & Nussbaumer 1986).
The radius and population ratio errors appear to be dominated by the
scatter of points in the log normalized flux
![]() graphs, this
being perhaps due to weak blends. Relative flux errors produce population
ratio errors of generally not much more than 0.1 dex; the corresponding
log radius error, taking into account absolute flux errors, is not larger.
graphs, this
being perhaps due to weak blends. Relative flux errors produce population
ratio errors of generally not much more than 0.1 dex; the corresponding
log radius error, taking into account absolute flux errors, is not larger.
Shifts of the empirical log normalized flux against log
![]() plots
plots
A limit to the metastable level excitation temperature is found from
multiplets 1 and 40 with a common upper term, the former being
optically thick. The latter should, as already discussed, be optically
thinner than multiplet 1.
The minimum horizontal shift between multiplets 1 and 40 obtained in this way,
leads to an upper limit to the metastable level excitation temperature
![]() K, which in general will not be equal to the Eq. (3) temperature corresponding to the ratio of the upper to
lower level
populations of multiplets 1 and 40. The metastable level temperature obtained
from such a horizontal shift should in general be larger than the Eq. (3) temperature, because the upper level can be expected to be
depopulated with respect to the metastable level in diffuse envelopes. We can
conclude that the T of Eq. (3) should in any case be lower
than the upper limit obtained from the horizontal shift between multiplets 1 and
40. This temperature, in agreement with Eq. (4), leads to
a lower limit of the radius
K, which in general will not be equal to the Eq. (3) temperature corresponding to the ratio of the upper to
lower level
populations of multiplets 1 and 40. The metastable level temperature obtained
from such a horizontal shift should in general be larger than the Eq. (3) temperature, because the upper level can be expected to be
depopulated with respect to the metastable level in diffuse envelopes. We can
conclude that the T of Eq. (3) should in any case be lower
than the upper limit obtained from the horizontal shift between multiplets 1 and
40. This temperature, in agreement with Eq. (4), leads to
a lower limit of the radius ![]() of the line emitting region of multiplet 40.
The assumption
of the line emitting region of multiplet 40.
The assumption ![]() for the stronger line of multiplet 40 with
for the stronger line of multiplet 40 with
![]() Å would give
Å would give
![]() cm.
cm.
The assumption
![]() is clearly dubious and leads to uncertainties in
the calculated
is clearly dubious and leads to uncertainties in
the calculated ![]() .
.
![]() is however not very sensitive to changes of
is however not very sensitive to changes of
![]() from 1 to infinity. When
from 1 to infinity. When
![]() one obtains a
slightly smaller value for
one obtains a
slightly smaller value for ![]() (
(
![]() cm) than when
cm) than when
![]() .
On the contrary,
.
On the contrary, ![]() increases very fast with
decreasing optical thickness towards zero, which means that
supposing
increases very fast with
decreasing optical thickness towards zero, which means that
supposing ![]() in the interval
in the interval
![]() would affect our result
very much. In that case we would determine a larger radius than that we have
now determined; our radius determination would therefore still be a minimum.
would affect our result
very much. In that case we would determine a larger radius than that we have
now determined; our radius determination would therefore still be a minimum.
Common metastable level
Making the assumption that the observed forbidden lines come from the same region as the permitted lines, we have determined the permitted line upper level/metastable level population ratio temperature by noting that the upper metastable term of forbidden lines is the same as the lower term of certain permitted lines. In our case these terms are: b4P, b4F, a6S and a4G, being common to the multiplets: (permitted 27, 28 and forbidden 4F, 18F), (permitted 37, 38, 39 and forbidden 6F, 20F), (permitted 40, 41, 42, 43 and forbidden 7F) and (permitted 48, 49 and forbidden 21F) respectively.
If most forbidden line emission comes from another region, the underestimated Eq. (3) temperatures in that region lead to the Eq. (4) radii which are upper limits.
The major problem of this method is the definition of the SAC plateau of
certain multiplets and the position of ![]() .
This is clear
from the Fig. 3b showing multiplets with the same upper term, by
comparing the one line of multiplet 73, whose flux was measured, with
multiplets 27 and 38. The value of the multiplet 73 line
.
This is clear
from the Fig. 3b showing multiplets with the same upper term, by
comparing the one line of multiplet 73, whose flux was measured, with
multiplets 27 and 38. The value of the multiplet 73 line
![]() /gf) is much larger than one might expect from the SACs of
multiplets 27 and 38 according to the simple uniform slab SAC for any possible
value of the optical thickness. If this effect were real, this could mean that
the real SAC shape, the line optical thicknesses and the expected
/gf) is much larger than one might expect from the SACs of
multiplets 27 and 38 according to the simple uniform slab SAC for any possible
value of the optical thickness. If this effect were real, this could mean that
the real SAC shape, the line optical thicknesses and the expected
![]() )
of a line of a particular multiplet with
)
of a line of a particular multiplet with
![]() could be
extremely uncertain.
In fact the use of the normalized fluxes of permitted lines
of multiplets 27 and 38 really having
could be
extremely uncertain.
In fact the use of the normalized fluxes of permitted lines
of multiplets 27 and 38 really having
![]() would in that
situation, when their optical
thicknesses were assumed to be near 1,
give an additional reason for
the permitted upper/lower level population ratio, obtained from the
comparison of permitted line and forbidden line normalized fluxes,
to be a lower limit.
The derived Eq. (3) temperature would of course still be as before a lower limit.
On the other hand, as already mentioned, the larger value of
would in that
situation, when their optical
thicknesses were assumed to be near 1,
give an additional reason for
the permitted upper/lower level population ratio, obtained from the
comparison of permitted line and forbidden line normalized fluxes,
to be a lower limit.
The derived Eq. (3) temperature would of course still be as before a lower limit.
On the other hand, as already mentioned, the larger value of
![]() /gf)
of the observed multiplet 73 line might possibly be explained by uncorrected
circumstellar reddening. In that case the choice of its normalized flux to
define the SAC plateau of multiplets 27 and 38 would clearly not be justified.
/gf)
of the observed multiplet 73 line might possibly be explained by uncorrected
circumstellar reddening. In that case the choice of its normalized flux to
define the SAC plateau of multiplets 27 and 38 would clearly not be justified.
We use for our determinations the permitted multiplet 27, for which quite many
lines have been measured and whose empirical log normalized flux
![]() )
graph shows a fairly small dispersion.
Making a rather
conservative assumption,
)
graph shows a fairly small dispersion.
Making a rather
conservative assumption, ![]() is at least equal to 1 for
is at least equal to 1 for
![]() (with the wavelength expressed in Å)
(Figs. 2a, 3b).
We deduce maximum radii for line emission of multiplet 27 making
two assumptions.
Firstly we suppose that
(with the wavelength expressed in Å)
(Figs. 2a, 3b).
We deduce maximum radii for line emission of multiplet 27 making
two assumptions.
Firstly we suppose that ![]() of multiplet 27 is equal
to 1 at
of multiplet 27 is equal
to 1 at
![]() with a log normalized flux equal to 12.3
(expressing the wavelengths in Åand the line fluxes in units of
10-12 erg cm-2 s-1).
If we compare the log normalized flux of the SAC plateau obtained by a
correction equal to +0.2 for the self absorption at
with a log normalized flux equal to 12.3
(expressing the wavelengths in Åand the line fluxes in units of
10-12 erg cm-2 s-1).
If we compare the log normalized flux of the SAC plateau obtained by a
correction equal to +0.2 for the self absorption at ![]() with the log
normalized flux of the optically thin lines of multiplet 4F of 18.4
(Fig. 5),
with the log
normalized flux of the optically thin lines of multiplet 4F of 18.4
(Fig. 5),
![\begin{figure}
\par\includegraphics[angle=-90,width=8.8cm,clip]{MS1388f5.eps} \end{figure}](/articles/aa/full/2002/02/aa1388/img55.gif) |
Figure 5: Self absorption curves for the [Fe II] lines. |
| Open with DEXTER | |
The same procedure applied to the permitted line of multiplet 40 with
![]() Å and
Å and
![]() erg cm-2 s-1, assuming
erg cm-2 s-1, assuming
![]() and taking for its lower level the upper term of the forbidden
multiplet 7F, gives
and taking for its lower level the upper term of the forbidden
multiplet 7F, gives
![]() K and
K and
![]() cm. The approximate estimate of
cm. The approximate estimate of
![]() ,
as already mentioned, depends on the uncertain optical thickness of
the line.
,
as already mentioned, depends on the uncertain optical thickness of
the line.
Forbidden line intensity condition assuming Boltzmann distribution of metastable levels
The plot
![]() /gf versus upper level
excitation potential
/gf versus upper level
excitation potential
![]() for all forbidden lines assumed to
be optically thin, suggests a linear dependence with a slope of
about -0.76. This leads to a temperature T = 6600 K, which
is approximately equal to
the maximum permitted line region excitation temperature determined using
multiplets 1 and 40. A very similar temperature with an error of 350 K,
obtained using slightly different values for gf, has been found in the
study by Viotti et al. (2001).
for all forbidden lines assumed to
be optically thin, suggests a linear dependence with a slope of
about -0.76. This leads to a temperature T = 6600 K, which
is approximately equal to
the maximum permitted line region excitation temperature determined using
multiplets 1 and 40. A very similar temperature with an error of 350 K,
obtained using slightly different values for gf, has been found in the
study by Viotti et al. (2001).
We obtain the radius of the formation region of the forbidden
lines from the forbidden line intensity condition.
The SACs of the stronger forbidden lines, whose flux measurements are the most
certain, are horizontal (Fig. 5), so we can deduce that their
optical thicknesses are not more than 1. In particular the flux of the line
4244 Å with the largest
![]() of multiplet 21F, having such
a SAC, is
of multiplet 21F, having such
a SAC, is
![]() erg cm-2 s-1, so assuming a
maximum thickness of 1 and a T of 6600 K,
erg cm-2 s-1, so assuming a
maximum thickness of 1 and a T of 6600 K,
The same procedure applied to the line 4416 Å of multiplet 6F gives
Let us emphasize that the optical thickness is probably
much less than 1, so that the actual radius is considerably larger.
The question as to whether the permitted and forbidden lines are formed in the
same region can be tested observationally. The different permitted and
forbidden line widths suggest that this is not quite so. The forbidden lines
are slightly wider, which is clear from Fig. 6.
![\begin{figure}
\par\includegraphics[width=8.8cm,clip]{MS1388f6.eps} \end{figure}](/articles/aa/full/2002/02/aa1388/img67.gif) |
Figure 6: Evidence for a different permitted and forbidden line forming region. |
| Open with DEXTER | |
The limits to temperature and radius of the Fe II region together with the
procedure used to obtain them are given in Table 3.
The minumum
multiplet 27 ![]() of 1 at
of 1 at
![]() leads from Eq. (2)
to a minimum
leads from Eq. (2)
to a minimum
![]() at 2.68 eV of
at 2.68 eV of
![]() cm-2.
The maximum metastable level excitation temperature of 6600 K,
taking account of an interpolated value of the
partition function of antilog 1.71 at this temperature, yields a minimum
column density of
cm-2.
The maximum metastable level excitation temperature of 6600 K,
taking account of an interpolated value of the
partition function of antilog 1.71 at this temperature, yields a minimum
column density of
![]() atoms cm-2 for Fe+ and
Fe. This gives
atoms cm-2 for Fe+ and
Fe. This gives
![]() atoms of hydrogen per cm2,
assuming standard abundances.
These results are shown in Table 4.
atoms of hydrogen per cm2,
assuming standard abundances.
These results are shown in Table 4.
Instead of our minimum radii, it is more realistic to take the
large radius of the cool component, when estimating the mass loss
rate. Using bolometric corrections to the K magnitude for M giants
(Houdashelt et al. 2000), measured properties of "group 1'' Mira variables with a 387 day pulsation period (Barthès et al. 1999) and an M7 spectral class of the cool component
(Mürset & Schmid 1999), we can expect a mean cool
component radius of the order of
![]() cm to
cm to
![]() cm. A slightly larger bolometric correction,
obtained using the expressions of Whitelock et al. (2000), has no significant influence on this result. The
smaller of these radii is not more than our maximum radii. In fact
we expect line formation outside the radius of dust condensation,
which according to the anonymous referee, should be at 5 Mira
radii or averageing
cm. A slightly larger bolometric correction,
obtained using the expressions of Whitelock et al. (2000), has no significant influence on this result. The
smaller of these radii is not more than our maximum radii. In fact
we expect line formation outside the radius of dust condensation,
which according to the anonymous referee, should be at 5 Mira
radii or averageing
![]() cm, which only seriously
disagrees with our less trustworthy upper limit, found using the
multiplet 73 normalized flux. A radius of 5 Mira radii leads to a
minimum mass loss rate of
cm, which only seriously
disagrees with our less trustworthy upper limit, found using the
multiplet 73 normalized flux. A radius of 5 Mira radii leads to a
minimum mass loss rate of
![]() yr-1.
yr-1.
Mass loss rates for normal Miras with a similar pulsation period were determined by
Loup et al. (1993) from millimeter observations of CO emission.
The value given for the carbon rich Mira R For is
![]()
![]() yr-1,
while for the oxygen rich Miras R LMi, R Hya and S Vir the mass loss rates given
are 2.8, 1.4 and
yr-1,
while for the oxygen rich Miras R LMi, R Hya and S Vir the mass loss rates given
are 2.8, 1.4 and
![]() yr-1 respectively. It must be
noted however
that the cool components of symbiotic binaries have according to Seaquist & Taylor
(1990) larger mass loss rates than single cool giants of
the same spectral type; this is to be expected if, as is believed, symbiotic activity
depends on the rate of capture of the wind by the hot companion. Cool components in
binaries with a suitable hot white dwarf companion, having a larger mass loss
rate, would then be more likely to be considered symbiotic.
yr-1 respectively. It must be
noted however
that the cool components of symbiotic binaries have according to Seaquist & Taylor
(1990) larger mass loss rates than single cool giants of
the same spectral type; this is to be expected if, as is believed, symbiotic activity
depends on the rate of capture of the wind by the hot companion. Cool components in
binaries with a suitable hot white dwarf companion, having a larger mass loss
rate, would then be more likely to be considered symbiotic.
Mass loss rates have also been determined by other authors for RR Tel itself,
using various methods. Seaquist et al. (1993) find a mass
loss rate of
![]() yr-1 from the flux of thermal radio
emission. They used an expression for the ionization of the wind of a single hot star,
having a velocity of 30 km s-1; the wind of a binary will be less ionized, the
correction being larger for a larger mass loss rate, but the correction for
the lower velocity of the wind of RR Tel will tend to cancel that correction.
Kenyon et al. (1988) used infrared flux ratios derived from
IRAS satellite observations to obtain from the infrared emission a mass loss rate
of
yr-1 from the flux of thermal radio
emission. They used an expression for the ionization of the wind of a single hot star,
having a velocity of 30 km s-1; the wind of a binary will be less ionized, the
correction being larger for a larger mass loss rate, but the correction for
the lower velocity of the wind of RR Tel will tend to cancel that correction.
Kenyon et al. (1988) used infrared flux ratios derived from
IRAS satellite observations to obtain from the infrared emission a mass loss rate
of
![]() yr-1.
Whitelock et al.
(1994) found a mass loss rate of
yr-1.
Whitelock et al.
(1994) found a mass loss rate of
![]() yr-1from a mean relation for Miras involving their luminosities.
Finally Birriel et al.
(2000) found a mass loss rate from the proportion of O VI
resonance line emission which is Raman scattered in parts of the wind where
hydrogen is neutral. They obtain a mass loss rate of only
yr-1from a mean relation for Miras involving their luminosities.
Finally Birriel et al.
(2000) found a mass loss rate from the proportion of O VI
resonance line emission which is Raman scattered in parts of the wind where
hydrogen is neutral. They obtain a mass loss rate of only
![]() yr-1. One may wonder whether the low
proportion of scattered photons and the derived lower mass loss rate are due to
dust absorption of some of the far ultraviolet O VI photons. Dust absorption
should be large in that wavelength region.
yr-1. One may wonder whether the low
proportion of scattered photons and the derived lower mass loss rate are due to
dust absorption of some of the far ultraviolet O VI photons. Dust absorption
should be large in that wavelength region.
In our present approach we have tried to make as few assumptions as possible about the shape of the self absorption curve. Our results support the idea that both the permitted Fe II and the forbidden Fe [II] lines are formed in the wind of the cool Mira component, above the regions where absorption by dust is important, except perhaps in the far ultraviolet. No non-LTE effect was found between the populations of levels in the same upper term of permitted lines. However a systematic difference was found between the populations of two upper terms with a very similar upper term excitation potential. The SAC method offers many possibilities for this kind of test.
We note that the SAC method is best applied to lines in the optical region. The populations of the upper levels of many ultraviolet lines appear to have anomalous populations due to selective pumping mechanisms (Hartmann & Johansson 2000).
Acknowledgements
We wish to thank Marie-Odile Mennessier and Patricia Whitelock for useful information about mira variables, Francis Keenan for information about the fluxes tabulated in Crawford et al. (1999) and the anonymous referee. Thanks are due also to R. Viotti for instructive discussions on atomic parameters and to Gerard Muratorio for supplying some gf values. Corinne Rossi, who read a preliminary version of the paper, gave useful advice. D. Kotnik-Karuza acknowledges the kind hospitality of the Institut d'Astrophysique, Paris. This visit was supported by a grant from the French government.
![\begin{table}
\small {
\par\includegraphics[width=17cm, clip]{MS1388t3.eps} }
\end{table}](/articles/aa/full/2002/02/aa1388/img68.gif)
![\begin{table}
\par\small {
\includegraphics[angle=-90, width=19cm, clip]{MS1388t4.eps} }
\end{table}](/articles/aa/full/2002/02/aa1388/img71.gif)