We have observed the host galaxy of GRB 990712 at 1.4 GHz with the Australia Telescope Compact Array, to obtain an estimate of its total star-formation rate. We do not detect a source at the position of the host. The 2
A&A 380, L21-L25 (2001)
DOI: 10.1051/0004-6361:20011484
P. M. Vreeswijk 1 - R. P. Fender 1 - M. A. Garrett 2 - S. J. Tingay 3 - A. S. Fruchter 4 - L. Kaper 1
1 -
Astronomical Institute "Anton Pannekoek'', University of Amsterdam & Center for High Energy
Astrophysics, Kruislaan 403, 1098 SJ Amsterdam, The Netherlands
2 -
Joint Institute for VLBI in Europe (JIVE), Postbus 2, 7990 AA, Dwingeloo, The Netherlands
3 -
Australia Telescope National Facility, Paul Wild Observatory, Locked Bag 194, Narrabri, NSW 2390,
Australia
4 -
Space Telescope Science Institute, 3700 San Martin Drive, Baltimore, MD 21218, USA
Received 13 August 2001 / Accepted 23 October 2001
Abstract
We have observed the host galaxy of GRB 990712 at 1.4 GHz with the Australia Telescope
Compact Array, to obtain an estimate of its total star-formation rate. We do not detect a source
at the position of the host. The 2![]() upper limit of 70
upper limit of 70 ![]() Jy implies that the total
star-formation rate is lower than 100
Jy implies that the total
star-formation rate is lower than 100 ![]() yr-1, using conservative values for the
spectral index and cosmological parameters. This upper limit is in stark contrast with recent
reports of radio/submillimeter-determined star-formation rates of
yr-1, using conservative values for the
spectral index and cosmological parameters. This upper limit is in stark contrast with recent
reports of radio/submillimeter-determined star-formation rates of ![]() 500
500 ![]() yr-1for two other GRB host galaxies. Our observations present the deepest radio-determined
star-formation rate limit on a GRB host galaxy yet, and show that also from the
unobscured radio point-of-view, not every GRB host galaxy is a vigorous starburst.
yr-1for two other GRB host galaxies. Our observations present the deepest radio-determined
star-formation rate limit on a GRB host galaxy yet, and show that also from the
unobscured radio point-of-view, not every GRB host galaxy is a vigorous starburst.
Key words: gamma rays: bursts - radio continuum: galaxies - stars: formation
The gamma-ray bursts (GRBs) for which afterglows have been observed so far, i.e. bursts with a duration longer than roughly two seconds, can be most adequately explained by the collapse of a rapidly rotating, massive star. In this collapsar model (Woosley 1993; Paczynski 1998; MacFadyen & Woosley 1999; MacFadyen et al. 2001), the GRB is produced in narrow cones along the rotational axis of the collapsing progenitor, accompanied by an isotropic supernova explosion of a type similar to SN1998bw (Galama et al. 1998). For a few GRBs the presence of a supernova has been inferred from a bump in the optical afterglow light curve at late times (Bloom et al. 1999a; Reichart 1999; Galama et al. 2000). Moreover, the locations of GRB afterglows coincide with the optical extent of their host galaxies (Bloom et al.2001c; Fruchter et al., in prep.), suggesting that these long-duration GRBs are linked with regions of star formation. The observed GRB location distribution is not expected for the alternative binary neutron star merger model (or a neutron star and a black hole) (Eichler et al. 1989; Narayan et al. 1992), where the kick velocities received from the two supernovae and the time it takes the two compact objects to merge, would cause the GRB to occur kiloparsecs away from the place of birth of the progenitor binary (Bloom et al. 1999b), in at least a few cases. These mergers, however, are expected to be the progenitors of the category of short-duration GRBs (Fryer et al. 1999).
In case the gamma rays come from internal shocks, which is the generally favoured model, a GRB can be observed both in the case of a collapsar and of a merger, i.e. irrespective of its environment. Afterglows are thought to be produced by the interaction of the fireball ejecta with the environment (the flux in the fireball model is proportional to the square root of the density of the circumburst medium, e.g. Wijers & Galama 1999). If mergers would also produce long-duration GRBs, we would have expected a fraction of these to have no X-ray afterglow - namely those which occur outside a galaxy. However, nearly all attempts to detect an X-ray afterglow were successful (e.g. Stratta et al. 2000), which suggests that they are not the result of mergers (assuming the internal shock model). Note that the location argument in favour of the collapsar model does not necessarily hold if the gamma rays are produced by external shocks. In that case the gamma rays themselves are produced by interaction with the circumburst medium, which may mean that all GRBs (both long and short-durations bursts) and their afterglows that occur in low-density environments are not detected.
If GRBs are intimately connected with the deaths of massive stars, they are potential probes of star formation in the early universe. At present, it is not known which type of galaxy produces the bulk of star formation at high redshift: the numerous faint blue galaxies (Ellis 1997), or the ultra-luminous infrared or starburst galaxies (Sanders & Mirabel 1996). Determination of the type of galaxy that gives birth to GRBs can provide important clues to this outstanding issue.
Star-formation rates (SFRs) for several GRB host galaxies have been
estimated from optical nebular emission lines (e.g. [O II]) to
vary from 0.3 ![]() yr-1 for the host of GRB970828
(Djorgovski et al. 2001) to 24
yr-1 for the host of GRB970828
(Djorgovski et al. 2001) to 24 ![]() yr-1 for the host of
GRB980703 (Djorgovski et al. 1998). These values are not yet
corrected for dust extinction, which is difficult to estimate and
which can be quite large. This causes considerable uncertainty in the
SFR values. Recently, very high star-formation rates
(
yr-1 for the host of
GRB980703 (Djorgovski et al. 1998). These values are not yet
corrected for dust extinction, which is difficult to estimate and
which can be quite large. This causes considerable uncertainty in the
SFR values. Recently, very high star-formation rates
(![]() 500
500 ![]() yr-1), have been inferred for GRB980703 and
GRB010222, using radio (Berger et al. 2001) and submillimeter
(Frail et al. 2001) measurements, respectively, which do not suffer from
dust extinction. The question that arises is: do all GRB host
galaxies look like vigorous starburst galaxies when they are observed
at the unobscured radio and submillimeter wavelengths?
yr-1), have been inferred for GRB980703 and
GRB010222, using radio (Berger et al. 2001) and submillimeter
(Frail et al. 2001) measurements, respectively, which do not suffer from
dust extinction. The question that arises is: do all GRB host
galaxies look like vigorous starburst galaxies when they are observed
at the unobscured radio and submillimeter wavelengths?
Due to its relative proximity (z = 0.433), the host of GRB990712
is an excellent GRB host galaxy to study in detail. VLT spectra of the
host show that the galaxy is an H II galaxy (i.e. the spectral
emission lines are produced by H II regions that are being
ionized by O and B stars) and not a galaxy that is hosting an active
galactic nucleus (AGN). The [O II] emission star-formation rate
has been inferred to be
![]() 35+178-25
35+178-25 ![]() yr-1(Vreeswijk et al. 2001). The large errorbars are due to the uncertainty in the estimate of the optical extinction.
yr-1(Vreeswijk et al. 2001). The large errorbars are due to the uncertainty in the estimate of the optical extinction.
To obtain an independent estimate of the SFR in the host galaxy of GRB990712, we performed 1.4 GHz (21 cm) observations with the Australia Telescope Compact Array (ATCA) in March 2001. The radio continuum flux of a normal galaxy (i.e. a galaxy that is not hosting an AGN) is thought to be produced by synchrotron radiation from electrons which are accelerated by supernova remnants, and free-free emission from H II regions (Condon 1992). The radio continuum emission should therefore be well-correlated with very recent star formation, which is strongly supported by the observed far-infrared/radio correlation. The obvious advantage of this method over the optical emission-line measurements is that the radio flux is unaffected by dust extinction, allowing an unobscured view of the star-formation nature of the GRB host.
![\begin{figure}
\par\includegraphics[angle=-90,width=8.5cm,clip]{Dh137_fig.ps}\end{figure}](/articles/aa/full/2001/46/aadh137/img8.gif) |
Figure 1:
The field of the host galaxy of GRB990712 in the optical (greyscale) and radio
(contours). The R-band image was taken with the VLT on 13 July 1999 (Sahu et al. 2000),
only 0.5 days after the burst when the optical counterpart still outshone its host galaxy. Its
position is indicated with a cross, The plotted radio contours are factors of -2 (dashed), 2, 3,
6, 12, 24, 48, and 96 (all solid) times the noise level of 35 |
| Open with DEXTER | |
The host galaxy of GRB990712 was observed with the Australia
Telescope Compact Array (ATCA) between 2001 March 29, 15:06 (MJD
51997.63) and March 30 03:22 (MJD 51998.14). The observations were
performed in the 6D antenna configuration, in two bands centred at
1344 and 1432 MHz respectively, with a total observing time on-source
of 10.18 hr. Absolute flux calibration was achieved using PKS
1934-638; PKS 2101-715 was used as the phase calibrator. Data
reduction was performed using the MIRIAD software
(Sault et al. 1995). Figure 1 shows a uniformly-weighted map
of the region around the host galaxy with a beam size of
![]() arcsec, superposed on an optical image
(Sahu et al. 2000) taken with ESO's Very Large Telescope
(VLT). No source is detected at the host galaxy location to a
2
arcsec, superposed on an optical image
(Sahu et al. 2000) taken with ESO's Very Large Telescope
(VLT). No source is detected at the host galaxy location to a
2![]() limit of 70
limit of 70 ![]() Jy - the noise level of 35
Jy - the noise level of 35 ![]() Jy was
estimated from measuring the sky around the target region. The
theoretical noise limit for the observing time, bandwidth, frequency
and array used is 20
Jy was
estimated from measuring the sky around the target region. The
theoretical noise limit for the observing time, bandwidth, frequency
and array used is 20 ![]() Jy/beam, i.e. less than a factor of two
lower than we obtain. We were unable to achieve a lower noise level
using natural weighting because of sidelobes from bright, nearby
sources.
Jy/beam, i.e. less than a factor of two
lower than we obtain. We were unable to achieve a lower noise level
using natural weighting because of sidelobes from bright, nearby
sources.
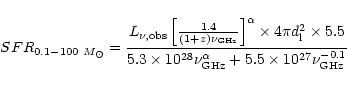
For a normal star-forming galaxy, the radio continuum emission is
proportional to the star-formation rate (Condon 1992):
 |
(1) |
The resulting value for the star-formation rate that we obtain depends
on the assumed spectral index and the luminosity distance, hence on
the adopted cosmology. We therefore calculate the SFR upper limit with
the spectral index ranging from -0.35 to -1.0, typical for normal
radio galaxies, and the cosmologies (h,
![]() ,
,
![]() ,
(0.65, 0.2, 0), and (0.65, 0.3,
0.7), where h is the dimensionless Hubble constant, defined as:
,
(0.65, 0.2, 0), and (0.65, 0.3,
0.7), where h is the dimensionless Hubble constant, defined as:
![]() .
The redshift of the
GRB and its host galaxy is
.
The redshift of the
GRB and its host galaxy is
![]() (Vreeswijk et al. 2001). The resulting luminosity distances
(see Hogg 1999) for these cosmologies are respectively:
(Vreeswijk et al. 2001). The resulting luminosity distances
(see Hogg 1999) for these cosmologies are respectively:
![]() cm,
cm,
![]() cm and
cm and
![]() cm. Inserting our 2
cm. Inserting our 2![]() upper limit of
70
upper limit of
70 ![]() Jy, and the range in spectral indices and luminosity distances,
we obtain the following range for the upper limit on the SFR in the
host of GRB990712:
Jy, and the range in spectral indices and luminosity distances,
we obtain the following range for the upper limit on the SFR in the
host of GRB990712:
![]() yr-1.
yr-1.
| hostofGRB | [OII]flux | reference |
|
|
|
|
| (10-16 ergs-1 cm-2) | ||||||
| 970228 |
|
1 | 0.76 | - | <380
|
5.5 |
| 970508 |
|
2 | 1.6 |
|
<430
|
17 |
| 970828 |
|
3 | 0.3 | - | <360
|
1.2 |
| 980613 | 0.44 | 4 | 4.7 |
|
- | 82 |
| 980703 | 3.04 | 5 | 24 |
|
784 | |
| 990712 |
|
6 | 3.7 |
|
<100 | 58 |
| 991208 |
|
7 | 6.4 |
|
- | 127 |
| 000911 |
|
8 | 2.2 | - | - | 28 |
Table 1 shows the GRB host galaxies for which an [O II] emission-line flux has been reported in the
literature. The H![]() line emission is a more reliable optical estimate of the SFRthan [O II], but this line is usually shifted into the
near-infrared passbands, making it observationally difficult to obtain
the H
line emission is a more reliable optical estimate of the SFRthan [O II], but this line is usually shifted into the
near-infrared passbands, making it observationally difficult to obtain
the H![]() line flux. The listed [O II] flux, which is
corrected for the Galactic foreground extinction, is taken from the
references indicated in the caption. We convert this flux, using (h,
line flux. The listed [O II] flux, which is
corrected for the Galactic foreground extinction, is taken from the
references indicated in the caption. We convert this flux, using (h,
![]() ,
,
![]() and the
calibration from Kennicutt (1998), to obtain an estimate of
the attenuated SFR (Col. 4), i.e. not corrected for dust
extinction. The error in this conversion is roughly 30%. With (h,
and the
calibration from Kennicutt (1998), to obtain an estimate of
the attenuated SFR (Col. 4), i.e. not corrected for dust
extinction. The error in this conversion is roughly 30%. With (h,
![]() ,
,
![]() ,
these SFRestimates need to be scaled down by about 20%.
,
these SFRestimates need to be scaled down by about 20%.
The [O II] emission line method shows that GRB host galaxies
differ widely in their star-formation nature, from 0.3 to
24 ![]() yr-1, i.e. a factor of 80. However, extinction is an
important factor in optical SFR indicators, which could boost these
estimates up to much higher values. A good example is the host galaxy
featured in this paper: GRB990712. Vreeswijk et al. (2001)
estimate the SFR of the host of GRB990712 to be
35+178-25
yr-1, i.e. a factor of 80. However, extinction is an
important factor in optical SFR indicators, which could boost these
estimates up to much higher values. A good example is the host galaxy
featured in this paper: GRB990712. Vreeswijk et al. (2001)
estimate the SFR of the host of GRB990712 to be
35+178-25 ![]() yr-1 from
the [O II] emission line,
64+770-54
yr-1 from
the [O II] emission line,
64+770-54 ![]() yr-1 from H
yr-1 from H![]() and
and
![]()
![]() yr-1 from the 2800 Å flux. These values reflect
the large uncertainty in the dust extinction estimate for this host,
obtained from the observed and expected ratio of H
yr-1 from the 2800 Å flux. These values reflect
the large uncertainty in the dust extinction estimate for this host,
obtained from the observed and expected ratio of H![]() and
H
and
H![]() .
The radio data presented in this paper provide a clear
upper limit to these SFRs of
.
The radio data presented in this paper provide a clear
upper limit to these SFRs of
![]() yr-1, indicating
that the extinction at 2800 Å has been overestimated. In
Table 1 we also list the extinction-corrected SFRs, using
host-galaxy extinction measurements from the literature
(Sokolov et al. 2001; Vreeswijk et al. 2001). Note that the value
for the host of GRB990712 differs from that reported by
Vreeswijk et al. (2001) due to the different cosmologies used.
yr-1, indicating
that the extinction at 2800 Å has been overestimated. In
Table 1 we also list the extinction-corrected SFRs, using
host-galaxy extinction measurements from the literature
(Sokolov et al. 2001; Vreeswijk et al. 2001). Note that the value
for the host of GRB990712 differs from that reported by
Vreeswijk et al. (2001) due to the different cosmologies used.
Recently, very high SFRs have been inferred for two other GRB host
galaxies, not from the optical but through two methods that are not
affected by the dust along the line of sight. From millimeter and
submillimeter wavelength observations, Frail et al. (2001) infer a rate
of ![]() 600
600 ![]() yr-1 for the host of GRB010222. The
host of this burst is faint:
yr-1 for the host of GRB010222. The
host of this burst is faint:
![]() (Fruchter et al. 2001), making it difficult to obtain an [O II] flux measurement. Berger et al. (2001) measure a
1.4 GHz flux of
(Fruchter et al. 2001), making it difficult to obtain an [O II] flux measurement. Berger et al. (2001) measure a
1.4 GHz flux of
![]() Jy for the host of GRB980703 (z=0.966), and
infer a star-formation rate of
Jy for the host of GRB980703 (z=0.966), and
infer a star-formation rate of ![]() 500
500 ![]() yr-1, with
the same method and assumptions as we employ in this paper. The
latter authors use the empirical relation between the far infra-red
(FIR) and radio emission
(van der Kruit 1971; Helou et al. 1985), to estimate the FIR
luminosity of the host of GRB980703 to be that of an ultra-luminous
infra-red galaxy (ULIG or ULIRG, for which
yr-1, with
the same method and assumptions as we employ in this paper. The
latter authors use the empirical relation between the far infra-red
(FIR) and radio emission
(van der Kruit 1971; Helou et al. 1985), to estimate the FIR
luminosity of the host of GRB980703 to be that of an ultra-luminous
infra-red galaxy (ULIG or ULIRG, for which
![]() ). Applying the same relation to our 1.4 GHz
flux of GRB990712 (using
). Applying the same relation to our 1.4 GHz
flux of GRB990712 (using
![]() cm), we find
cm), we find
![]() ,
more than a factor of
20 less luminous in the IR than the host of GRB980703. This
indicates that the host of GRB990712 does not belong to the class of
ULIRGs, although direct IR observations would be needed to definitely
rule out the possibility.
,
more than a factor of
20 less luminous in the IR than the host of GRB980703. This
indicates that the host of GRB990712 does not belong to the class of
ULIRGs, although direct IR observations would be needed to definitely
rule out the possibility.
Our observations of the host of GRB990712 present the deepest radio-determined SFR limit on a GRB host galaxy yet, and show that also when observed at unobscured radio wavelengths, not every host is a vigorous starburst galaxy. How do the [O II] and radio SFRestimates compare in general? The optical SFR estimators, after correcting for internal extinction, tend to underestimate the total SFR, when compared to the FIR and radio methods (e.g. Cram et al. 1998). The host of GRB980703 is a striking example of this: the extinction-corrected SFR is about a factor of 15 lower than the rate estimated from the radio continuum flux (see Table 1). We therefore use the prescription of Hopkins et al. (2001, Eq. (5)) to convert the attenuated SFR estimates of Col. 4 in Table 1 to total SFRs (Col. 7). This conversion is based on an empirical correlation between obscuration and far-infrared luminosity (Wang & Heckman 1996), from which Hopkins et al. (2001) deduce a relation between obscuration and SFR. These numbers can now be compared with SFR methods that do not suffer from dust extinction, such as the 1.4 GHz continuum flux method. For the two host galaxies for which these numbers are available, the values are consistent within the (large) errors.
A large sample of GRBs with redshift determinations (through e.g. rapid spectroscopy of the afterglow) and 1.4 GHz or submillimeter observations of their hosts, can provide an important step toward calibration of the possible relation between GRB number counts and the total star-formation density as a function of look-back time. Different classes of GRBs, if produced by different progenitors, could be used to verify this calibration.
Acknowledgements
PMV is supported by the NWO Spinoza grant 08-0 to E. P. J. van den Heuvel. LK is supported by a fellowship of the Royal Academy of Arts & Sciences in The Netherlands. The Australia Telescope Compact Array is part of the Australia Telescope which is funded by the Commonwealth of Australia for operation as a National Facility managed by CSIRO. PMV kindly thanks David Hogg for providing his code (see Hogg 1999) to verify the obtained luminosity distances. PMV also thanks E. P. J. van den Heuvel for valuable comments.