![\begin{figure}
\includegraphics[width=12cm,clip]{1429f2.eps}\par
\end{figure}](/articles/aa/full/2001/46/aa1429/Timg28.gif) |
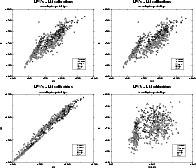
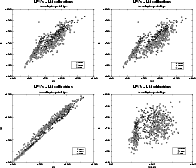
Figure 2: Distribution of the individual estimated K and 12 luminosities according to the assigned kinematical groups and to spectral types. |
As seen in Sect. 2.1 the distribution of O-rich LPVs is clearly bimodal in the diagrams of Fig. 1, separating shell and no-shell stars. This gap may a priori be formed by several scenarios of the circumstellar shell formation, but one must not forget that the sample selection can also induce such an effect. Therefore, we must take both physics and sampling into account when examining the validity of the proposed hypotheses.
![\begin{figure}
\includegraphics[width=12cm,clip]{1429f2.eps}\par
\end{figure}](/articles/aa/full/2001/46/aa1429/Timg28.gif) |
Figure 2: Distribution of the individual estimated K and 12 luminosities according to the assigned kinematical groups and to spectral types. |
![\begin{figure}
\includegraphics[width=12cm,clip]{1429f3.eps}\par
\end{figure}](/articles/aa/full/2001/46/aa1429/Timg29.gif) |
Figure 3: Distribution of the individual estimated K and 25 luminosities according to the assigned kinematical groups and to spectral types. |
Our sample is composed of variable stars observed by HIPPARCOS, i.e., selected from criteria based on visual magnitude. As seen in Paper I, this selection effect is the most prominent in comparison with the other ones: availability of K magnitude and IRAS detection. A priori and with regard to the selection effects, we propose three possible explanations for the striking gap observed for O-rich LPVs in Figs. 1-3:
 |
Figure 4: Distribution of the individual estimated K, 12 and 25 luminosities and IRAS colors of Tc and S stars compared with O and C-rich LPVs. |
First of all, the first hypothesis is not realistic. It has no convincing physical justification and no such behaviour is found in the models. We will thus discard it immediately.
The other two are plausible. Let us examine their coherence using
Fig. 6, which shows the distributions of the individual
estimated K absolute magnitudes and V-K indices from the V and K luminosities estimated for each group. Figure 6 also
distinguishes the spectral types and the envelope thickness. A small
number of stars assigned to the disk 1 or extended disk population have a
25-12 index close to 0. They are marked in the Fig. 6 as
"simuf'' type points.
 |
Figure 5: Distribution of the individual estimated K, 12 and 25 luminosities and IRAS colors of OH stars compared to O and C-rich LPVs. |
In the case of the third hypothesis, when the circumstellar envelope grows more luminous in K, higher values of V-K are initially found; then V-Kdecreases when the envelope expands. The star crosses back over the limit of visibility, being more luminous in K and with a larger V-K index.
In the case of the second hypothesis, the change in the infrared fluxes is rapid and there is no reason for a corresponding drastic change in K luminosity, but the absorption in V band suddenly increases. Thus, the stars belonging to the b group may be only visible (i.e. in our sample) from a more luminous lower limit in K than that of the f group. Briefly, in the second hypothesis, from one side to the other of the gap, the star has the same K luminosity but the K distribution of the sample after the gap can be truncated for faint values because of an increase in V-K. In the third hypothesis the gap corresponds to a time for which the star is invisible. Thereafter it is brighter in K.
At this stage neither hypotheses 2 nor 3 can be rejected. The data available are too scarce to decide between them. The reality may be a mixture of both, but as long as these two hypotheses are considered, it is obvious that the observed gap results from a circumstellar phenomenon. On the contrary, a discontinuity in the stellar evolution along the AGB can be excluded.
The location of carbon stars also reinforces hypothesis 2. Indeed, a few C-rich LPVs have a 25-12 index close to zero but they cannot be stars just reaching the AGB. This is obvious when we examine the Fig. 1 except for the 4 carbon stars belonging to the disk 2 population fainter than -7 mag. However, if we consider these 4 stars as having evolved from O-rich LPVs belonging to the truncated faint part of the b distribution, everything is consistent.
| HIP id | name | types | group | K | 12 | 25 | pec | IRAS sp. | |
| 13502 | R | Hor | MO | ED | -8.40 | -10.81 | -11.49 | Tc? | |
| 70339 | RS | Lup | LC | ED | -8.96 | -10.57 | -11.20 | ||
| 77501 | V | CrB | MC | ED | -8.82 | -11.59 | -12.06 | ||
| 1834 | T | Cas | MO | D2b | -9.00 | -11.37 | -12.05 | 1 15 | |
| 7139 | IM | Cas | SROb | D1 | -8.95 | -11.43 | -12.36 | BD | 1 15 |
| 7598 | V539 | Cas | LO | D1 | -9.30 | -11.50 | -12.43 | BD | 1 16 |
| 12302 | YZ | Per | SROb | D1 | -8.83 | -11.70 | -12.91 | BD | 1 27 |
| 15530 | UZ | Per | SROb | D1 | -8.93 | -11.04 | -12.04 | 1 25 | |
| 46502 | Y | Vel | MO | D1 | -9.01 | -12.01 | -12.79 | 1 23 | |
| 69754 | R | Cen | MO | D1 | -9.60 | -12.18 | -12.79 | BD,He | 1 22 |
| 87668 | V774 | Sgr | LO | D1 | -9.36 | -12.85 | -14.03 | 1 29 | |
| 116705 | SV | Cas | SROa | D1 | -9.31 | -11.74 | -12.70 | 1 25 | |
| 91389 | X | Oph | MO | D1 | -8.16 | -11.11 | -11.69 | OH | 1 15 |
| 32627 | V613 | Mon | SROb | D1 | -8.60 | -10.07 | -10.31 | BD | |
| 89980 | V4028 | Sgr | SROq | D1 | -8.58 | -9.80 | -10.29 | BD | |
| 65835 | R | Hya | MS | D2b | -8.52 | -11.04 | -11.60 | Tc, He | |
| 93820 | R | Aql | MO | ODb | -7.31 | -9.48 | -10.49 | OH, He | |
Copyright ESO 2001