A&A 379, 807-822 (2001)
DOI: 10.1051/0004-6361:20011355
Radio galaxies and magnetic fields in A514
F. Govoni1,2 - G. B. Taylor3 - D. Dallacasa1,2 - L. Feretti2 -
G. Giovannini2,4
1 -
Dipartimento di Astronomia, Univ. Bologna, Via Ranzani 1, 40127 Bologna, Italy
2 - Istituto di Radioastronomia - CNR, via Gobetti 101, 40129 Bologna, Italy
3 - National Radio Astronomy Observatory, Socorro, NM 87801, USA
4 - Dipartimento di Fisica, Univ. Bologna, Via B. Pichat 6/2, 40127 Bologna, Italy
Received 12 June 2001 / Accepted 21 September 2001
Abstract
A514 contains six extended and polarized radio sources located at various projected distances from the cluster center. Here we present a detailed study of these six radio sources in total intensity and polarization using the Very Large Array at 3.6 and 6 cm. Since the radio sources sample different lines of sight across the cluster, an analysis of the Faraday Rotation Measures (RMs) provides information on the strength and the structure of the cluster magnetic field. These sources show a decreasing Faraday Rotation Measure with increasing distance from the cluster center. We estimate the strength of the magnetic field to be  3-7
3-7  G in the cluster center.
From the RM structure across the stronger and more extended sources we estimate the coherence length of the magnetic field to be about 9 kpc at the cluster center.
G in the cluster center.
From the RM structure across the stronger and more extended sources we estimate the coherence length of the magnetic field to be about 9 kpc at the cluster center.
Key words: galaxies: clusters: general - intergalactic medium - magnetic fields - radio continuum: general
The study of the magnetic field in clusters of galaxies is relevant to understand the physical conditions and energetics of the intra-cluster medium (ICM), the cluster formation and evolution,
the origin of the intergalactic magnetic field itself (primordial, Olinto 1997; injected
into the ICM from galactic winds or AGNs, Kronberg et al. 1999;
Völk & Atoyan 1999), and its consequences on primordial star formation
(Pudritz & Silk 1989).
The presence of a synchrotron radio halo in a cluster of galaxies is a direct evidence for the presence of substantial magnetic fields in the cluster. Radio halos are produced by diffuse, non-thermal emission associated with the ICM rather than with a particular galaxy of
the cluster, and have sizes of the order of 1 Mpc (e.g. Coma C, Giovannini et al. 1993).
So far, the studies of the magnetic fields in clusters of galaxies, obtained from different methods,
give somewhat discrepant measurements for the field strengths.
Assuming minimum energy content, (i.e., nearly energy equipartition between the magnetic field and the relativistic particles), measurements of the strength of the magnetic fields in some radio halos have been made, and reveal magnetic field strengths of about 0.1-1
 (Feretti & Giovannini 1996). In the Coma cluster, the equipartition magnetic field is
  0.4 G (Giovannini et al. 1993).
Estimates by Fusco-Femiano et al. (1999), obtained by comparing the diffuse radio emission with the hard X-ray emission in the Coma cluster (assumed to arise from Inverse Compton scattering of the cosmic microwave background of the relativistic electron responsible of the radio emission) give a field of 0.15 G.
Measurements of the magnetic field strength can also be determined in conjunction with X-ray observations of the hot gas, through the study of the Faraday Rotation Measure (RM) of radio sources located inside or behind the cluster.
Strong magnetic fields, from 5 up to the value of 30 G have been found in "cooling flow'' clusters (e.g. 3C 295, Perley & Taylor 1991, Allen et al. 2001; Hydra A, Taylor & Perley 1993) where extremely large Faraday rotations have been revealed, suggesting that the generation of very strong ICM magnetic fields may be connected with
the cooling flow process (Soker & Sarazin 1990; Godon et al. 1998).
On the other hand, significant magnetic fields have also been detected in clusters without a cooling flow: the measurements of Faraday rotation of polarized radiation through the hot ICM leads to a magnetic field of 2-6 G in the Coma cluster (Kim et al. 1990; Feretti et al. 1995). Similarly, the presence of a magnetic field was detected in the cluster A119 (Feretti et al. 1999) through the analysis of the Faraday Rotation in three extended radio galaxies located at different distances from the cluster center. We found that the RM decreases with the distance from the cluster center, and it is consistent with a field strength of
about 5-10 G at the cluster center, depending on the tangling scale. These values are quite similar to the field strength of about 5 G found in the cluster containing the radio source
3C129 (Taylor et al. 2001) by similar analysis. From a statistical study of several clusters, Clarke et al. (2001) obtained magnetic fields of 4-8 G, confirming the previous findings.
By studying the spatial distribution of the RMs we can also estimate the coherence length of the magnetic field. The ICM magnetic field can be tangled on scales much smaller than the typical galaxy size. Crusius-Wätzel et al. (1990), studying the depolarization in 5 strong double sources, found tangling on scales of 1-4 kpc. This is confirmed also by the results on the Coma, A119 and 3C129 clusters (Feretti et al. 1995; Feretti et al. 1999; Taylor et al. 2001).
We note that the field strength measured from the RM may be influenced by the presence of filamentary structures (Eilek 1999) and by local turbulences in the ICM induced by the host galaxy motion within the cluster. Therefore the value estimated by RM arguments is generally higher than the equipartition magnetic field, which refers to the "average'', uniformly distributed
field permeating the cluster (see also Goldsmith & Rephaeli 1993).
Here we present the analysis of the magnetic field in the cluster Abell 514, which is characterized by a clumpy and elongated X-ray surface brightness typically found in clusters associated with a merging process.
No radio halo is reported in the literature for this cluster. We analyzed the image taken from the
NRAO VLA Sky Survey (NVSS, Condon et al. 1998), with a resolution of 45'' and
a sensitivity of 0.45 mJy/beam (see contours in Fig. 1), in a region of about 5' around the cluster center. No evidence for extended-diffuse low surface brightness emission at the noise level was found. Furthermore, we measured the total flux density in the aforementioned region and then we subtracted the contribution of each individual source. The resulting difference is consistent with the absence of diffuse emission.
However A514 contains six moderately strong, extended, and polarized sources located inside or behind the cluster and at different projected distances from the cluster center. Therefore this cluster is well suited for the analysis of the magnetic field through the study of the Faraday Rotation Measure.
We give a brief description of the cluster in Sect. 2. In Sect. 3 we describe the radio observations. In Sect. 4 we present the total intensity and polarization images for all the sources, and in Sect. 5 the X-ray image and the important X-ray parameters are analyzed.
Finally in Sects. 6 and 7 we discuss the Rotation Measure results and the presence of magnetic fields. We assume H0=50 km s-1 Mpc-1 and q0=0.5 throughout the paper. At the distance of A514 (luminosity distance
 Mpc) 1'' corresponds to 1.84 kpc.
A514 (z=0.0714 Fadda et al. 1996) is of richness class 1 (Abell et al. 1989).
It is classified as BM type II-III (Bautz & Morgan 1970) and as Rood-Sastry type F (Rood & Sastry 1971).
![\begin{figure}
\par\includegraphics[width=12cm,clip]{H2937f1.ps}\end{figure}](/articles/aa/full/2001/45/aah2937/Timg20.gif) |
Figure 1:
The 1.4 GHz radio image obtained from the NVSS (contour)
superimposed to the X-ray image of Abell 514 taken from ROSAT
PSPC archive (grey scale).
Radio contour levels are 2, 5, 10, 20, 40, and 80 mJy/beam.
The radio image has an angular resolution of 45''.
The ROSAT image has an angular resolution of 25'' (FWHM) and
has been smoothed with a Gaussian of
 .
The reference point of the image (indicated with a cross in the figure)
was chosen to be the optical center of the cluster
indicated by Abell et al. (1989).
The X-ray center of the cluster is indicated with a star. .
The reference point of the image (indicated with a cross in the figure)
was chosen to be the optical center of the cluster
indicated by Abell et al. (1989).
The X-ray center of the cluster is indicated with a star. |
| Open with DEXTER |
Figure 1 shows the radio image at 1.4 GHz obtained from the NVSS, overlaid on the X-ray image obtained by us from the ROSAT PSPC archive. The reference point of the image (indicated with a cross in the figure) was chosen to be the optical center of the cluster indicated by Abell et al. (1989) at
 47
47 40
40 ,
,
 20
20 25.7
25.7 .
The X-ray surface brightness is rather smooth, without any outstanding peak. We adopted as X-ray center of the cluster the highest X-ray brightness peak not related to any point-like emission, at position
4813,
202718
.
The X-ray surface brightness is rather smooth, without any outstanding peak. We adopted as X-ray center of the cluster the highest X-ray brightness peak not related to any point-like emission, at position
4813,
202718
 .
The X-ray center of the cluster appears shifted to the East with respect the optical center of about 8.
In Fig. 1 the X-ray center of the cluster is indicated with a star. In Sect. 5 we will discuss in greater detail the X-ray emission of A514 and its implications on the parameter estimates.
.
The X-ray center of the cluster appears shifted to the East with respect the optical center of about 8.
In Fig. 1 the X-ray center of the cluster is indicated with a star. In Sect. 5 we will discuss in greater detail the X-ray emission of A514 and its implications on the parameter estimates.
Here we examine multi-wavelength Very Large Array (VLA![[*]](/icons/foot_motif.gif) ) observations of six radio sources within or behind cluster Abell 514
indicated by labels in Fig. 1. The two radio galaxies which lie close to
the cluster center (B1, B2) show a narrow-angle-tailed structure, the radio galaxy D is a tailed, while the other two radio galaxies (A, C) are FRII type radio galaxies. The source E located in the cluster periphery is classified as a quasar.
) observations of six radio sources within or behind cluster Abell 514
indicated by labels in Fig. 1. The two radio galaxies which lie close to
the cluster center (B1, B2) show a narrow-angle-tailed structure, the radio galaxy D is a tailed, while the other two radio galaxies (A, C) are FRII type radio galaxies. The source E located in the cluster periphery is classified as a quasar.
We derive the Rotation Measures (RM) of the radio sources, which, together with the X-ray data, provide information about the magnetic field in the cluster.
Table 1:
Pointing and VLA observations of A514.
| Name |
Other Name |
Label |
RA |
DEC |
Frequency |
Config. |
Date |
Duration |
| |
|
|
(J2000) |
(J2000) |
(MHz) |
|
|
(Hours) |
| J0447-2014 |
PKS 0445-203 |
A |
04:47:12.8 |
-20:13:58.0 |
4535/4885 |
BnA, CnB |
Oct.99, Mar.00 |
1.2 |
| |
|
|
|
|
8085/8465 |
BnA, CnB |
Oct.99, Feb.00 |
1.2 |
| J0448-2026 |
|
B1 |
04:48:03.0 |
-20:26:31.0 |
4535/4885 |
BnA, CnB |
Oct.99, Mar.00 |
3.0 |
| |
|
|
|
|
8085/8465 |
BnA, CnB |
Oct.99, Feb.00 |
2.6 |
| J0448-2025 |
|
B2 |
04:48:10.5 |
-20:24:56.0 |
4535/4885 |
BnA, CnB |
Oct.99, Mar.00 |
3.0 |
| |
|
|
|
|
8085/8465 |
BnA, CnB |
Oct.99, Feb.00 |
2.6 |
| J0448-2005 |
|
C |
04:48:21.7 |
-20:04:48.0 |
4535/4885 |
BnA, CnB |
Oct.99, Mar.00 |
1.2 |
| |
|
|
|
|
8085/8465 |
BnA, CnB |
Oct.99, Feb.00 |
1.2 |
| J0448-2032 |
PKS 0446-206 |
D |
04:48:30.4 |
-20:31:49.0 |
4535/4885 |
BnA, CnB |
Oct.99, Mar.00 |
3.0 |
| |
|
|
|
|
8085/8465 |
BnA, CnB |
Oct.99, Feb.00 |
2.6 |
| J0448-2044 |
PKS 0446-208 |
E |
04:48:59.0 |
-20:44:51.0 |
4535/4885 |
BnA, CnB |
Oct.99, Mar.00 |
1.2 |
| |
|
|
|
|
8085/8465 |
BnA, CnB |
Oct.99, Feb.00 |
1.2 |
Column 1: source name; Col. 2: other name; Col. 3: label name;
Cols. 4, 5: pointing position (RA, DEC); Col. 6: observation frequencies; Col. 7: VLA configuration; Col. 8: dates of observation; Col. 9: duration of observation.
The radio sources were observed with the VLA at two frequencies within the 6 cm band and at two frequencies within the 3.6 cm band with a bandwidth of 50 MHz. In Table 1 we provide details of the observations. We note that given the southern declination of A514, the VLA
was used in hybrid configurations (BnA, CnB) in order to have roughly circular restoring beams.
![\begin{figure}
\par\includegraphics[width=18cm,clip]{H2937f2.ps}\end{figure}](/articles/aa/full/2001/45/aah2937/Timg27.gif) |
Figure 2:
Left: image of J0447-2014 (A514A) at 3.6 cm with an angular resolution of
 .
The rms noise level is 0.027 mJy/beam. The peak is 29.6 mJy/beam. Right: image of J0447-2014 (A514A) at 6 cm with an angular resolution of
.
The rms noise level is 0.028 mJy/beam. The peak is 47.2 mJy/beam. In both images contour levels are: -0.1, 0.1, 0.2, 0.4, 0.8, 1.6, 3.2, 6.4, 12.8, and 25.6 mJy/beam. The lines represent the orientation of the
electric vector (E-field) and are proportional in length to the fractional polarization ( .
The rms noise level is 0.027 mJy/beam. The peak is 29.6 mJy/beam. Right: image of J0447-2014 (A514A) at 6 cm with an angular resolution of
.
The rms noise level is 0.028 mJy/beam. The peak is 47.2 mJy/beam. In both images contour levels are: -0.1, 0.1, 0.2, 0.4, 0.8, 1.6, 3.2, 6.4, 12.8, and 25.6 mJy/beam. The lines represent the orientation of the
electric vector (E-field) and are proportional in length to the fractional polarization (
 ). ). |
| Open with DEXTER |
The phase calibration was performed using the secondary calibrator 0457-234. The flux-density scale and the absolute polarization position angle were calibrated by observing 3C 48. The instrumental polarization of the antennas was corrected using 0457-234 and also 0530+135 in CnB configuration observed over a wide range of parallactic angles.
Images in all Stokes parameters were produced with the NRAO AIPS package following the standard procedures. Self calibration was applied to minimize the effect of amplitude and phase uncertainties of atmospheric and instrumental origin. The (u, v) data at the same frequencies but from different configurations were first handled separately and then added together.
The images of the polarized intensity
P=(Q2+U2)1/2, the degree of polarization m=P/I and the position angle of polarization
 were derived from the I, Q and U images. Total intensity images have been produced by averaging the two frequencies in the same band (4535/4885 MHz; 8085/8465 MHz) while U and Q images have been obtained for each frequency separately.
In Table 2 we give the parameters for the total intensity images at 1.6'' (3 kpc) resolution. The total flux density was estimated after the primary beam correction. In all the radio images presented in this work contours are total intensity while vectors represent the orientation of the projected E-field and their length is proportional to the fractional polarization. In the polarization images, points with error in fractional polarization greater than  were clipped. In the following we present the individual sources.
In the Digitized Sky Survey (DSS) image from the UK Schmidt Telescope there is a very faint
optical object coincident with the radio source. No redshift is available, but the object appears fainter by about 2 magnitudes than the other cluster members. Its peripheral position and optical properties suggest that it is a background source.
This radio source was observed by Owen et al. (1996) in a VLA Survey of radio source in Abell clusters. They excluded this object from their complete sample of radio galaxies in Abell Cluster because the source is at a projected distance larger than 0.3 Abell radii. Their radio observations were made with the VLA at 1.4 GHz in B and C array. They measured a total flux density of 270 mJy obtained by fitting the unresolved source with a Gaussian model.
Our observations resolve the radio source. In Fig. 2 we show the radio images at 3.6 cm and 6 cm with an angular resolution of 1.6''. The maximum projected angular size of the source is about 12''. At both frequencies, the radio source shows a double structure. An extension in the North-West side is visible in the images.
The source is polarized at 3.6 cm and 6 cm, with similar values of the polarization percentage.
The fractional polarization is 5 in the northern lobe and 4
in the southern lobe. The extended emission in the North-West is polarized at 6 cm (about 10)
while at 3.6 cm the sensitivity is not enough to reveal any significant polarized emission and we only set an upper limit of about 13
to the fractional polarization.
in the northern lobe and 4
in the southern lobe. The extended emission in the North-West is polarized at 6 cm (about 10)
while at 3.6 cm the sensitivity is not enough to reveal any significant polarized emission and we only set an upper limit of about 13
to the fractional polarization.
![\begin{figure}
\par\includegraphics[width=8.8cm,clip]{H2937f3.ps}\end{figure}](/articles/aa/full/2001/45/aah2937/Timg31.gif) |
Figure 3:
Image of J0447-2014 (A514A) at 3.6 cm with an angular resolution of
 .
Contour levels are: -0.07, 0.07, 0.1, 0.14, 0.20, 0.28, 0.40, 0.56, 0.79,
1.12, 1.58, 2.24, 3.17, 4.48, 6.34 mJy/beam. The rms noise level is 0.023 mJy/beam.
The peak is 19.1 mJy/beam. .
Contour levels are: -0.07, 0.07, 0.1, 0.14, 0.20, 0.28, 0.40, 0.56, 0.79,
1.12, 1.58, 2.24, 3.17, 4.48, 6.34 mJy/beam. The rms noise level is 0.023 mJy/beam.
The peak is 19.1 mJy/beam. |
| Open with DEXTER |
In Fig. 3 we present the same source at 3.6 cm with the highest angular resolution.
The image shows the unresolved nucleus at position:
 4713.15,
 201403
.
For this component we estimate a spectral index
201403
.
For this component we estimate a spectral index
 (where
  is defined as
 ); at this resolution, this quite steep spectrum in the compact component could be due to the contamination of other structures in the source. We found a spectral index
 0.9 and
0.8 respectively in the northern and in the southern lobe.
0.9 and
0.8 respectively in the northern and in the southern lobe.
Column 1: source name; Col. 2: observation wavelength; Col. 3: rms noise; Col. 4: peak brightness; Col. 5: flux density.
A 1.4 GHz image is presented in Owen et al. (1993) who measured a total flux density of 95 mJy.
They considered this galaxy to be a member of the cluster.
In Fig. 4 we show the total intensity and polarization images at 3.6 cm and at 6 cm
with an angular resolution of 1.6''. The source shows a Narrow-Angle Tail (NAT) structure
and in projection it is located near the cluster center. In our 6 cm image the source has a size of 66'' (120 kpc). At 3.6 cm the head is readily visible, while most of the low brightness
emission in the tail is below the sensitivity of the present observations. The mean spectral index is
 in the head while it is steeper (
 )
in the tail.
At both wavelengths the head is 4
polarized, while the tail is polarized (5)
at 6 cm but not detected in polarized flux at 3.6 cm. In the tail, at 3.6 cm, we quote an upper limit of 26
to the fractional polarization. Due to its low polarization this source was not used
to study the rotation measure.
)
in the tail.
At both wavelengths the head is 4
polarized, while the tail is polarized (5)
at 6 cm but not detected in polarized flux at 3.6 cm. In the tail, at 3.6 cm, we quote an upper limit of 26
to the fractional polarization. Due to its low polarization this source was not used
to study the rotation measure.
![\begin{figure}
\par\includegraphics[width=18cm,clip]{H2937f4.ps}\end{figure}](/articles/aa/full/2001/45/aah2937/Timg51.gif) |
Figure 4:
Left: image of J0448-2026 (A514B1) at 3.6 cm with an angular resolution of
.
The rms noise level is 0.019 mJy/beam. The peak is 4.1 mJy/beam. Right: image of J0448-2026 (A514B1) at 6 cm with an angular resolution of
.
The rms noise level is 0.018 mJy/beam. The peak is 8.2 mJy/beam. In both images contour levels are: -0.06, 0.06, 0.12, 0.24, 0.48, 0.96, 1.92, 3.84, and 7.68 mJy/beam. Superimposed lines represent the orientation of the electric vector (E-field) and are proportional in length to the fractional polarization (
 ). ). |
| Open with DEXTER |
![\begin{figure}
\par\includegraphics[width=16cm,clip]{H2937f5.ps}\end{figure}](/articles/aa/full/2001/45/aah2937/Timg52.gif) |
Figure 5:
Top: image of J0448-2025 (A514B2) at 3.6 cm with an angular resolution of
.
The peak is 9.1 mJy/beam. Bottom: image of J0448-2025 (A514B2) at 6 cm
with an angular resolution of
.
The peak is 11.4 mJy/beam. In both images contour levels are: -0.06, 0.06, 0.12, 0.24, 0.48, 0.96, 1.92, 3.84, and 7.68 mJy/beam and the rms noise level is 0.017 mJy/beam. Superimposed lines represent the orientation of the electric vector (E-field) and are proportional in length to the fractional polarization (
 ). ). |
| Open with DEXTER |
Slee et al. (1994) identified the host galaxy as a D galaxy. The radio source morphology is that of a head tail source. The source was also studied by Owen et al. (1993, 1997) to be a member of the cluster. A 1.46 GHz image is shown in Owen et al. (1993) who calculated a total flux density of 119 mJy at this frequency.
In Fig. 5 we show the total intensity and polarization images obtained at 3.6 cm and at 6 cm. In both images the morphology of the radio galaxy is well defined as tailed elongated to the West. At 6 cm the total intensity radio emission reaches an extension of 50'', while at the same wavelength the polarized emission is detected only out to 25'' from the core. At both wavelengths the percentage of polarization is 4
in the head. The polarization along the tail is 8
at 6 cm. The mean spectral index is
0.5 in the head while it becomes steeper in the brightest part of the tail,
1.2.
![\begin{figure}
\par\includegraphics[width=18cm,clip]{H2937f6.ps}\end{figure}](/articles/aa/full/2001/45/aah2937/Timg53.gif) |
Figure 6:
Left: image of J0448-2005 (A514C) at 3.6 cm with an angular resolution of
.
The peak is 0.9 mJy/beam. Right: image of J0448-2005 (A514C) at 6 cm with an angular resolution of
.
The peak is 1.6 mJy/beam. In both images contour levels are: -0.07, 0.07, 0.14, 0.28, 0.56, 1.12, 2.24, 4.48, and 8.96 mJy/beam and the rms noise level is 0.024 mJy/beam. Superimposed lines represent the orientation of the electric vector (E-field) and are proportional in length to the fractional polarization (
). |
| Open with DEXTER |
No reference for this radio source has been found in the literature and no optical identification is seen on the DSS. Since the host galaxies of radio sources are typically bright ellipticals, we expect for the parent galaxy an absolute R magnitude at least of MR=-20.0 (Auriemma et al. 1977) which corresponds to an apparent magnitude mR=18.2 at the cluster redshift. A galaxy with this apparent magnitude would be readily seen in the DSS if the galaxy belongs to
the cluster. Due to the absence of the optical identification and to the peripheral location of the source with respect to the cluster center, we suggest that this object is a background source.
In Fig. 6 we show the images of J0448-2005 at 3.6 cm and at 6 cm with an angular resolution of 1.6''. The maximum projected angular size of the source is about 22''.
The radio source morphology is similar to FR-II type radio galaxies with the brightest regions at the outer edges of the images. The full resolution 3.6 cm image (Fig. 7) reveals also a compact component near the center of the radio source. The spectral index in this region is 0.4 suggesting that it could harbor the source core. In the eastern lobe the mean spectral index is 1.0 while in the western lobe it is 1.2. No polarized emission is detected from the core while the two lobes are strongly polarized at both wavelengths - the western lobe is 14
polarized, and the eastern lobe is 7
polarized.
This radio galaxy, belonging to A514 (Owen et al. 1993), is located in the South-East corner of the cluster, and appears as an FRI in the high resolution image, but is an extended
tailed radio source (see Fig. 1). In Fig. 8 we show the images of J0448-2032 at 3.6 cm and at 6 cm. In both images the synthesized restoring beam is a circular Gaussian with a FWHM of 1.6''. The radio images reveal a bright unresolved core and two oppositely directed jets. The jet to the North is well collimated up to about 20
where it flares, widening and bending slightly before diffusing into the Northern lobe. The jet to the South
is much shorter (a few arcsec), and its emission blends rapidly into the Southern lobe. The structure of the southern lobe suggests a smooth bending at a small angle along the line of sight.
The surface brightness of this lobe, and possibly the Northern lobe as well, fades gradually.
The maximum projected angular size is about 85'', and in the radio images presented here we do not detect the low brightness southern tail clearly visible in the NVSS image (see Fig. 1)
and in the image at 1.46 GHz of Owen et al. (1993). At this frequency, the total flux density calculated by Owen et al. (1993) is 502 mJy. In our images no polarized emission is detected in the core region. At both wavelengths the jet on the North side has an average polarization percentage of 7
and the percentage of polarization increases along the jet with distance from the core. Although the southern jet is very short and extends only for about two resolution elements, the jet has an average polarization percentage of 5.
This last measure is, however, uncertain given that the jet is rather short and is embedded in the southern lobe emission. Both lobes are strongly polarized at both 6 and 3.6 cm. At both wavelengths the lobe on the North side has a polarization percentage of about 12,
and the lobe on the South has a polarization percentage of about 16.
We found an inverted spectrum (
-0.1) in the core and a mean spectral index
1.1 in both brighter parts of the lobes.
This source has been identified with a Quasar at a redshift 1.894 (Osmer et al. 1994).
In Fig. 9 we show the images at 3.6 cm and at 6 cm. The maximum angular size of the source is 55'' corresponding to a linear size of about 450 kpc. A collimated knotty jet starts from the core toward the West. At a distance of about 25'' from the core the jet bends
to the North. The hot-spots on the West and East sides are slightly misaligned with respect to the
core at angles of 21
and 18
respectively if we assume that the source axis is defined by the jet. At the location of the knot in the jet the polarization at 6 cm increases.
The jet on the East side is not visible.
Polarized emission at the level of 2
is detected in the core. The polarization along the jet is detected at 6 cm and not at 3.6 cm, probably because of the sensitivity limit. At 3.6 cm we quote an upper limit of about 20% to the fractional polarization. At the jet bend the percentage of polarization is about 11
at both frequencies. At both wavelengths the hot-spot on the West side has a polarization percentage of about  ,
while the hot-spot on the East has a polarization percentage of about 7.
,
while the hot-spot on the East has a polarization percentage of about 7.
![\begin{figure}
\par\includegraphics[width=8.8cm,clip]{H2937f7.ps}\end{figure}](/articles/aa/full/2001/45/aah2937/Timg55.gif) |
Figure 7:
Image of J0448-2005 (A514C) at 3.6 cm with an angular resolution of
.
Contour levels are: -0.07, 0.07, 0.10, 0.14, 0.20, 0.28 mJy/beam. The rms noise level is 0.02 mJy/beam. The peak is 0.29 mJy/beam. |
| Open with DEXTER |
We note that the source structure is characterized by the core (
0.5) and two compact hot-spots (
1.2 and 1.3 in the Western and Eastern hot-spots respectively), while the radio lobes are below our detection limit.
![\begin{figure}
\par\includegraphics[width=18cm,clip]{H2937f8.ps}\end{figure}](/articles/aa/full/2001/45/aah2937/Timg56.gif) |
Figure 8:
Left: image of J0448-2032 (A514D) at 3.6 cm with an angular resolution of
.
The rms noise level is 0.018 mJy/beam. The peak is 7.0 mJy/beam.
Right: image of J0448-2032 (A514D) at 6 cm with an angular resolution of
.
The rms noise level is 0.019 mJy/beam. The peak is 6.4 mJy/beam. In both images contour levels are:
-0.06, 0.06, 0.12, 0.24, 0.48, 0.96, 1.92, and 3.84 mJy/beam. Superimposed lines represent the orientation of the electric vector (E-field) and are proportional in length to the
fractional polarization (
). |
| Open with DEXTER |
![\begin{figure}
\par\includegraphics[width=15cm,clip]{H2937f9.ps}\end{figure}](/articles/aa/full/2001/45/aah2937/Timg57.gif) |
Figure 9:
Top: image of J0448-2044 (A514E) at 3.6 cm with an angular resolution of
.
The rms noise level is 0.03 mJy/beam. The peak is 48.9 mJy/beam.
Bottom: image of J0448-2044 (A514E) at 6 cm with an angular resolution of
.
The rms noise level is 0.026 mJy/beam. The peak is 65.3 mJy/beam. In both images contour levels are:
-0.1, 0.1, 0.2, 0.4, 0.8, 1.6, 3.2, 6.4, 12.8, and 25.6 mJy/beam. Superimposed lines represent the orientation of the electric vector (E-field) and are proportional in length to the
fractional polarization (
 ). ). |
| Open with DEXTER |
From observations with the Einstein Imaging Proportional Counter, Jones & Forman (1999), show that the cluster A514 has at least three mass condensations with different X-ray luminosities.
A514 was also studied by Ebeling et al. (1996) in a X-ray flux-limited sample
of 242 Abell cluster of galaxies compiled from the ROSAT All Sky Survey (RASS) data in the soft X-ray energy band (0.1-2.4 KeV). They published a X-ray luminosity in the energy band 0.1-2.4 KeV
of
 erg/s and adopted the
 relation to derive an estimated gas temperature of 3.6 keV.
The cluster A514 has been the target of X-ray observations with the ROSAT PSPC, for a total exposure time of 18000 s. In Fig. 1 (grey scale) and in Fig. 10 (contours) we show the X-ray images in the 0.5-2 keV band obtained from the ROSAT public archive by binning the photon event table in pixels of 15'' and by smoothing the image with a Gaussian of
.
As already pointed out by Bliton et al. (1998), the X-ray brightness distribution of A514 is clumpy and elongated to the South-East direction.
Given its irregular and asymmetric X-ray emission, the cluster brightness distribution cannot be described by a hydrostatic isothermal model. However, in order to estimate the gas parameters
necessary in the calculation of the magnetic field we attempted a fit to a portion of the cluster which looks approximately regular.
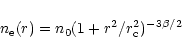
Therefore, part of the X-ray brightness image was fitted with a hydrostatic isothermal model (Cavaliere & Fusco-Femiano 1981):
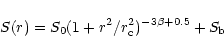 |
(1) |
where S0 is the central surface brightness,  is the core radius, and
  is the ratio between the galaxy and the gas temperatures.
It is important to note that due to the cluster irregularity, the obtained -model parameters are strongly dependent on the choice of the centroid and the portion of the X-ray surface
brightness used in the fit. Different attempts were carried out to test reasonable values of the X-ray parameters. In Fig. 11 we show the radial profile of the X-ray surface brightness obtained by integrating the PSPC counts over concentric rings of 15'' in radius, after subtracting discrete X-ray sources and considering only the X-ray emission from North to South on the West side of the centroid. In this way we have excluded from the calculation all the
irregular X-ray extension in the South-East side. As discussed in Sect. 2, the centroid of the X-ray emission was taken at the position of the X-ray peak
4813,
202718
.
This is approximately coincident with one of the X-ray peaks given by Jones & Forman (1999).
The best fit, reported in Fig. 11 as a solid line, only provides a rough approximation to the data (reduced  3.9). From this fit we obtain a core radius
 kpc and
 .
The large uncertainty (at one sigma level of significance) obtained for the parameters reflects the irregular cluster structure.
.
The large uncertainty (at one sigma level of significance) obtained for the parameters reflects the irregular cluster structure.
Assuming a cluster temperature of 3.6 keV and varying the -model parameters within their
interval of confidence we obtain a central density in the range 0.44-0.50  10-3 cm-3.
Polarized radiation from cluster and background radio galaxies may be rotated by Faraday effect if magnetic fields are present in the Intra Cluster Medium (ICM) together with substantial ionized material. In this case, the observed polarization angle (
 )
is related to the intrinsic polarization angle (
)
is related to the intrinsic polarization angle (
 )
through:
)
through:
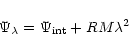 |
(2) |
where the Rotation Measure (RM) is related to the electron density,  and magnetic field along the line of sight
 through the cluster according to:
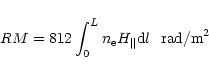 |
(3) |
where L in kpc, is the path-length through the ICM,
is in G and
in cm-3.
The observed RM in a radio galaxy is the sum of the contributions to the RM from all magneto-ionic components along the line of sight. The RM distribution of radio sources
can therefore be used to derive information on the magnetic field along line of sights
crossing different regions of the cluster.
![\begin{figure}
\par\includegraphics[width=8.8cm,clip]{H2937f10.ps}\end{figure}](/articles/aa/full/2001/45/aah2937/Timg73.gif) |
Figure 10:
X-ray PSPC image of the cluster A514. The image has been smoothed with a Gaussian with  ''. Contour levels are: 0.96, 1.36, 1.92, 2.72, 3.84, 5.43, 7.72, and 10.86 counts/pixel ( ''. Contour levels are: 0.96, 1.36, 1.92, 2.72, 3.84, 5.43, 7.72, and 10.86 counts/pixel (
 15
).
15
). |
| Open with DEXTER |
![\begin{figure}
\par\includegraphics[width=8.8cm,clip]{H2937f11.ps}\end{figure}](/articles/aa/full/2001/45/aah2937/Timg74.gif) |
Figure 11:
Fit obtained from the surface brightness profile after subtracting all the discrete sources and considering only the X-ray emission from North to South on the West side of the centroid. |
| Open with DEXTER |
![\begin{figure}
\par\includegraphics[width=8.8cm,clip]{H2937f12.ps}\end{figure}](/articles/aa/full/2001/45/aah2937/Timg75.gif) |
Figure 12:
The electric vector position angle as a function of  and the derived RM fits for some locations in the radio source J0448-2032 (A514D). This is an example of how the RM values have been derived throughout.
 |
| Open with DEXTER |
We derived the images of the rotation measure using the position angles obtained at the 4 frequencies 4535, 4885, 8085 and 8465 MHz with a resolution of 1.6''. Following the definition in Eq. (2), the Faraday RMs were obtained by performing a least-squares fit of the polarization angle images at each pixel as a function of .
The pixels in which the uncertainty in the polarization angle exceeds
 were blanked. For each target, except A514B1 where the polarized emission is too weak, an image of the RM was obtained.
In Fig. 12 we give examples of RM fits in the source A514D. The images and the histograms of the RM distribution are presented in Figs. 14-18.
In each caption we give a brief description of the RM distribution.
Column 1: source name; Col. 2: distance from the cluster center (arcmin); Col. 3: maximum absolute value of RM; Col. 4: average value of RM; Col. 5: RM dispersion; Col. 6: cluster member.
In galactic coordinates A514 is located at l=219 and b=-36.
The Galactic contribution to the RM in the region of A514 is expected to be about -16 rad/m2 based on the average of the RM galactic contribution published by Simard-Normandin et al. (1981) for sources near the cluster. The aforementioned value is consistent with the RM we derive for the sources located in the cluster periphery. Hereafter we do not apply the correction of the galactic RM since we are most interested in the differential RM at various cluster locations.
In the Table 3 we report the maximum absolute value, the mean, and the  of the RM values for the sources ordered according to an increasing projected distance from the X-ray
cluster center. We expect a contribution to the
of the RM values for the sources ordered according to an increasing projected distance from the X-ray
cluster center. We expect a contribution to the
 from the noise in the measurements at a level of 10 rad/m2.
Table 3 shows that the innermost sources have the largest
and highest absolute RMs, and that these values fall with increasing projected distance from the cluster center. This result is consistent with the interpretation that the external Faraday screen can be the same for all 5 sources, i.e., the radial profile of
in Fig. 13
is due to the intracluster medium in A514, whose differential contribution depends on how much
magneto-ionized medium is crossed by the polarized emission. Thus, the data show good evidence for the existence of magnetic fields associated with the intracluster medium.
The RM images show fluctuations on scales of about 5'' (9 kpc at the cluster redshift),
therefore we can consider this value as the coherence length of the magnetic field. This scale can be primarily evaluated from the RM structure across the stronger and more extended source J0448-2032 (A514D) and this value is consistent with coherence length of the magnetic field found
in previous works in the literature see e.g. Coma (Feretti et al. 1995),
A119 (Feretti et al. 1999) and 3C129 (Taylor et al. 2001).
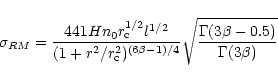
The determination of the strength of the magnetic field in a cluster depends on several assumptions, including the model for the X-ray emitting gas distribution and the magnetic field structure.
The effect of a Faraday screen with different gas density distributions and with a tangled magnetic
field has been analyzed by several authors (Lawler & Dennison 1982; Tribble 1991; Felten 1996). Assuming a randomly oriented magnetic field in cells of uniform size and strength, and a gas density distribution given by the hydrostatic isothermal
model (Cavaliere & Fusco-Femiano 1981) i.e.:
 |
(4) |
where n0 is the central (electron) density, and
is the core radius of the gas distribution, the RM dispersion at different projected distances from the cluster center
was evaluated by Feretti et al. (1995) and Felten (1996) by solving the integral of Eq. (3):
 |
(5) |
where  is the Gamma function,
is the core radius in kpc, and l is the size of
each cell in kpc, the central gas density n0 is in cm-3 and H is in G; and it is assumed that the source is as distant from the observer as the cluster center.
is the Gamma function,
is the core radius in kpc, and l is the size of
each cell in kpc, the central gas density n0 is in cm-3 and H is in G; and it is assumed that the source is as distant from the observer as the cluster center.
![\begin{figure}
\par\includegraphics[width=8.8cm,clip]{H2937f13.ps}\end{figure}](/articles/aa/full/2001/45/aah2937/Timg83.gif) |
Figure 13:
Values of
versus the distance from the X-ray cluster center. The solid line shows the radial profile of
as expected from Eq. (5), up to a distance covering the detected cluster X-ray emission. |
| Open with DEXTER |
For the cluster galaxies J0448-2025 (A514B2) and J0448-2032 (A514D), using the gas parameters calculated from the -model fit, the values of
fit fairly well in the model described above and are consistent with a magnetic field strength in the range 3-7
for a cell size of about 9 kpc. The uncertainty in the magnetic field strength is dominated by errors in the gas parameters calculated from the -model fit. Assuming the above magnetic field, the cell size, and the -model fit calculated for A514, we derived the radial profile
of
expected from Eq. (5). This is plotted as a solid line in Fig. 13, up to a distance corresponding to the extent of the cluster X-ray emission
above the background.
The calculated
of the background sources (A514A, A514C, A514E) is generally higher than that expected from the absence of cluster contribution at these large projected distances from the cluster center. This may be due effects internal to the radio sources, to local effects of the host galaxies or to some other effects along the line of sight.
The model we used to derive the magnetic field strength is oversimplified and has the following
limitations: (1) the radio galaxies belonging to the cluster can be at different locations
along the line of sight; (2) the cluster shows an irregular X-ray emission, therefore the described King density model is only a rough approximation; and (3) the magnetic field structure is likely to be more complicated than assumed.
Even allowing for the uncertainties related to the previous computation, the observational evidence favors the existence of a strong magnetic field in the intergalactic medium of A514, over a wide scale of about 1.4 Mpc in diameter.
At the cluster center the energy density in the magnetic field results about 4-24
of the thermal energy density.
![\begin{figure}
\par\includegraphics[width=17cm,clip]{H2937f14.ps}
\end{figure}](/articles/aa/full/2001/45/aah2937/Timg84.gif) |
Figure 14:
Left: the image of the rotation measure in A514A ( J0447-2014), computed using the polarized angle images at the frequencies 4535, 4885, 8085 and 8465 MHz with a resolution of 1.6''. The contours refer to the total intensity image at 3.6 cm. Right: the histogram of the rotation measure for all significant pixels. The values of RM range between -150 rad/m2 and 100 rad/m2. The < RM> is -19 rad/m2 and the
is 48 rad/m2. |
| Open with DEXTER |
![\begin{figure}
\includegraphics[width=17cm,clip]{H2937f15.ps}\end{figure}](/articles/aa/full/2001/45/aah2937/Timg85.gif) |
Figure 15:
Left: the image of the rotation measure in A514B2 ( J0448-2025), computed using the polarized angle images at the frequencies 4535, 4885, 8085 and 8465 MHz with a resolution of 1.6''. The contours refer to the total intensity image at 3.6 cm. Right: the histogram of the rotation measure for all significant pixels. The values of RM range between -50 rad/m2 and 250 rad/m2. The < RM> is 104 rad/m2 and the
is 63 rad/m2. |
| Open with DEXTER |
![\begin{figure}
\par\includegraphics[width=14.5cm,clip]{H2937f16.ps}
\par\end{figure}](/articles/aa/full/2001/45/aah2937/Timg86.gif) |
Figure 16:
Left: the image of the rotation measure in A514C ( J0448-2005), computed using the polarized angle images at the frequencies 4535, 4885, 8085 and 8465 MHz with a resolution of 1.6''. The contours refer to the total intensity image at 3.6 cm. Right: the histogram of the rotation measure for all significant pixels. The values of RM range between -80 rad/m2 and 50 rad/m2. The < RM> is -19 rad/m2 and the
is 24 rad/m2. |
| Open with DEXTER |
![\begin{figure}
\includegraphics[width=14.5cm,clip]{H2937f17.ps}\end{figure}](/articles/aa/full/2001/45/aah2937/Timg87.gif) |
Figure 17:
Left: the image of the rotation measure in A514D ( J0448-2032), computed using the polarized angle images at the frequencies 4535, 4885, 8085 and 8465 MHz with a resolution of 1.6''.
The contours refer to the total intensity image at 3.6 cm. Right: the histograms of the rotation measure for all significant pixels for North and the South lobe respectively. The < RM> and
for the North and the South lobes are reported in Table 3, while considering all the significant pixels, the values of RM range between -200 rad/m2 and +240 rad/m2. |
| Open with DEXTER |
![\begin{figure}
\par\includegraphics[width=18cm,clip]{H2937f18.ps}\end{figure}](/articles/aa/full/2001/45/aah2937/Timg88.gif) |
Figure 18:
Top: the image of the rotation measure in A514E ( J0448-2044), computed using the polarized angle images at the frequencies 4535, 4885, 8085 and 8465 MHz with a resolution of 1.6''. The contours refer to the total intensity image at 3.6 cm. Bottom: the histograms of the rotation measure for all significant pixels for the East lobe, core and the West lobe respectively. The < RM> and
for the East lobe, core and the West lobe are reported in Table 3, while considering all the significant pixels, the values of RM range between -150 rad/m2 and +150 rad/m2. |
| Open with DEXTER |
We have obtained indirect evidence for the presence of a magnetic field in the cluster A514.
Six radio sources located at different projected distances from the cluster center of A514 have been studied in total intensity and polarization. In conjunction with hot gas density estimates based on the X-ray properties of the cluster, observations of Faraday rotation measures in the radio
sources can most reasonably be explained by the presence of cluster magnetic fields with a strength of 3-7
spread throughout the central 1.4 Mpc of the cluster. This magnetic field is consistent with the magnetic field calculated using similar methods in other clusters of galaxies without a cooling flow (see e.g. Coma, A119, 3C 129).
Acknowledgements
This work was partly supported by the Italian Ministry for University and Research (MURST).
This research has made use of the NASA/IPAC Extragalactic Data Base (NED) which is operated by the JPL, California Institute of Technology, under contract with the National Aeronautics and Space Administration.
-
Abell, G. O., Corwin, H. G., & Olowin, R. P. 1989, ApJS, 70, 1
In the text
NASA ADS
-
Allen, S. W., Taylor, G. B., Nulsen, P. E. J., et al. 2001, MNRAS, 324, 842
In the text
NASA ADS
-
Auriemma, C., Perola, G. C., Ekers, R. D., et al. 1977, A&A, 57, 41
In the text
NASA ADS
-
Bautz, L. P., & Morgan, W. W. 1970, ApJ, 162, L149
In the text
NASA ADS
-
Bliton, M., Rizza, E., Burns, J. O., Owen, F. N., & Ledlow, M. J. 1998, MNRAS, 301, 609
In the text
NASA ADS
-
Cavaliere, A., & Fusco-Femiano, R. 1981, A&A, 100, 194
In the text
NASA ADS
-
Clarke, T. E., Kronberg, P. P., & Böhringer, H. 2001, ApJ, 547, L111
In the text
NASA ADS
-
Condon, J. J., Cotton, W. D., Greisen, E. W., et al. 1998, AJ, 115, 1693
In the text
NASA ADS
-
Crusius-Wätzel, A. R., Biermann, P. L., Lerche, I., & Schlickeiser, R. 1990, ApJ, 360, 417
In the text
NASA ADS
-
Eilek, J., in Proc. of the Ringberg workshop on Diffuse Thermal and Relativistic Plasma in Galaxy Clusters, ed. H. Böhringer, L. Feretti, & P. Schuecker, MPE Rep., 271, 71
-
Ebeling, H., Voges, W., Böhringer, H., et al. 1996, MNRAS, 281, 799
In the text
NASA ADS
-
Fadda, D., Girardi, M., Giuricin, G., et al. 1996, ApJ, 473, 670
In the text
NASA ADS
-
Felten, J. E. 1996, in Clusters, Lensing, and the Future of the Universe, ed. V. Trimble & A. Reisenegger, ASP Conf. Ser., 88, 271
In the text
-
Feretti, L., Dallacasa, D., Giovannini, G., & Tagliani, A. 1995, A&A, 302, 680
In the text
NASA ADS
-
Feretti, L., & Giovannini, G. 1996, in Extragalactic radio sources, 175th Symposium of the International Astronomical Union, ed. Ron D. Ekers, C. Fanti, & L. Padrielli (Kluwer Academic Publishers), 333
In the text
-
Feretti, L., Dallacasa, D., Govoni, F., et al. 1999, A&A, 344, 472
In the text
NASA ADS
-
Fusco-Femiano, R., Dal Fiume, D., Feretti, L., et al. 1999, ApJL, 513, L21
In the text
NASA ADS
-
Jones, C., & Forman, W. 1999, ApJ, 511, 65
In the text
NASA ADS
-
Giovannini, G., Feretti, L., Venturi, T., Kim, K. T., & Kronberg, P. P 1993, ApJ, 406, 399
In the text
NASA ADS
-
Godon, P., Soker, N., & White, R. E. III 1998, AJ, 116, 37
In the text
NASA ADS
-
Goldshmidt, O., & Rephaeli, Y. 1993, ApJ, 411, 518
In the text
NASA ADS
-
Kim, K. T., Kronberg, P. P., Dewdney, P. E., & Landecker, T. L. 1990, ApJ, 355, 29
In the text
NASA ADS
-
Kronberg, P. P, Lesch, H., & Lepp, U. 1999, ApJ, 511, 56
In the text
NASA ADS
-
Lawler, J. M., & Dennison, B. 1982, ApJ, 252, 81
In the text
NASA ADS
-
Olinto, A. 1997, in 3rd RESCEU International Symp. on Particle Cosmology, Tokyo [astro/ph-9807051]
In the text
-
Owen, F. N, White, R. A, & Ge, J. P. 1993, ApJS, 87, 135
In the text
NASA ADS
-
Owen, F. N, Ledlow, M. J., & Keel, W. C. 1996, AJ, 111, 53
In the text
NASA ADS
-
Owen, F. N, & Ledlow, M. J. 1997, ApJS, 108, 41
In the text
NASA ADS
-
Osmer, P. S., Porter, A. C., & Green, R. F. 1994, ApJ, 436, 678
In the text
NASA ADS
-
Perley, R. A., & Taylor, G. B. 1991, AJ, 101, 1623
In the text
NASA ADS
-
Pudritz, R. E., & Silk, J. 1989, ApJ, 342, 650
In the text
NASA ADS
-
Rood, J. H., & Sastry, G. N. 1971, PASP, 83, 313
In the text
NASA ADS
-
Simard-Normandin, M., Kronberg, P. P., & Button, S. 1981,
ApJS, 45, 97
In the text
NASA ADS
-
Slee, O. B., Roy, A. L., & Savage, A. 1994, AuJPh, 47, 517
In the text
NASA ADS
-
Soker, N., & Sarazin, C. L. 1990, ApJ, 348, 73
In the text
NASA ADS
-
Taylor, G. B., & Perley, R. A. 1993, ApJ, 416, 554
In the text
NASA ADS
-
Taylor, G. B., Govoni, F., Allen, S., & Fabian, A. C. 2001, MNRAS, 326, 2
In the text
NASA ADS
-
Tribble, P. C. 1991, MNRAS, 250, 726
In the text
NASA ADS
-
Völk, H. J., & Atoyan, A. M. 1999, APh, 11, 73
NASA ADS
Copyright ESO 2001
![\begin{figure}
\par\includegraphics[width=12cm,clip]{H2937f1.ps}\end{figure}](/articles/aa/full/2001/45/aah2937/img20.gif)
![\begin{figure}
\par\includegraphics[width=18cm,clip]{H2937f2.ps}\end{figure}](/articles/aa/full/2001/45/aah2937/img27.gif)
![\begin{figure}
\par\includegraphics[width=8.8cm,clip]{H2937f3.ps}\end{figure}](/articles/aa/full/2001/45/aah2937/img31.gif)
![\begin{figure}
\par\includegraphics[width=18cm,clip]{H2937f4.ps}\end{figure}](/articles/aa/full/2001/45/aah2937/img51.gif)
![\begin{figure}
\par\includegraphics[width=16cm,clip]{H2937f5.ps}\end{figure}](/articles/aa/full/2001/45/aah2937/img52.gif)
![\begin{figure}
\par\includegraphics[width=8.8cm,clip]{H2937f7.ps}\end{figure}](/articles/aa/full/2001/45/aah2937/img55.gif)
![\begin{figure}
\par\includegraphics[width=18cm,clip]{H2937f8.ps}\end{figure}](/articles/aa/full/2001/45/aah2937/img56.gif)
![\begin{figure}
\par\includegraphics[width=15cm,clip]{H2937f9.ps}\end{figure}](/articles/aa/full/2001/45/aah2937/img57.gif)
![\begin{figure}
\par\includegraphics[width=8.8cm,clip]{H2937f10.ps}\end{figure}](/articles/aa/full/2001/45/aah2937/img73.gif)
![\begin{figure}
\par\includegraphics[width=8.8cm,clip]{H2937f11.ps}\end{figure}](/articles/aa/full/2001/45/aah2937/img74.gif)
![\begin{figure}
\par\includegraphics[width=8.8cm,clip]{H2937f12.ps}\end{figure}](/articles/aa/full/2001/45/aah2937/img75.gif)
![\begin{figure}
\par\includegraphics[width=8.8cm,clip]{H2937f13.ps}\end{figure}](/articles/aa/full/2001/45/aah2937/img83.gif)
![\begin{figure}
\par\includegraphics[width=17cm,clip]{H2937f14.ps}
\end{figure}](/articles/aa/full/2001/45/aah2937/img84.gif)
![\begin{figure}
\includegraphics[width=17cm,clip]{H2937f15.ps}\end{figure}](/articles/aa/full/2001/45/aah2937/img85.gif)
![\begin{figure}
\par\includegraphics[width=14.5cm,clip]{H2937f16.ps}
\par\end{figure}](/articles/aa/full/2001/45/aah2937/img86.gif)
![\begin{figure}
\includegraphics[width=14.5cm,clip]{H2937f17.ps}\end{figure}](/articles/aa/full/2001/45/aah2937/img87.gif)
![\begin{figure}
\par\includegraphics[width=18cm,clip]{H2937f18.ps}\end{figure}](/articles/aa/full/2001/45/aah2937/img88.gif)