The echelle spectra analysed in this paper allow us to study the behaviour of the different optical chromospheric activity indicators from the Ca II H & K to the Ca II IRT lines, formed at different atmospheric heights. As shown in our previous work (Montes et el. 2000b, and references therein) with the simultaneous analysis of the different optical chromospheric activity indicators and using the spectral subtraction technique, it is possible to study in detail the chromosphere, discriminating between the different structures: plages, prominences, flares and microflares.
The chromospheric contribution in
these features has been determined using
the spectral subtraction technique described in
detail by Montes et al. (1995, 1997, 1998, 2000b).
The synthesized spectrum was constructed using the program STARMOD
developed at Penn State University (Barden 1985) and modified by us.
The inactive stars used as reference stars in the spectral subtraction
were observed during the same observing run as the active stars.
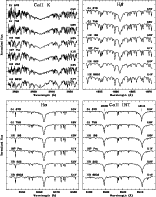
Spectra of representative reference stars in the
Ca II H & K, H![]() ,
H
,
H![]() ,
and Ca II IRT line regions
are plotted in Fig. 4.
In Table 4
we give the excess emission equivalent width (EW) (measured in the
subtracted spectra) for the Ca II H & K, H
,
and Ca II IRT line regions
are plotted in Fig. 4.
In Table 4
we give the excess emission equivalent width (EW) (measured in the
subtracted spectra) for the Ca II H & K, H![]() ,
H
,
H![]() ,
H
,
H![]() ,
H
,
H![]() ,
H
,
H![]() ,
and Ca II IRT
(
,
and Ca II IRT
(![]() 8498,
8498, ![]() 8542,
8542, ![]() 8662) lines,
as well as the reference star used
in the subtraction technique for each observation.
We have estimated the errors in the measured EW taking into account
the typical internal precisions of STARMOD
(0.5-2 km s-1 in velocity shifts, and
8662) lines,
as well as the reference star used
in the subtraction technique for each observation.
We have estimated the errors in the measured EW taking into account
the typical internal precisions of STARMOD
(0.5-2 km s-1 in velocity shifts, and
![]() 5 km s-1 in
5 km s-1 in ![]() ),
the rms obtained in the fit between observed and
synthesized spectra in the regions outside the chromospheric features
(typically in the range 0.01-0.03)
and the standard deviations resulting in the
EW measurements. The estimated errors are in the range of 10-20%.
For low active stars errors are larger and
we have considered as a clear detection of excess emission or absorption
in the chromospheric lines only
when these features in the difference spectrum are
larger than 3
),
the rms obtained in the fit between observed and
synthesized spectra in the regions outside the chromospheric features
(typically in the range 0.01-0.03)
and the standard deviations resulting in the
EW measurements. The estimated errors are in the range of 10-20%.
For low active stars errors are larger and
we have considered as a clear detection of excess emission or absorption
in the chromospheric lines only
when these features in the difference spectrum are
larger than 3![]() .
Errors in the chromospheric features of the blue spectral region are
larger due to the lower S/N of the spectra in this region.
As an indication of the accuracy of the data, we give in
Table 1 the S/N in the Ca II H & K, and H
.
Errors in the chromospheric features of the blue spectral region are
larger due to the lower S/N of the spectra in this region.
As an indication of the accuracy of the data, we give in
Table 1 the S/N in the Ca II H & K, and H![]() line regions.
The excess emission EW have been converted to absolute chromospheric flux at
the stellar surface by using the calibration
of Hall (1996) as a function of (B-V).
In Table 5
we give the absolute flux at the stellar surface
(log
line regions.
The excess emission EW have been converted to absolute chromospheric flux at
the stellar surface by using the calibration
of Hall (1996) as a function of (B-V).
In Table 5
we give the absolute flux at the stellar surface
(log![]() )
for the lines listed in
Table 4.
)
for the lines listed in
Table 4.
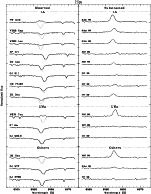
Representative spectra in the H![]() and Ca II IRT (
and Ca II IRT (![]() 8498,
8498, ![]() 8542) line regions
of the star sample have been plotted in Figs. 5 and 6.
For each star we have plotted the observed spectrum (solid-line) and the
synthesized spectrum (dashed-line) in the left panel
and the subtracted spectrum in the right panel.
H
8542) line regions
of the star sample have been plotted in Figs. 5 and 6.
For each star we have plotted the observed spectrum (solid-line) and the
synthesized spectrum (dashed-line) in the left panel
and the subtracted spectrum in the right panel.
H![]() emission above the continuum is detected in
PW And, V834 Tau, and LQ Hya;
in the rest of the stars excess H
emission above the continuum is detected in
PW And, V834 Tau, and LQ Hya;
in the rest of the stars excess H![]() emission is detected in
the subtracted spectra except GJ 3706.
Filled-in absorption in other Balmer lines is also detected in many of the
stars.
Ca II H & K emission is observed
in all the stars in which these lines are included in our spectra.
Emission reversal in the Ca II IRT lines is observed in
PW And, V368 Cep, V383 Lac, DX Leo, EK Dra, V834 Tau, and LQ Hya,
in the rest of the stars a filled-in absorption line profile is observed.
emission is detected in
the subtracted spectra except GJ 3706.
Filled-in absorption in other Balmer lines is also detected in many of the
stars.
Ca II H & K emission is observed
in all the stars in which these lines are included in our spectra.
Emission reversal in the Ca II IRT lines is observed in
PW And, V368 Cep, V383 Lac, DX Leo, EK Dra, V834 Tau, and LQ Hya,
in the rest of the stars a filled-in absorption line profile is observed.
 |
Figure 4:
Spectra of representative reference stars in the
Ca II H & K, H |
 |
Figure 5:
Spectra in the H |
Copyright ESO 2001