A&A 379, 955-975 (2001)
DOI: 10.1051/0004-6361:20011393
N. Przybilla - K. Butler
Universitäts-Sternwarte München, Scheinerstraße 1, 81679 München, Germany
Received 2 July 2001 / Accepted 20 September 2001
Abstract
A comprehensive model atom for non-LTE line formation calculations for
neutral and singly-ionized nitrogen is presented.
Highly accurate radiative and collisional atomic data are incorporated,
recently determined for astrophysical and fusion research
using the R-matrix method in the close-coupling approximation.
As a test and first application of the model, nitrogen
abundances are determined on the basis of
line-blanketed LTE model atmospheres for five stars,
the main sequence object Vega (A0V) and the supergiants
![]() Leo (A0Ib), HD111613 (A2Iabe),
HD92207 (A0Iae) and
Leo (A0Ib), HD111613 (A2Iabe),
HD92207 (A0Iae) and ![]() Ori (B8Iae),
using high S/N and high-resolution spectra at visual and near-IR wavelengths.
The computed non-LTE line profiles fit the observations excellently for a given
nitrogen abundance in each object.
Moreover, the ionization equilibrium of N I/II proves to be a
sensitive temperature indicator for late B-type and early A-type
supergiants - even at low metallicities - due to the apparent nitrogen
overabundance in these objects.
All supergiants within our sample show an enrichment of nitrogen on the order
of
Ori (B8Iae),
using high S/N and high-resolution spectra at visual and near-IR wavelengths.
The computed non-LTE line profiles fit the observations excellently for a given
nitrogen abundance in each object.
Moreover, the ionization equilibrium of N I/II proves to be a
sensitive temperature indicator for late B-type and early A-type
supergiants - even at low metallicities - due to the apparent nitrogen
overabundance in these objects.
All supergiants within our sample show an enrichment of nitrogen on the order
of ![]() 0.3-0.6 dex, indicating the mixing of CN-cycled material
into atmospheric layers, with the sum of the CNO abundances staying close to
solar.
This finding is in accordance with recent stellar evolution models
accounting for mass-loss and rotation. For Vega, an underabundance of nitrogen
by 0.25 dex is found, in good agreement with the similar underabundance of
other light elements.
The dependence of the non-LTE effects
on the atmospheric parameters is discussed with special emphasis on the
supergiants where a strong radiation field at low particle densities favours
deviations from LTE. Non-LTE effects systematically strengthen the N I/II
lines. For some N I lines in supergiants non-LTE abundance corrections
in excess of 1 dex are found and they react sensitively to modifications
of the collisional excitation data. The influence of microturbulence on the
statistical-equilibrium calculations is also investigated: the line-strengths of
the strong N I features show some sensitivity due to modifications of the
line-formation depths and the departure coefficients, while the - in this
parameter range - weak N II lines remain unaffected.
0.3-0.6 dex, indicating the mixing of CN-cycled material
into atmospheric layers, with the sum of the CNO abundances staying close to
solar.
This finding is in accordance with recent stellar evolution models
accounting for mass-loss and rotation. For Vega, an underabundance of nitrogen
by 0.25 dex is found, in good agreement with the similar underabundance of
other light elements.
The dependence of the non-LTE effects
on the atmospheric parameters is discussed with special emphasis on the
supergiants where a strong radiation field at low particle densities favours
deviations from LTE. Non-LTE effects systematically strengthen the N I/II
lines. For some N I lines in supergiants non-LTE abundance corrections
in excess of 1 dex are found and they react sensitively to modifications
of the collisional excitation data. The influence of microturbulence on the
statistical-equilibrium calculations is also investigated: the line-strengths of
the strong N I features show some sensitivity due to modifications of the
line-formation depths and the departure coefficients, while the - in this
parameter range - weak N II lines remain unaffected.
Key words: atomic data - line: formation - stars: abundances, early-type, fundamental parameters, supergiants
Both neutral and singly-ionized nitrogen are known to be affected by non-LTE effects (N I: Takeda 1992, Rentzsch-Holm 1996, Lemke & Venn 1996; N II: Dufton & Hibbert 1981, Becker & Butler 1989). In particular, abundances derived by the N I model atoms seem to be troubled by systematic and comparatively large statistical errors. Recently, important improvements in the determination of accurate atomic data have been achieved, e.g. by the Opacity Project (OP; see Seaton et al. 1994 for a general overview) in the calculation of radiative data. Moreover, detailed electron-impact excitation cross-sections have become available due to the demands of technological applications and fusion research (Frost et al. 1998). The latter are of particular interest, as the former non-LTE studies find a sensitivity of the results to different sets of (approximative) collision data and a discrepancy between abundances from N I lines from the doublets and quartets, which also indicates inappropriate collisional coupling.
Thus a critical reinvestigation, accounting for the improved atomic data, seems appropriate. The aim will be to test the model atom not only on a main sequence object (as usually done on Vega) but also on supergiants, where the tenuous atmospheres favour large mean-free-paths between true absorption processes of photons, thus inducing marked non-LTE effects. Moreover, the expected nitrogen overabundance in the massive objects makes it possible to use the N I/II ionization equilibrium as a temperature indicator for late-B/early-A supergiants, as the N II lines - otherwise absent in these spectral types - also become measurable. Moreover, nitrogen enrichments increase considerably in low-metallicity environments like the SMC, as indicated by observations (Venn 1999) and stellar evolution models (Maeder & Meynet 2001); mixing of chemical elements is more efficient at low metallicity because the metal-poor stars are more compact and therefore have greater angular velocity gradients. Thus the N I/II ionization equilibrium remains useful, while the lines of other indicators fade away at lower abundances.
In addition, analyses of supergiants allow stellar evolution models to be constrained, not only for galactic stars, but also for objects in galactic environments at differing metallicity. High-resolution spectroscopy of such targets has become feasible within the Local Group with 8-10 m class telescopes and modern instrumentation - see Venn (1999) and Venn et al. (2000, 2001) for results on A-type supergiants in the SMC, M31 and NGC6822. For supergiants outside the Local Group medium-resolution spectroscopy has already been performed (Bresolin et al. 2001), offering the potential to use the unblended stronger N I lines to obtain valuable information on these objects.
An extensive model atom for N I/II is presented in the next section together with a critical examination of the expected systematic uncertainties. We perform a consistent and simultaneous treatment of both ionization stages for the first time. The results from our non-LTE line-formation computations are discussed in Sect. 3, as is the influence of microturbulence. In the following section, stellar parameters are constrained applying the N I/II ionization equilibrium as a temperature indicator and nitrogen abundances are determined for a test sample of five stars using high S/N and high-resolution spectra. The findings are discussed in the context of previous abundance studies. Finally, a short summary is given in Sect. 5.
The implications of the observed nitrogen abundances, and also those
of helium, carbon and oxygen, on the evolutionary status of the
sample supergiants will be discussed in detail elsewhere (Przybilla et al.
2001b, hereinafter PaperIV).
A comparison of our model predictions with observed N I lines in
later spectral types (in particular for the sun) and with
N II lines in earlier B stars, at maximum strength, would also be
of interest.
![\begin{figure}
\par\includegraphics[width=11cm,clip]{ms1631f2.eps}\hspace*{3mm}
\parbox[b]{59mm}{
}
\end{figure}](/articles/aa/full/2001/45/aa1631/img21.gif) |
Figure 2: Comparison of photoionization cross-sections from OP computations (full line) and from Henry (1970, dotted line) and Hofsäß (1979, dashed line). On the left hand side data for the ground states of N I and N II are displayed, on the right hand side data for the first and second excited levels of N I. In general, the cross-sections agree well except for numerous narrow resonances present in the OP computations. |
The non-LTE N I/II line profiles are computed on the basis of ATLAS9 (Kurucz 1979, 1991) LTE line-blanketed model atmospheres using LTE Opacity Distribution Functions (ODFs, Kurucz 1992) to account for line blocking in the spectrum synthesis. For the calculation of model atmospheres for the most extreme supergiants close to the Eddington limit, modifications in the treatment of the opacities in the outermost atmospheric layers become necessary, see Przybilla et al. (2001c; hereinafter PaperIII) for details.
With the above assumptions reliable analyses can be performed in the given temperature range from main sequence stars through to bright giants as indicated by Kudritzki (1988). A thorough discussion of the possible deviations from the standard assumptions on the model atmosphere structure of supergiants is given by Venn (1995a). Additionally, non-LTE effects are often less significant for the model structure than is line blanketing, as demonstrated by Przybilla (1997). Close to the Eddington limit (luminosity classes Iae and Ia+) further studies on this topic are desirable; appropriate stellar atmosphere models including non-LTE blanketing, spherical extension and the hydrodynamics of stellar winds are still in the development phase and are not available for detailed abundance studies yet.
The line formation calculations are performed using the programs
DETAIL and
SURFACE (Giddings 1981; Butler & Giddings 1985),
with the former solving the radiative transfer and the statistical
equilibrium equations and the latter computing the emergent flux. Recent
improvements as the inclusion of an ALI scheme (using the treatment of Rybicki &
Hummer 1991) allow the utilisation of
quite elaborate model atoms while the necessary computational resources
remain at a low level (typically ![]() 20min for model convergence
on a 1.5GHz PIV CPU).
20min for model convergence
on a 1.5GHz PIV CPU).
Energy levels up to ![]() 0.26/1.10 eV below the ionization thresholds at
14.53/29.60 eV are therefore explicitly included in our N I/II
model as listed by Moore (1993). This includes all observed energy
levels with principal quantum number
0.26/1.10 eV below the ionization thresholds at
14.53/29.60 eV are therefore explicitly included in our N I/II
model as listed by Moore (1993). This includes all observed energy
levels with principal quantum number ![]() and the 8s states in N I and all observed levels with
and the 8s states in N I and all observed levels with ![]() in N II. Only the ground state of N III is
considered as the ionization energy of 47.45 eV is rather high.
Fine structure splitting is not taken into account:
sub-levels belonging to the same term are combined into a single level.
The intermediate coupling terms of N I and N II are split to
resemble the LS-coupling levels for which OP radiative data is available.
The resulting
inconsistencies are expected to be negligible as the deviations from pure
LS-coupling are small.
in N II. Only the ground state of N III is
considered as the ionization energy of 47.45 eV is rather high.
Fine structure splitting is not taken into account:
sub-levels belonging to the same term are combined into a single level.
The intermediate coupling terms of N I and N II are split to
resemble the LS-coupling levels for which OP radiative data is available.
The resulting
inconsistencies are expected to be negligible as the deviations from pure
LS-coupling are small.
Additionally, the remaining level populations of N I and N II up to n=10 are computed in LTE relative to the ground state of the higher ionization stage with energies derived from their quantum defects. They are considered only in the number conservation equation.
Grotrian diagrams for N I and N II are displayed in Fig. 1. The non-LTE calculations are performed simultaneously for N I/II. Additional radiative coupling between the different spin systems of N I/II is provided by the intercombination transitions listed by Wiese et al. (1996). A detailed comparison of OP oscillator strengths for N II with experimental and theoretical work by other authors is performed by Luo & Pradhan (1989); considerable disagreement for a number of transitions is found. Nevertheless, the superior performance of the R-matrix method in the close-coupling approximation typically allows the determination of atomic data accurate to within 10%. We therefore expect the uncertainties of the majority of the data to remain within this limit, outdating most of the older data used in previous studies on non-LTE effects in N I or N II.
Photoionization from all energy levels with non-LTE populations are
treated with cross-sections fitted to the OP data (Burke & Lennon,
available only from the TOPBASE database)
for N I and from Luo & Pradhan (1989) for N II.
A carefully chosen frequency grid ensures a thorough representation of the
numerous resonances present in the results of the R-matrix calculations,
typically being accurate to 10%. Cross-sections for energy levels missing
in the OP data (for quantum number ![]() in N I) are
calculated in the hydrogenic approximation (Mihalas 1978, p. 99).
in N I) are
calculated in the hydrogenic approximation (Mihalas 1978, p. 99).
A comparison of OP cross-sections for the ground states and some low-excitation levels with those of Henry (1970) and Hofsäß (1979) - used in previous non-LTE studies on N I/II - is given in Fig. 2. All three show the same general trend and agree well to a factor better than 2, except for the numerous narrow resonances present in the OP data. For the higher-excited levels of N I/II the use of detailed OP data also significantly improves the description of the photoionization processes compared to the majority of previous non-LTE studies of those ions.
In the first step of the computations, i.e. in DETAIL, the level
populations are
calculated using depth dependent Doppler profiles assuming LS coupling;
microturbulence is explicitly accounted for by inclusion of an additional
term in the Doppler width (
![]() ):
):
These LS-coupling populations are then split according to the statistical weights of the individual sub-levels in order to calculate line profiles via the program SURFACE. In this step Voigt profile functions are adopted and the same microturbulent velocity as in DETAIL is applied. The damping parameters are calculated from OP radiative lifetimes for the radiative widths and adopted from Griem (1964, 1974) for electron impact and ion broadening in N I/II. Missing collisional damping data are computed from the approximation of Cowley (1971). Van der Waals damping is neglected, as the atmospheric plasma is almost completely ionized in the parameter range considered here.
Experimental cross-sections from Brook et al. (1978) and
Yamada et al. (1989) are adopted for the collisional
ionization of the ground states of N I and N II.
The authors expect uncertainties <40% and <20%, respectively,
for the data at low energies, with significant improvements in the
accuracy at higher energies. All the
remaining collisional ionization data are computed using the Seaton formula
(Seaton 1962) with threshold photoionization cross-sections from
the OP data, where available, or from the hydrogenic approximation.
![\begin{figure}
\par\includegraphics[width=8.8cm,clip]{ms1631f3.eps}\end{figure}](/articles/aa/full/2001/45/aa1631/img34.gif) |
Figure 3:
Synthetic far-UV (astrophysical) fluxes from ATLAS9
supergiant models for
|
We therefore explicitly include bound-free opacities for H , He , O and C with level populations calculated in non-LTE, using updated and extended versions of the H and He I model atoms of Husfeld et al. (1989) and the model atoms of Przybilla et al. (2000, hereinafter PaperI; PaperIII). All levels of H up to n=20 are treated explicitly in non-LTE, and for He I a number of spectral lines is added in the line formation; however, the changes do not affect the contribution of both elements to the background opacity.
Line opacities are represented by LTE ODFs (Kurucz 1992) for the
appropriate metallicity and microturbulence. The original sawtooth pattern is
transformed into a step function by averaging over the 10Å-wide
intervals. This procedure meets the requirements for calculating the
radiation field as a whole. However, at certain important wavelengths a more
detailed description is desirable. In particular, line opacities slightly
longward of the Lyman and Balmer jump are only poorly reproduced in the ODF
approach, especially for supergiants, as the merging hydrogen lines are
inappropriately sampled. Moreover, most transition wavelengths for opacity
calculations are only known from theoretical calculations which implies
comparatively large errors (see e.g. Johansson & Leckrone 1996)
and therefore less accurate opacities. In particular, the vacuum ultraviolet
region is affected, where the ionization edges of the first and second
excited levels of N I are located. Fortunately, the ionization of the
N I ground state is determined by the optically thick Lyman continuum
and N II has its ionization edges located at
wavelengths with negligible flux.
| changes in
|
|||||||||
| 9500/4.0 | 9500/2.0 | 9500/1.2 | 12000/1.8 | ||||||
| N I | N I | N II | N I | N II | N I | N II | |||
| Atmospheric parameters: | |||||||||
|
|
|
-0.02 | -0.04 | +0.11 | -0.06 | +0.09 | -0.02 | +0.08 | |
|
|
|
+0.04 | -0.01 | +0.10 | -0.11 | -0.04 | -0.04 | +0.12 | |
|
|
-0.02 | -0.01 | -0.02 | ||||||
| y+0.15dex | +0.02 | -0.02 | -0.03 | +0.01 | -0.06 | ||||
| [M/H]-0.2dex |
|
+0.01 | -0.02 | -0.01 | |||||
| [C/H]-0.2dex |
|
||||||||
| Line transitions: | |||||||||
| Oscillator strengths +10% |
|
-0.05 | -0.04 | -0.04 | -0.04 | -0.05 | -0.04 | -0.04 | |
| Damping constant *2 |
|
||||||||
| Photoionisations: | |||||||||
| Cross-sections +10% |
|
||||||||
| Cross-sections *5 | +0.01 | +0.04 | +0.03 | +0.05 | |||||
| Collisional transitions: | |||||||||
| Cross-sections *0.1 | -0.30 | -0.06 | -0.02 | -0.01 | -0.01 | -0.05 | -0.03 | ||
| Cross-sections *0.5 |
|
-0.11 | -0.03 | -0.01 | -0.01 | -0.02 | -0.01 | ||
| Cross-sections *2 |
|
+0.09 | +0.05 | +0.01 | +0.01 | +0.01 | +0.02 | +0.02 | |
| Cross-sections *10 | +0.23 | +0.22 | +0.07 | +0.06 | +0.05 | +0.13 | +0.09 | ||
| Collisional ionization: | |||||||||
| Cross-sections *0.1 |
|
+0.01 | +0.01 | ||||||
| Cross-sections *10 |
|
-0.01 | -0.01 | +0.01 | |||||
| Continuum placement |
|
||||||||
| Estimated total uncertainty |
|
||||||||
Despite our success in reproducing the observations, our calculations might also be affected by a systematic effect neglected in the atmosphere modelling. Non-LTE effects will cause an overionization of the relevant elements in the opacity determination. The backwarming introduced by line blanketing might therefore be overestimated in LTE, as well as the magnitude of line blocking. First calculations of non-LTE line-blanketed model atmospheres for main sequence A-types (Hubeny & Lanz 1993) indicate some changes in the expected direction but adequate models for the more interesting case of supergiants are just being investigated (J. Puls, private communication, Aufdenberg 2000) and are still not available for detailed abundance work.
To assess the effects of uncertainties in the atmospheric parameters and crucial
atomic data on the accuracy of our non-LTE computations,
test calculations were performed for typical atmospheric parameters of
BA-type stars: a main sequence model with 9500K/4.0
(
![]() /
/![]() )
at
)
at
![]()
![]() and supergiant models with 9500K/2.0 at
and supergiant models with 9500K/2.0 at
![]()
![]() and with 9500K/1.2 and 12000K/1.8 at
and with 9500K/1.2 and 12000K/1.8 at
![]()
![]() ,
assuming solar metallicity.
For each parameter or set of cross-sections varied, we calculated a small
grid at different abundances to investigate the systematic shift in abundance
needed to fit the original line strengths.
The results of the tests are summarised in Table 1.
They correspond to the mean value obtained from a study of the lines
,
assuming solar metallicity.
For each parameter or set of cross-sections varied, we calculated a small
grid at different abundances to investigate the systematic shift in abundance
needed to fit the original line strengths.
The results of the tests are summarised in Table 1.
They correspond to the mean value obtained from a study of the lines
![]() 6008, 7423, 7468, 7899, 8567, 8629, 8680, 8686, 8711,
8718, 9028, 9045 (N I) and
6008, 7423, 7468, 7899, 8567, 8629, 8680, 8686, 8711,
8718, 9028, 9045 (N I) and ![]() 3995 (N II, for
3995 (N II, for
![]() <10000K) and
<10000K) and
![]() 3995, 4447, 4613, 4630,
4788, 5045, 5679, 5686 (N II, for
3995, 4447, 4613, 4630,
4788, 5045, 5679, 5686 (N II, for
![]() >10000K).
>10000K).
The strengths of the N I and/or N II lines are highly dependent
on the atmospheric parameters (
![]() /
/![]() ).
This sensitivity predestines the ionization equilibrium of N I/II
as an ideal tool for the determination of stellar parameters in BA-type
supergiants (N II lines are absent in the corresponding main-sequence
objects). A modification of the stellar helium content affects the atmospheric
structure (Kudritzki 1973) and considerable enrichment is
expected for supergiants (e.g. Meynet & Maeder 2000). We therefore
examine the effects of an increased helium abundance (by a typically
amount) on the nitrogen lines: in some cases this consitutes one of the more
important contributors to systematic errors while in others it is completely
negligible. In the following estimation of the systematic error we ignore
this effect as we explicitly determine the helium abundance and account for
it in the model atmosphere computations; unfortunately, this is not being
done in most of similar studies found in the literature.
The other atmospheric and stellar parameters like microturbulence
and metallicity are almost negligible and affect only the strongest features.
In particular, no dependency of the nitrogen ionization equilibrium on
reasonable uncertainties in the carbon abundance is found.
Carbon affects the radiation field in the far-UV due to the bound-free
absorption from the C I ground state shortward of 1100 Å.
But, line opacity in general is found to be of
greater importance for the ionization from excited N I levels, while
photoionizations from the N I
ground state arise under optically thick conditions (in the Lyman continuum),
which implies small deviations from LTE.
).
This sensitivity predestines the ionization equilibrium of N I/II
as an ideal tool for the determination of stellar parameters in BA-type
supergiants (N II lines are absent in the corresponding main-sequence
objects). A modification of the stellar helium content affects the atmospheric
structure (Kudritzki 1973) and considerable enrichment is
expected for supergiants (e.g. Meynet & Maeder 2000). We therefore
examine the effects of an increased helium abundance (by a typically
amount) on the nitrogen lines: in some cases this consitutes one of the more
important contributors to systematic errors while in others it is completely
negligible. In the following estimation of the systematic error we ignore
this effect as we explicitly determine the helium abundance and account for
it in the model atmosphere computations; unfortunately, this is not being
done in most of similar studies found in the literature.
The other atmospheric and stellar parameters like microturbulence
and metallicity are almost negligible and affect only the strongest features.
In particular, no dependency of the nitrogen ionization equilibrium on
reasonable uncertainties in the carbon abundance is found.
Carbon affects the radiation field in the far-UV due to the bound-free
absorption from the C I ground state shortward of 1100 Å.
But, line opacity in general is found to be of
greater importance for the ionization from excited N I levels, while
photoionizations from the N I
ground state arise under optically thick conditions (in the Lyman continuum),
which implies small deviations from LTE.
The accuracy of the atomic data used in the model is high and variations
within the uncertainties result in negligible abundance errors in most
cases. In general, the gf-values for the visible N I/II lines are
well determined, with typical uncertainties in the 10% range, cf. Tables
5 and 6. Although small, these consitute the
main source of (atomic data) systematic error for supergiant
analyses (up to 0.05 dex). Variations of the photoionization cross-sections
within the expected 10% on the other hand result in no abundance changes.
This is in contrast to some of the previous non-LTE studies, for which
only less accurate data were available.
Also, the damping constants are not a critical issue in the line-formation.
Collisional ionization from the energetically low-lying energy levels is
unimportant due to the fairly low kinetic energy of the electrons
(![]() 1 eV) as compared to the ionization energies of 14.53 and 29.60 eV for
N I and N II, respectively. For the high-excitation levels
this processes ensure the coupling to the next ionization stage, but changes
by a factor 10 in the rates do not affect the visible lines.
1 eV) as compared to the ionization energies of 14.53 and 29.60 eV for
N I and N II, respectively. For the high-excitation levels
this processes ensure the coupling to the next ionization stage, but changes
by a factor 10 in the rates do not affect the visible lines.
The other
critical parameters for the non-LTE analysis besides the gf-values are the
collisional excitation data, see also Rentzsch-Holm (1996).
This is clearly demonstrated for the
main-sequence model, where a systematic uncertainty in the rates within a
factor of two
results in an abundance differing by 0.1 dex. A factor of 10, which is
easily reached for isolated transitions - if the detailed computations of Frost
et al. (1998) are compared with the approximative formula
commonly used - will lead to abundances differing by up to 0.3 dex in the
mean. For single lines, like N I ![]() 8680, the abundance
can be modified by even 0.5 dex.
Naturally, the resulting errors diminish for supergiants as collisions
become less important in their tenuous atmospheres. Nevertheless, we
identify the usage of the detailed collisional excitation data as the main
improvement in our non-LTE analysis as compared to previous studies,
in particular for N I; consistent results from spectral lines
of the doublets and quartets are obtained for the first time
(cf. Sect. 4.3).
8680, the abundance
can be modified by even 0.5 dex.
Naturally, the resulting errors diminish for supergiants as collisions
become less important in their tenuous atmospheres. Nevertheless, we
identify the usage of the detailed collisional excitation data as the main
improvement in our non-LTE analysis as compared to previous studies,
in particular for N I; consistent results from spectral lines
of the doublets and quartets are obtained for the first time
(cf. Sect. 4.3).
A further source of systematic error is the continuum placement in the
observed spectra. This strongly depends on the S/N ratio obtained. Our
estimate in Table 1 should be applicable to high quality data with S/N![]() 100 only. In general, equivalent widths studies are more
susceptible to
this systematic error than the spectrum synthesis technique, which also
accounts for the continuum regions explicitly.
100 only. In general, equivalent widths studies are more
susceptible to
this systematic error than the spectrum synthesis technique, which also
accounts for the continuum regions explicitly.
The total uncertainties are computed from the sum of the squares of the
appropriate uncertainties listed above, assuming them to be independent:
![\begin{eqnarray*}\sigma_{\rm sys}^2 & = & \sigma_{T_{\rm eff}}^2+\sigma_{\log
g}...
...}^2+\sigma_{\rm [M/H]}^2+\sigma_{\rm [C/H]}^2+\sigma_{\log gf}^2
\end{eqnarray*}](/articles/aa/full/2001/45/aa1631/img60.gif)
| (2) |
![\begin{figure}
\par\includegraphics[width=8.8cm,clip]{ms1631f4.eps}\end{figure}](/articles/aa/full/2001/45/aa1631/img62.gif) |
Figure 4:
Non-LTE and LTE ionization balance of nitrogen for several sample
stars of Sect. 4: Vega (solid lines and filled circles, respectively),
|
| Ion | No. | Term | Ion | No. | Term | Ion | No. | Term |
| N I | 1 |
| N I | 13 |
| N II | 97 |
|
| 2 |
| 16 |
| 98 |
| |||
| 3 |
| 30 |
| 100 |
| |||
| 4 |
| 43 |
| 101 |
| |||
| 5 |
| 50 |
| 103 |
| |||
| 7 |
| N II | 90 |
| 104 |
| ||
| 8 |
| 91 |
| 105 |
| |||
| 10 |
| 92 |
| 108 |
| |||
| 12 |
| 93 |
| 109 |
| |||
| N III | 167 |
|
| Ion | Transition | l | - | u | |
| N I | 3830.43 |
|
5 | - | 50 |
| 5999.43 |
|
7 | - | 30 | |
| 6008.47 |
|
7 | - | 30 | |
| 7423.64 |
|
4 | - | 10 | |
| 7442.30 |
|
4 | - | 10 | |
| 7468.31 |
|
4 | - | 10 | |
| 7898.98 |
|
13 | - | 50 | |
| 7899.28 |
|
13 | - | 50 | |
| 8567.74 |
|
5 | - | 12 | |
| 8594.00 |
|
5 | - | 12 | |
| 8629.24 |
|
5 | - | 12 | |
| 8655.88 |
|
5 | - | 12 | |
| 8680.28 |
|
4 | - | 8 | |
| 8683.40 |
|
4 | - | 8 | |
| 8686.15 |
|
4 | - | 8 | |
| 8703.25 |
|
4 | - | 8 | |
| 8711.70 |
|
4 | - | 8 | |
| 8718.84 |
|
4 | - | 8 | |
| 8728.90 |
|
4 | - | 8 | |
| 9028.92 |
|
7 | - | 16 | |
| 9045.88 |
|
13 | - | 43 | |
| 9049.49 |
|
13 | - | 43 | |
| 9049.89 |
|
13 | - | 43 | |
| N II | 3955.85 |
|
97 | - | 105 |
| 3995.00 |
|
98 | - | 105 | |
| 4447.03 |
|
100 | - | 108 | |
| 4601.48 |
|
97 | - | 104 | |
| 4607.15 |
|
97 | - | 104 | |
| 4613.87 |
|
97 | - | 104 | |
| 4630.54 |
|
97 | - | 104 | |
| 4643.09 |
|
97 | - | 104 | |
| 4788.14 |
|
101 | - | 109 | |
| 4803.29 |
|
101 | - | 109 | |
| 5045.10 |
|
97 | - | 103 | |
| 5666.63 |
|
97 | - | 101 | |
| 5676.02 |
|
97 | - | 101 | |
| 5679.56 |
|
97 | - | 101 | |
| 5686.21 |
|
97 | - | 101 | |
| 5710.77 |
|
97 | - | 101 |
![\begin{figure}
\par\includegraphics[width=17.8cm,clip]{ms1631f5.eps}
\end{figure}](/articles/aa/full/2001/45/aa1631/img107.gif) |
Figure 5:
Departure coefficients bi for N I/II
as a function of Rosseland optical
depth
|
Departure coefficients bi=
![]() (the ni denoting the level populations)
for energy levels i are displayed in Fig. 5 as a function of
(the ni denoting the level populations)
for energy levels i are displayed in Fig. 5 as a function of
![]() for some models of the objects discussed in
Sect. 4. All the observed N I/II lines in
the visual/near-IR originate from highly-excited energy levels
(
for some models of the objects discussed in
Sect. 4. All the observed N I/II lines in
the visual/near-IR originate from highly-excited energy levels
(![]() 10.3/18.5 eV); the formation depths (at
10.3/18.5 eV); the formation depths (at ![]()
![]() 1) of
the line cores are also marked
in Fig. 5. In Table 2, identifiers for the
consecutively numbered energy terms of our N I/II model are given
and the levels involved in the observed transitions are identified in Table
3.
1) of
the line cores are also marked
in Fig. 5. In Table 2, identifiers for the
consecutively numbered energy terms of our N I/II model are given
and the levels involved in the observed transitions are identified in Table
3.
Deep in the atmosphere, the departure coefficients approach unity, as the
density increases and collisional processes dominate, enforcing LTE (inner
boundary condition). Farther out, non-LTE effects prevail and affect the
level populations throughout the bulk of the photosphere.
A remarkable feature of the departure coefficients for the levels in
N I is the separation of the energetically close ground state and the
collisionally coupled first two doublet levels from the rest of the
highly-excited levels. The energetically lowest levels are depopulated by
photoionizations: when we neglect the non-LTE radiation field by replacing
the mean intensity by the Planck function, ![]() =
=![]() ,
in the
photoionization continua, this situation is relaxed and these levels stay
at their detailed-equilibrium value, as a test on Vega has shown
(cf. Fig. 5). Photoionizations are mainly effective for the two
doublet terms, as the optically thick Lyman continuum blocks the photons
necessary for ground state ionization.
This overionization of N I is accompanied by a
corresponding overpopulation of the N II ground state (and also the
collisionally coupled low-lying N II levels).
Accurate photoionization cross-sections are therefore
necessary to predict the N I/II ionization equilibrium in non-LTE
quantitatively, given the small contribution of all other N I energy
levels to the total of neutral nitrogen.
In the
,
in the
photoionization continua, this situation is relaxed and these levels stay
at their detailed-equilibrium value, as a test on Vega has shown
(cf. Fig. 5). Photoionizations are mainly effective for the two
doublet terms, as the optically thick Lyman continuum blocks the photons
necessary for ground state ionization.
This overionization of N I is accompanied by a
corresponding overpopulation of the N II ground state (and also the
collisionally coupled low-lying N II levels).
Accurate photoionization cross-sections are therefore
necessary to predict the N I/II ionization equilibrium in non-LTE
quantitatively, given the small contribution of all other N I energy
levels to the total of neutral nitrogen.
In the ![]() Ori model, the collisional coupling of the low-excitation
levels is weakened, as radiative processes are more intense in the hotter
atmosphere.
Ori model, the collisional coupling of the low-excitation
levels is weakened, as radiative processes are more intense in the hotter
atmosphere.
The higher-excited levels of N I on the other hand develop
considerable overpopulations in the line-formation region, most notably for
the lower levels of the strongest N I lines in the near-IR,
![]() and
and
![]() .
A marked non-LTE strengthening of this lines is therefore expected.
The overpopulation reaches a maximum at
.
A marked non-LTE strengthening of this lines is therefore expected.
The overpopulation reaches a maximum at
![]() in the various models.
Farther out in the
atmosphere the trend is reversed and the departure coefficients approach the
underpopulation of the low-excitation states. The overpopulation is
faciliated by radiative cascades, which in both spin systems of
N I practically end in the 3s states. Effectively, these states become
metastable, as the transitions to the 2p3 levels are optically thick and
consequently contribute only marginally to the depopulation of these levels.
The radiative detailed balance begins to break down for the
in the various models.
Farther out in the
atmosphere the trend is reversed and the departure coefficients approach the
underpopulation of the low-excitation states. The overpopulation is
faciliated by radiative cascades, which in both spin systems of
N I practically end in the 3s states. Effectively, these states become
metastable, as the transitions to the 2p3 levels are optically thick and
consequently contribute only marginally to the depopulation of these levels.
The radiative detailed balance begins to break down for the
![]() -
-
![]() and
and
![]() -
-
![]() transitions in the most luminous objects of our sample, weakening the
quasi-metastable character of the
transitions in the most luminous objects of our sample, weakening the
quasi-metastable character of the
![]() level
in these stars. This effect was first identified by Takeda & Takada-Hidai
(1995), who also found that it critically depends on the
computational details. Our more sophisticated modelling largely improves the
agreement between theory and observation, but good quantitative agreement is
still not obtained (see Sect. 4.3).
Closer to the stellar surface the lower particle densities complicate
the recombination and thus the cascading is suppressed.
Departure coefficients for levels at slightly higher excitation energy
(the other levels with n=3) follow this trend to a lesser
degree (these are the upper states for the observed transitions), while the
levels close to the N I continuum approach the departure coefficient of
the N II ground state, as collisional coupling becomes significant.
level
in these stars. This effect was first identified by Takeda & Takada-Hidai
(1995), who also found that it critically depends on the
computational details. Our more sophisticated modelling largely improves the
agreement between theory and observation, but good quantitative agreement is
still not obtained (see Sect. 4.3).
Closer to the stellar surface the lower particle densities complicate
the recombination and thus the cascading is suppressed.
Departure coefficients for levels at slightly higher excitation energy
(the other levels with n=3) follow this trend to a lesser
degree (these are the upper states for the observed transitions), while the
levels close to the N I continuum approach the departure coefficient of
the N II ground state, as collisional coupling becomes significant.
As N II becomes the dominant ionization stage, like in the more luminous supergiants, the (triplet) ground state departure coefficient approaches its detailed equilibrium value. Two other energetically close singlet states and a quintet level are - again - coupled collisionally. In the line-formation region the departures from LTE are generally small. Non-LTE effects cannot affect the strongly populated lower levels as the corresponding radiative processes occur under optically thick conditions in the Lyman continuum. Radiative transitions are only effective for the N II 3s states and the levels above. We attribute the slight underpopulation of these levels at line-formation depths to these processes, resulting in an overpopulation of N III. A detailed analysis of the non-LTE effects is complicated by the small departures and they will be sensitive to small modifications in the entirety of the atomic data at this level. Additional investigations for N II should therefore be carried out for objects at higher temperatures.
The non-LTE abundance corrections for single spectral lines in our
sample stars, as derived in Tables 5 and 6, are
explained by the run of the departure coefficients and the
corresponding line source function ![]() for a given transition.
In Fig. 6 the ratio of the line source function to the Planck
function
for a given transition.
In Fig. 6 the ratio of the line source function to the Planck
function ![]() for diagnostic lines for our models of
for diagnostic lines for our models of ![]() Leo and
Leo and ![]() Ori
is displayed. A non-LTE strengthening of lines will occur
in cases with a relative overpopulation of the lower level, a condition
which is generally met at the formation depths of
the observed N I/II lines. The run of
Ori
is displayed. A non-LTE strengthening of lines will occur
in cases with a relative overpopulation of the lower level, a condition
which is generally met at the formation depths of
the observed N I/II lines. The run of ![]() /
/![]() as given for the
as given for the ![]() Leo model is typical for the other early
A-type supergiants. Departures from unity set in deeper in the atmosphere
for increasing
Leo model is typical for the other early
A-type supergiants. Departures from unity set in deeper in the atmosphere
for increasing
![]() and decreasing surface gravity; only small
departures are therefore found in Vega, resulting in the much smaller
non-LTE abundance corrections when compared to the supergiants.
Typically, the - in the temperature range studied - weak N II lines
are formed deeper in the atmosphere than the strong N I features.
and decreasing surface gravity; only small
departures are therefore found in Vega, resulting in the much smaller
non-LTE abundance corrections when compared to the supergiants.
Typically, the - in the temperature range studied - weak N II lines
are formed deeper in the atmosphere than the strong N I features.
| |
Figure 7:
Theoretical line profiles for the |
Recently, McErlean et al. (1998) explicitly included
microturbulence in the statistical-equilibrium calculations (with DETAIL,
Eq. (1)) for
helium in OB stars and find
significantly different profiles as compared to the standard procedure of
including microturbulence only in the final step of the spectrum synthesis
(with SURFACE) for microturbulent velocities in excess of
10 km s-1.
Here we wish to investigate the contribution of this effect to the
line-formation of N I/II. Note that the microturbulent velocities
typically found in our test objects are comparable or even larger than the
thermal velocity for nitrogen (![]() 3.5kms-1 at 10kK).
3.5kms-1 at 10kK).
This rather subtle effect depends on the details of the ionization balance and on the run of the departure coefficients for a given element (PaperI; Przybilla et al. 2001a, hereinafter PaperII). The lines of N I are expected to show some sensitivity to a non-zero microturbulence in the statistical-equilibrium calculations as the occupation numbers of the levels involved vary over the line-formation depths. Thus the radiative transitions occur under slightly different conditions as the formation depths of the line centres are pushed deeper into the atmosphere but simultaneously the frequency bandwidths for absorption are broadened by an increased microturbulent velocity. Changes in the non-LTE level populations and the line source functions vary in magnitude for different lines. Even lines too weak to react sensitively to microturbulence in the classical sense might therefore be affected.
In Fig. 7, test calculations for our model of ![]() Leo with
an increased microturbulence are displayed. For most of the N I lines
a strengthening of up to 10% is found as
Leo with
an increased microturbulence are displayed. For most of the N I lines
a strengthening of up to 10% is found as ![]() is increased from 0 to 10 km s-1 in the statistical-equilibrium
computations within DETAIL. The line-formation itself is performed
with SURFACE on the basis of the resulting population numbers for
is increased from 0 to 10 km s-1 in the statistical-equilibrium
computations within DETAIL. The line-formation itself is performed
with SURFACE on the basis of the resulting population numbers for
![]() =10 km s-1 as in the classical approach.
In general, the stronger lines are more sensitive. On the other hand, for some
lines like N I
=10 km s-1 as in the classical approach.
In general, the stronger lines are more sensitive. On the other hand, for some
lines like N I
![]() 9045-49 even a small weakening is found.
The N II lines are unaffected, even in an analogous experiment for
9045-49 even a small weakening is found.
The N II lines are unaffected, even in an analogous experiment for
![]() Ori.
For typical microturbulence values (<10 km s-1) found in our sample
stars, the magnitude of this effect is reduced but nevertheless should be
accounted for in high S/N observations such as ours.
We therefore use a consistent microturbulence in all our
statistical-equilibrium and line-formation calculations in order to reduce
the systematic error in the stellar parameter and abundance determination.
Ori.
For typical microturbulence values (<10 km s-1) found in our sample
stars, the magnitude of this effect is reduced but nevertheless should be
accounted for in high S/N observations such as ours.
We therefore use a consistent microturbulence in all our
statistical-equilibrium and line-formation calculations in order to reduce
the systematic error in the stellar parameter and abundance determination.
| HD | Name | Sp.Type | V(mag) |
|
|
|
|
y |
|
|||
|
|
|
(K) | (cgs) |
|
|
|||||||
| 172167 | A0V | 0.03 | 67.44 | +19.24 | -14 | 22 | 9550 | 3.95 | 0.09 | 2 | 0 | |
| +2 | ||||||||||||
| 87737 | A0Ib | 3.52 | 219.53 | +50.75 | +3 | 9 | 9600 | 2.00 | 0.13 | 4 | 12 | |
| 111613 | ... | A2Iabe | 5.72 | 302.91 | +2.54 | -21 | 19 | 9150 | 1.45 | 0.105 | 7 | 21 |
| 92207 | ... | A0Iae | 5.45 | 286.29 | -0.26 | -9 | 30 | 9500 | 1.20 | 0.12 | 8 | 20 |
| 34085 | B8Iae: | 0.12 | 209.24 | -25.25 | +21 | 36 | 12000 | 1.75 | 0.135 | 7 | 22 | |
The comparison of our model atom and the non-LTE departures with that of previous studies on N I will be instructive in explaining the large discrepancies, up to a factor of 2, in the derived nitrogen abundances for supergiants in particular, cf. Sect. 4.3.
Even for the main sequence star Vega all four studies on non-LTE effects in
nitrogen, Takeda (1992), Rentzsch-Holm (1996, RH), Lemke &
Venn (1996, LV) and the present work, find rather different
departure coefficients - quantitatively as well as qualitatively.
Takeda (1992) has compiled the most comprehensive N I model
atom so far, with regard to the number of levels (119) and transitions
(>2100) treated explicitly. Nevertheless, the quality of the atomic data
is lower than ours, as - except for the oscillator strengths and the
photoionization cross-sections of the lowest three levels - only approximate
data are used.
By inspection of Takeda's Fig. 1 one might expect that the departure coefficients
are too large, the model at solar metallicity already resembles ours to some
point and the bi increase enormously in the 1/10![]() solar model.
Larger departure coefficients are also found by RH and LV, resulting in
systematically larger non-LTE abundance corrections than in our work.
Both model atoms resemble each other, with improved radiative
data as compared to Takeda (1992) but still using only
approximate collisional data. The number of line transitions is
restricted in both studies, to 80 (RH) and 189 (LV) for a
number of energy levels similar to that of the present work,
as both use a complete linearisation scheme
instead of the more powerful ALI technique, which allows us to treat
solar model.
Larger departure coefficients are also found by RH and LV, resulting in
systematically larger non-LTE abundance corrections than in our work.
Both model atoms resemble each other, with improved radiative
data as compared to Takeda (1992) but still using only
approximate collisional data. The number of line transitions is
restricted in both studies, to 80 (RH) and 189 (LV) for a
number of energy levels similar to that of the present work,
as both use a complete linearisation scheme
instead of the more powerful ALI technique, which allows us to treat
![]() 700 transitions in N I explicitly.
The non-LTE effects in particular for neutral nitrogen seem to depend
critically on accurate atomic data. All the previous studies struggle with
difficulties to bring abundances from the doublet and quartet lines into
accordance, indicating inaccurate collisional coupling between the two spin
systems. This problem we can almost completely resolve with our model atom,
with the one exception of the strongest observed line from the doublet spin
system, N I
700 transitions in N I explicitly.
The non-LTE effects in particular for neutral nitrogen seem to depend
critically on accurate atomic data. All the previous studies struggle with
difficulties to bring abundances from the doublet and quartet lines into
accordance, indicating inaccurate collisional coupling between the two spin
systems. This problem we can almost completely resolve with our model atom,
with the one exception of the strongest observed line from the doublet spin
system, N I ![]() 8629, which we find to give a slightly
low abundance.
We cannot confirm the finding of LV, that Ly
8629, which we find to give a slightly
low abundance.
We cannot confirm the finding of LV, that Ly![]() is of significant
importance for the N I bound-bound rates: the "critical'' N I
resonance line in the Ly
is of significant
importance for the N I bound-bound rates: the "critical'' N I
resonance line in the Ly![]() wing is optically thick throughout the
atmosphere, implying a net radiative rate of practically zero.
wing is optically thick throughout the
atmosphere, implying a net radiative rate of practically zero.
The studies of Venn (1995b) and Takeda & Takada-Hidai
(1995, TTH) apply the LV and Takeda
(1992) models, respectively, to supergiants where the
strengthened non-LTE will amplify the differences between the different models.
Departure coefficients for N I levels in
![]() Leo, the supergiant we have in common, are unfortunately not
discussed. The non-LTE abundance corrections of TTH
for the quartet lines agree to
Leo, the supergiant we have in common, are unfortunately not
discussed. The non-LTE abundance corrections of TTH
for the quartet lines agree to ![]() 0.2dex with ours,
but for the N I
0.2dex with ours,
but for the N I ![]() 8629 doublet line TTH find a positive
abundance correction; a second doublet line in their
observations is unfortunately not analysed.
Due to the breakdown of the pseudo-metastable character of the lower level
of this transition and its sensitivity to even slight changes in the conditions
of the calculations (cf. Sect. 3.1), TTH
exclude this line from
the abundance determination.
Considering the more accurate atomic data in our study, we do not encounter
such severe problems.
8629 doublet line TTH find a positive
abundance correction; a second doublet line in their
observations is unfortunately not analysed.
Due to the breakdown of the pseudo-metastable character of the lower level
of this transition and its sensitivity to even slight changes in the conditions
of the calculations (cf. Sect. 3.1), TTH
exclude this line from
the abundance determination.
Considering the more accurate atomic data in our study, we do not encounter
such severe problems.
|
All gf values from Wiese et al. (1996).
Accuracy indicators: A: 3%, B: 10%, C: 25%.
Non-LTE abundances
|
Venn (1995b) finds non-LTE abundance corrections systematically
larger by ![]() 0.2-0.4dex for
0.2-0.4dex for ![]() Leo, except for the only doublet
line in her study, again N I
Leo, except for the only doublet
line in her study, again N I ![]() 8629, where
8629, where
![]() is almost identical with ours.
The marked non-LTE strengthening in Venn's study has to be
attributed to the large overpopulations of the 3s levels. In Venn's Fig. 8
departure coefficients for a supergiant at
is almost identical with ours.
The marked non-LTE strengthening in Venn's study has to be
attributed to the large overpopulations of the 3s levels. In Venn's Fig. 8
departure coefficients for a supergiant at
![]() =8400K
and
=8400K
and ![]() =1.2(cgs) are displayed. We calculated N I
populations with our
model for the same parameters: Venn's departure coefficient for the
=1.2(cgs) are displayed. We calculated N I
populations with our
model for the same parameters: Venn's departure coefficient for the
![]() level is almost an order of magnitude
larger at the maximum and for
level is almost an order of magnitude
larger at the maximum and for
![]() Venn finds
a continuous rise with decreasing optical depth to a much larger
overpopulation, where we find a similar decrease as displayed in Fig. 5.
The bi of the other excited levels are also enhanced, but to a lesser degree,
which might explain her larger non-LTE abundance corrections.
Moreover, the three lowest-lying levels in Venn's calculation show a
depopulation, while we find them to be in detailed equilibrium.
In Venn's experiments, by modifying the collisional cross-sections, a solution
is found which would bring her results into much better agreement with
ours, cf. Sect. 5.3.2. in Venn (1995b). By artifically increasing
the cross-sections to
Venn finds
a continuous rise with decreasing optical depth to a much larger
overpopulation, where we find a similar decrease as displayed in Fig. 5.
The bi of the other excited levels are also enhanced, but to a lesser degree,
which might explain her larger non-LTE abundance corrections.
Moreover, the three lowest-lying levels in Venn's calculation show a
depopulation, while we find them to be in detailed equilibrium.
In Venn's experiments, by modifying the collisional cross-sections, a solution
is found which would bring her results into much better agreement with
ours, cf. Sect. 5.3.2. in Venn (1995b). By artifically increasing
the cross-sections to ![]() (a0 being the Bohr radius), Venn finds
a reduction of the abundances from quartet lines on the order of 0.3dex,
while the doublet lines remain almost unaffected.
Here, we have to re-emphasize
the superior quality of the collisional excitation cross-sections used
in our model atom, which ensures the accurate coupling of both spin systems.
(a0 being the Bohr radius), Venn finds
a reduction of the abundances from quartet lines on the order of 0.3dex,
while the doublet lines remain almost unaffected.
Here, we have to re-emphasize
the superior quality of the collisional excitation cross-sections used
in our model atom, which ensures the accurate coupling of both spin systems.
A comparison of the non-LTE predictions from our N II model with those of Dufton & Hibbert (1981) and Becker & Butler (1989) cannot be carried out, as those studies concentrate on early B- and late O-type stars, close to the line-strength maximum for N II features, for which we have no observational material.
Two additional FEROS spectra are analysed in the present work. A 10min
exposure for HD111613 was obtained during the observing run in January, 1999.
We also selected a publicly available spectrum of ![]() Ori (#0783, 20 s exposure), taken during commissioning in November, 1998.
Both spectra were processed like the other FEROS data. A S/N of several
hundred is achieved, like in the case of the other three sample stars.
Ori (#0783, 20 s exposure), taken during commissioning in November, 1998.
Both spectra were processed like the other FEROS data. A S/N of several
hundred is achieved, like in the case of the other three sample stars.
For the supergiants,
![]() and
and ![]() are derived simultaneously by finding the
ionization equilibrium of N I/II and by fitting the wings
of the higher Balmer lines (typically from
are derived simultaneously by finding the
ionization equilibrium of N I/II and by fitting the wings
of the higher Balmer lines (typically from
![]() upwards). These
are still formed in photospheric regions, in contrast to the
upwards). These
are still formed in photospheric regions, in contrast to the
![]() and
and
![]() features which are affected
by the stellar wind in supergiants. The profiles are calculated using the
Stark broadening
tables of Vidal et al. (1973). Non-LTE modelling of the
He I lines is used to assess the stellar helium abundance
features which are affected
by the stellar wind in supergiants. The profiles are calculated using the
Stark broadening
tables of Vidal et al. (1973). Non-LTE modelling of the
He I lines is used to assess the stellar helium abundance
![]() .
The stellar density structure responds to
changes in the helium abundance because of its higher mean molecular weight
(see e.g. Kudritzki 1973).
.
The stellar density structure responds to
changes in the helium abundance because of its higher mean molecular weight
(see e.g. Kudritzki 1973).
![]() and
and ![]() have to be appropriately adjusted at this point in some cases, see
Fig. 8. The microturbulent velocity
have to be appropriately adjusted at this point in some cases, see
Fig. 8. The microturbulent velocity ![]() is determined from non-LTE
spectrum synthesis for a large ensemble of Fe II and Ti II lines
by demanding that there is no relation between abundance and line strength.
The metallicity [M/H] of the objects is determined from the mean of
several elements with non-LTE abundance determinations (typically from O, Mg,
S, Ti and Fe). Rotational velocities
is determined from non-LTE
spectrum synthesis for a large ensemble of Fe II and Ti II lines
by demanding that there is no relation between abundance and line strength.
The metallicity [M/H] of the objects is determined from the mean of
several elements with non-LTE abundance determinations (typically from O, Mg,
S, Ti and Fe). Rotational velocities ![]() and macroturbulence
and macroturbulence
![]() in the radial-tangential model are derived
from the detailed synthesis of several spectral lines as both broadening
mechanisms alter the line profile
in different ways (Gray 1992). Usually, several iteration steps are
necessary to obtain the final set of parameters.
For Vega the widely used atmospheric model of Castelli & Kurucz
(1994) is adopted, also calculated with the ATLAS9 code.
in the radial-tangential model are derived
from the detailed synthesis of several spectral lines as both broadening
mechanisms alter the line profile
in different ways (Gray 1992). Usually, several iteration steps are
necessary to obtain the final set of parameters.
For Vega the widely used atmospheric model of Castelli & Kurucz
(1994) is adopted, also calculated with the ATLAS9 code.
The basic properties and atmospheric parameters of the test stars are
summarised in Table 4 with the estimated uncertainties.
Information on the basic properties are adopted
from the
Simbad database at CDS (http://cdsweb.u-strasbg.fr/Simbad.html).
|
|
Acc. |
|
|
|
|||
| N I: | |||||||
| 7423.64 | 10.33 | -0.71 | B+ | 32 | 8.49 | -0.51 | |
| 7442.30 | 10.33 | -0.38 | B+ | 59 | 8.50 | -0.60 | |
| 7468.31 | 10.34 | -0.19 | B+ | 90 | 8.45 | -0.68 | |
| 8680.28 | 10.34 | 0.35 | B+ | S | 8.62 | -1.38 | |
| 8683.40 | 10.33 | 0.09 | B+ | S | 8.57 | -0.95 | |
| 8686.15 | 10.33 | -0.31 | B+ | S | 8.60 | -0.67 | |
| 8703.25 | 10.33 | -0.32 | B+ | S | 8.46 | -0.58 | |
| 8711.70 | 10.33 | -0.23 | B+ | S | 8.51 | -0.61 | |
| 8718.84 | 10.34 | -0.34 | B+ | S | 8.45 | -0.56 | |
| 9045.88 | 12.36 | 0.44 | B | S | 8.41 | -0.61 | |
| 9049.49 | 12.36 | -0.86 | B 25mm} | ||||
| 9049.89 | 12.36 | 0.28 | B | [-1.5ex]S | [-1.5ex]8.48 | [-1.5ex]-0.53 | |
| Mean | 8.50 | 9.08 | |||||
| 0.07 | 0.09 | ||||||
| N II: | |||||||
| 3955.85 | 18.47 | -0.81 | B | 17 | 8.50 | -0.18 | |
| 3995.00 | 18.50 | 0.21 | B | 65 | 8.42 | -0.45 | |
| 4447.03 | 20.41 | 0.23 | B | 27 | 8.52 | -0.26 | |
| 4601.48 | 18.46 | -0.43 | B+ | 26 | 8.43 | -0.24 | |
| 4607.15 | 18.46 | -0.51 | B+ | 23 | 8.48 | -0.22 | |
| 4613.87 | 18.46 | -0.67 | B+ | 19 | 8.39 | -0.21 | |
| 4630.54 | 18.48 | 0.09 | B+ | S | 8.49 | -0.41 | |
| 4643.09 | 18.48 | -0.36 | B+ | S | 8.54 | -0.30 | |
| 4788.14 | 20.65 | -0.36 | B | 8 | 8.53 | -0.09 | |
| 4803.29 | 20.67 | -0.11 | B | 15 | 8.61 | -0.12 | |
| 5045.10 | 18.46 | -0.41 | B+ | 25 | 8.57 | -0.35 | |
| 5666.63 | 18.47 | -0.05 | A | 30 | 8.49 | -0.37 | |
| 5676.02 | 18.46 | -0.37 | A | 19 | 8.50 | -0.29 | |
| 5679.56 | 18.48 | 0.25 | A | 51 | 8.60 | -0.54 | |
| 5686.21 | 18.47 | -0.55 | A | 15 | 8.55 | -0.29 | |
| 5710.77 | 18.48 | -0.52 | A | 16 | 8.59 | -0.32 | |
| Mean | 8.51 | 8.78 | |||||
| 0.06 | 0.11 | ||||||
| N | 8.51 | ... | |||||
| 0.06 | ... | ||||||
| Object |
|
|
|
|
|
| Vega |
|
|
|
|
|
|
|
|
|
|
|
|
| HD111613 |
|
|
|
|
|
| HD92207 |
|
-0.19(1) |
|
|
|
|
|
|
|
|
|
The results match those obtained from the application of the Mg I/II
ionization equilibrium (PaperII) except for one
case: the low Mg I/II effective temperature (9100K) for HD92207
cannot be verified with the N I/II ionization equilibrium. We
attribute this to inaccuracies in the ionizing radiation field longward of
the Lyman jump, which trouble the Mg I ground state ionization but
are not relevant in the case of N I with its higher ionization energy
(cf. Sect. 2.3). Moreover, with the present parameters the agreement
between the complete spectrum synthesis and the observations is improved.
Nevertheless, in the case of the early A-type supergiants not too close to
the Eddington limit, i.e. at luminosity classes below Ia, the Mg I/II
ionization equilibrium appears to be a statistically more significant temperature
indicator, as several lines in both ionization stages are available, in
contrast to nitrogen, where only one N II line is strong enough to be
observed. In the late B supergiant regime ionization equilibria of other
elements, like O I/II, Al II/III, Si II/III or
S II/III, can also be used. We derive an identical effective
temperature for ![]() Ori from the non-LTE ionization equilibria of
O I/II and S II/III using the merged model atoms of
PaperI (O I) and Becker & Butler
(1988; O II) and
of Vrancken et al. (1996; S II/III).
Ori from the non-LTE ionization equilibria of
O I/II and S II/III using the merged model atoms of
PaperI (O I) and Becker & Butler
(1988; O II) and
of Vrancken et al. (1996; S II/III).
Besides our own determinations of the stellar parameters for two of the
supergiants, ![]() Leo and
Leo and ![]() Ori, data have been obtained in several
previous studies. For
Ori, data have been obtained in several
previous studies. For ![]() Leo, Venn (1995a) finds a
Leo, Venn (1995a) finds a
![]() of
of
![]() K and
K and ![]() of
of
![]() (cgs) from spectroscopic
indicators, viz H
(cgs) from spectroscopic
indicators, viz H![]() wing fitting and the Mg I/II non-LTE
ionization equilibrium, being in perfect agreement with our findings.
Previous work on the stellar parameters of
wing fitting and the Mg I/II non-LTE
ionization equilibrium, being in perfect agreement with our findings.
Previous work on the stellar parameters of ![]() Leo is summarized by
Lobel et al. (1992), who also find (
Leo is summarized by
Lobel et al. (1992), who also find (
![]() K/
K/
![]() )
from a reanalysis of the photographic observations of Wolf (1971).
The data are obtained by various techniques; to assess their
accuracy we have to note that they are based on less elaborate (LTE)
atmospheric models
and on photographic plate observations, resulting in a wide spread.
In addition to this, Lambert et al. (1988) use the values
(10500K/2.2) for their analysis, without giving details of their derivation.
The values reported by the different authors are marked in Fig. 8.
)
from a reanalysis of the photographic observations of Wolf (1971).
The data are obtained by various techniques; to assess their
accuracy we have to note that they are based on less elaborate (LTE)
atmospheric models
and on photographic plate observations, resulting in a wide spread.
In addition to this, Lambert et al. (1988) use the values
(10500K/2.2) for their analysis, without giving details of their derivation.
The values reported by the different authors are marked in Fig. 8.
For ![]() Ori two alternative groups of disjunct effective temperatures
are found in the literature. The more recent
determinations by McErlean et al. (1999), Israelian et al.
(1997) and Takeda (1994) all agree on a
Ori two alternative groups of disjunct effective temperatures
are found in the literature. The more recent
determinations by McErlean et al. (1999), Israelian et al.
(1997) and Takeda (1994) all agree on a
![]() of 13000K with
of 13000K with ![]() varying between 1.6 and 2.1(cgs).
The former two studies adopt pure H+He non-LTE atmospheres for their
analysis, thus neglecting the important line-blanketing, which will introduce
a systematic shift in temperature.
In the latter study the parameters are derived from photometric indicators
(Balmer jump and the Paschen continuum gradient) and the H
varying between 1.6 and 2.1(cgs).
The former two studies adopt pure H+He non-LTE atmospheres for their
analysis, thus neglecting the important line-blanketing, which will introduce
a systematic shift in temperature.
In the latter study the parameters are derived from photometric indicators
(Balmer jump and the Paschen continuum gradient) and the H![]() and H
and H![]() wings on the basis of a coarse grid of ATLAS6 atmospheres
(Kurucz 1979). The high temperature value mostly results from the
photometric indices, where inevitable corrections might result in a systematic
shift. A number of studies derive the temperature directly
from measured fluxes and interferometric stellar radius determinations or
from the infra-red flux method. Lower temperatures have been found:
wings on the basis of a coarse grid of ATLAS6 atmospheres
(Kurucz 1979). The high temperature value mostly results from the
photometric indices, where inevitable corrections might result in a systematic
shift. A number of studies derive the temperature directly
from measured fluxes and interferometric stellar radius determinations or
from the infra-red flux method. Lower temperatures have been found:
![]() (Code et al. 1976),
(Code et al. 1976),
![]() (Beeckmans 1977),
(Beeckmans 1977),
![]() (Stalio et al.
1977), 11780
(Underhill et al. 1979), 11014 (Blackwell et al.
1980), 11380 (Underhill & Doazan 1982) and
11023/11453 (Glushneva 1985). Systematic errors
will arise from inappropriate corrections for interstellar absorption.
Indeed, of these, the only study that accounts for a non-zero EB-V
(Stalio et al. 1977, +0.04 vs. +0.05 as derived in
Paper IV) finds a temperature in excellent
accordance with our value.
(Stalio et al.
1977), 11780
(Underhill et al. 1979), 11014 (Blackwell et al.
1980), 11380 (Underhill & Doazan 1982) and
11023/11453 (Glushneva 1985). Systematic errors
will arise from inappropriate corrections for interstellar absorption.
Indeed, of these, the only study that accounts for a non-zero EB-V
(Stalio et al. 1977, +0.04 vs. +0.05 as derived in
Paper IV) finds a temperature in excellent
accordance with our value.
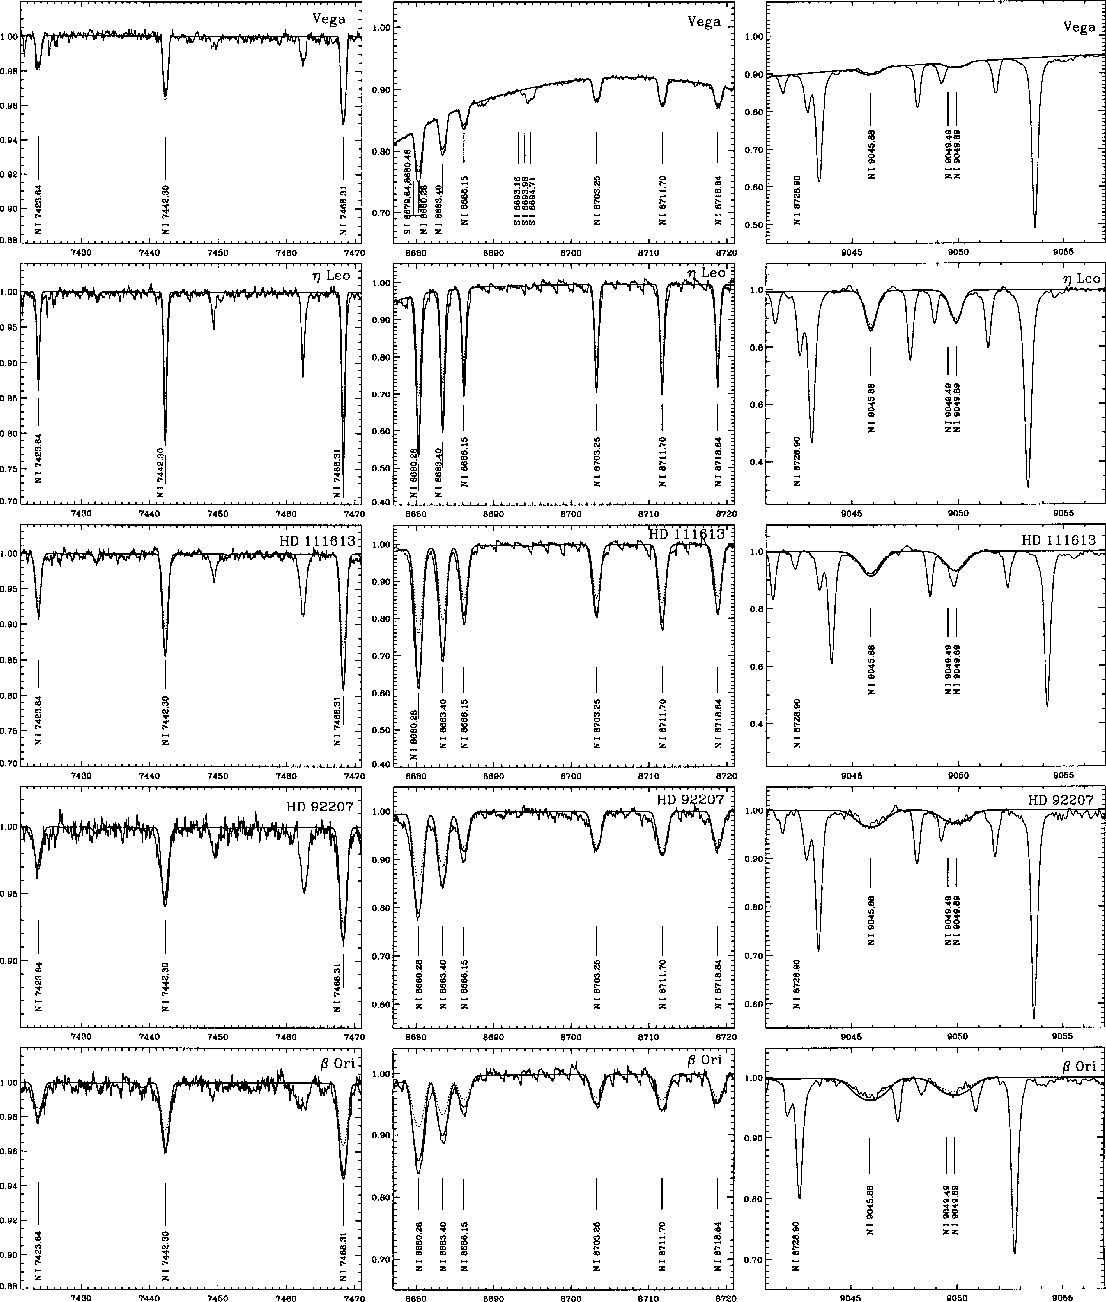 |
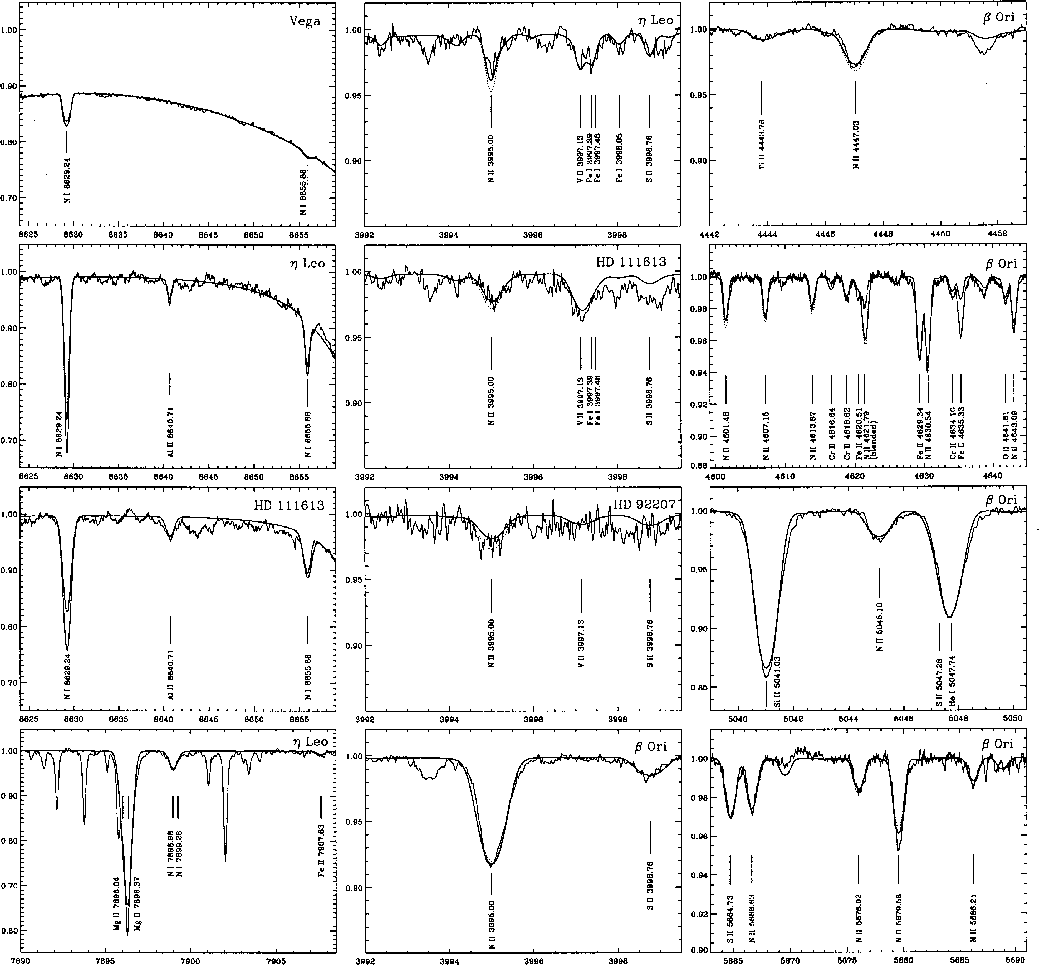
Figure 9: Spectrum synthesis for selected N I/II lines in the test stars. Abscissa units are wavelengths in Å, ordinate is relative flux. Observed (thin solid) and computed (thick solid) non-LTE profiles for the mean nitrogen abundances in Tables 5 and 6 are displayed with line identifiers. Profiles for the appropriate LTE abundances are marked by a dotted line. Line formation for species other than H I, He I, C I/II, N I/II, O I/II, Mg I/II, S II/III, Ti II, Fe II is performed assuming LTE level populations (see Paper IV for details). The spectra in the red are contaminated by numerous sharp telluric lines and the FEROS data reduction is troubled by CCD fringes in the spectral region around 8700Å. Note also, that the continuum in the red is often determined by the (overlapping) wings of the Paschen lines. |
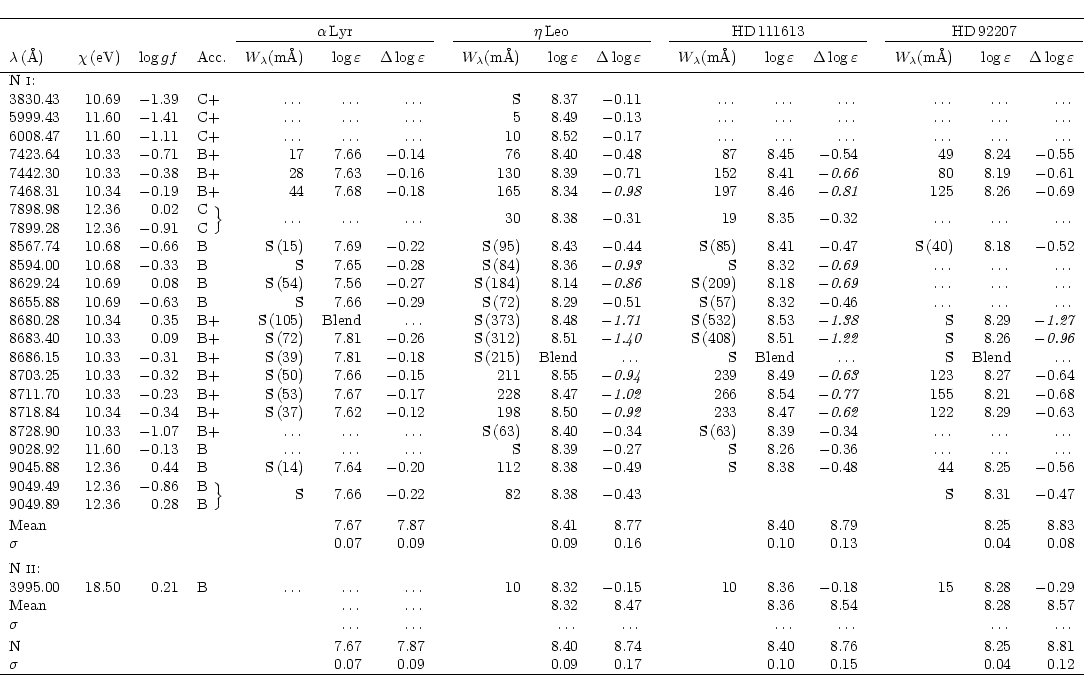
The results of the abundance analysis for nitrogen are summarised in
Table 5 and 6 which give the wavelength,
excitation potential of the lower level and the adopted gf value for the
observed lines, with accuracy
indicators and sources for the gf values. Measured equivalent
widths, derived non-LTE abundances
 |
(3) |
| (4) |
In Fig. 9 theoretical line profiles for the
derived mean non-LTE nitrogen abundance are compared with the observations;
excellent agreement is found for almost all lines. Discrepancies worth
mentioning occur only for N I ![]() 8629, the strongest line in
the doublet spin system in the present study. N II
8629, the strongest line in
the doublet spin system in the present study. N II ![]() 4621 is
strongly blended by a Fe II line with an apparently inaccurate
gf-value, as the other N II lines of the same multiplet give
consistent results. The lines in the A-type supergiants with
4621 is
strongly blended by a Fe II line with an apparently inaccurate
gf-value, as the other N II lines of the same multiplet give
consistent results. The lines in the A-type supergiants with
![]()
![]() 300 mÅ, typically the N I
300 mÅ, typically the N I
![]() 8680/83 features,
also show an indication of the presence of an additional broadening process,
probably connected to the hydrodynamical outflow at the base of the stellar
wind, as the broadening becomes more pronounced for increasing mass-loss rates
at comparable line strengths; the line depths, on the other hand, are well
reproduced.
By analysing only integrated quantities, i.e. equivalent widths, this problem
will not be noticed and will lead to additional discrepancies between the
weak and strong line analyses. For comparison, profiles
from the mean LTE abundance are also shown, which give less satisfactory fits,
most notably due to the systematic effects of non-LTE on the strongest lines.
As some of the nitrogen lines are formed in the wings
of H I lines, profiles for hydrogen are calculated on the basis
of non-LTE level populations and Stark profiles from Vidal et al.
(1973), for the supergiants, and Stehlé & Hutcheon
(1999), for the strongly overlapping Paschen lines in Vega.
Apart from these, the following elements are
treated in non-LTE to account for line blends: He I
(Husfeld et al. 1989),
C I/II (Paper III), O I/II
(PaperI; Becker & Butler 1988),
Mg I/II (PaperII), S II/III
(Vrancken et al. 1996) and Ti II and Fe II
(Becker
1998), with updated atomic data in several of the older models.
The remaining elements with observed lines are included in LTE for the spectrum
synthesis. This allows the reproduction of almost the entire observed
spectral features. A detailed study of the test stars is performed elsewhere
(Paper IV).
8680/83 features,
also show an indication of the presence of an additional broadening process,
probably connected to the hydrodynamical outflow at the base of the stellar
wind, as the broadening becomes more pronounced for increasing mass-loss rates
at comparable line strengths; the line depths, on the other hand, are well
reproduced.
By analysing only integrated quantities, i.e. equivalent widths, this problem
will not be noticed and will lead to additional discrepancies between the
weak and strong line analyses. For comparison, profiles
from the mean LTE abundance are also shown, which give less satisfactory fits,
most notably due to the systematic effects of non-LTE on the strongest lines.
As some of the nitrogen lines are formed in the wings
of H I lines, profiles for hydrogen are calculated on the basis
of non-LTE level populations and Stark profiles from Vidal et al.
(1973), for the supergiants, and Stehlé & Hutcheon
(1999), for the strongly overlapping Paschen lines in Vega.
Apart from these, the following elements are
treated in non-LTE to account for line blends: He I
(Husfeld et al. 1989),
C I/II (Paper III), O I/II
(PaperI; Becker & Butler 1988),
Mg I/II (PaperII), S II/III
(Vrancken et al. 1996) and Ti II and Fe II
(Becker
1998), with updated atomic data in several of the older models.
The remaining elements with observed lines are included in LTE for the spectrum
synthesis. This allows the reproduction of almost the entire observed
spectral features. A detailed study of the test stars is performed elsewhere
(Paper IV).
| Source |
|
|
|
|
| This work |
|
... |
|
... |
| Lemke & Venn (1996) |
|
... |
|
... |
| Rentzsch-Holm (1996) |
|
... |
|
... |
| Takada-Hidai & Takeda (1996) | ... | ... | ... | |
| Roby & Lambert (1990) |
|
... | ... | ... |
| Venn & Lambert (1990) |
|
... | ... | ... |
| Sadakane & Okyudo (1989) |
|
... | ... | ... |
| Lambert et al. (1982) |
|
... | ... | ... |
| This work |
|
8.47(1) |
|
8.32(1) |
| Venn (1995b) |
|
... |
|
... |
| Takeda & Takada-Hidai (1995) | ... |
|
... | |
| Lambert et al. (1988) | 9.0 | ... | ... | ... |
| This work |
|
|
|
|
| Takeda & Takada-Hidai (1995) |
|
... |
|
... |
In Table 7 the results from
the abundance analysis of the light elements (He, CNO) in the sample
stars relative to the solar composition (Grevesse & Sauval 1998)
are summarised,
![]() ,
as needed in the subsequent discussion.
We list the values obtained from the non-LTE analysis together with the
1
,
as needed in the subsequent discussion.
We list the values obtained from the non-LTE analysis together with the
1![]() -uncertainties from the line-to-line scatter and in the case of
nitrogen also from the systematic errors,
cf. Sect. 2.4, where the latter is the weighted (quadratic) mean from
the contributions of N I and N II lines, respectively, to the
total nitrogen abundance from both ionic species. The total number of analysed
lines is given in parentheses. In the last column the sum of CNO in the
sample stars relative to solar is diplayed.
-uncertainties from the line-to-line scatter and in the case of
nitrogen also from the systematic errors,
cf. Sect. 2.4, where the latter is the weighted (quadratic) mean from
the contributions of N I and N II lines, respectively, to the
total nitrogen abundance from both ionic species. The total number of analysed
lines is given in parentheses. In the last column the sum of CNO in the
sample stars relative to solar is diplayed.
Non-LTE effects strengthen the
N I/II lines systematically, thus the derived abundances decrease in
comparison to LTE determinations. The N I lines around
![]() 8200 Å are not analysed here, due to the contamination of the
spectral region by terrestrial H2O lines and problems in the accurate
determination of the local continuum, due to merging high Paschen
lines/Paschen continuum.
8200 Å are not analysed here, due to the contamination of the
spectral region by terrestrial H2O lines and problems in the accurate
determination of the local continuum, due to merging high Paschen
lines/Paschen continuum.
Vega shows a nitrogen deficiency of 0.25 dex when compared to the solar
abundance. This agrees well with the
results for the other light elements
and confirms similar findings by previous studies, but to a higher
statistical significance.
When compared to the general underabundance of the heavier elements by
![]() 0.5 dex, this pattern leads to the conclusion that Vega is a mild
0.5 dex, this pattern leads to the conclusion that Vega is a mild
![]() Bootis star (Venn & Lambert 1990). The non-LTE abundance
corrections are moderate in this main sequence object, not exceeding
0.3 dex for single lines and being 0.2 dex in the mean.
Bootis star (Venn & Lambert 1990). The non-LTE abundance
corrections are moderate in this main sequence object, not exceeding
0.3 dex for single lines and being 0.2 dex in the mean.
In contrast, the four supergiants in our sample show nitrogen abundances
![]() 0.3-0.6 dex above solar.
This finding is in excellent accord with the predictions of the new
stellar evolution models accounting for rotation (Meynet & Maeder
2000; Heger & Langer 2000), especially, as carbon
is found to be depleted in these objects
and helium also enriched, with the sum of the CNO abundances remaining
close to solar. CN-processed matter has apparently been mixed to the
surface layers. The striking fact that the sample supergiant at lowest
luminosity and therefore lowest mass,
0.3-0.6 dex above solar.
This finding is in excellent accord with the predictions of the new
stellar evolution models accounting for rotation (Meynet & Maeder
2000; Heger & Langer 2000), especially, as carbon
is found to be depleted in these objects
and helium also enriched, with the sum of the CNO abundances remaining
close to solar. CN-processed matter has apparently been mixed to the
surface layers. The striking fact that the sample supergiant at lowest
luminosity and therefore lowest mass, ![]() Leo, shows one of the strongest
nitrogen enrichments (and a corresponding carbon underabundance) indicates a
blue-loop scenario for this
star, with a first dredge-up N/C ratio, cf. the 9
Leo, shows one of the strongest
nitrogen enrichments (and a corresponding carbon underabundance) indicates a
blue-loop scenario for this
star, with a first dredge-up N/C ratio, cf. the 9![]() - approx.
- approx. ![]() Leo's mass - evolutionary track of Meynet & Maeder
(2000). On the other hand, the
remaining three supergiants seem to have evolved directly from the main
sequence, see Paper IV for a further discussion.
A wide range in the non-LTE abundance corrections is found in the
supergiants, for the strongest lines well in excess of 1 dex. Thus, reliable
abundance analyses for this element cannot be performed under
the assumption of LTE.
Leo's mass - evolutionary track of Meynet & Maeder
(2000). On the other hand, the
remaining three supergiants seem to have evolved directly from the main
sequence, see Paper IV for a further discussion.
A wide range in the non-LTE abundance corrections is found in the
supergiants, for the strongest lines well in excess of 1 dex. Thus, reliable
abundance analyses for this element cannot be performed under
the assumption of LTE.
Non-LTE abundances are determined in three other studies. Lemke & Venn
(1996) find a slightly lower nitrogen abundance; in order to reduce
their line-to-line scatter they exclude the doublet lines, as they find
discrepancies in the non-LTE calculations between the doublet and quartet term
systems.
Rentzsch-Holm (1996) finds an nitrogen abundance larger
than our value by 0.10 dex with an enhanced statistical scatter. The
only doublet line in that analysis also shows large inconsistencies to the
quartet results (by almost 0.4 dex). Takada-Hidai & Takeda (1996)
present corrections to the original work by Takeda (1992) where
the influence of the Paschen lines on the formation of several N I
lines in the near-IR was neglected, which resulted in a surprisingly low
value of
![]()
![]() 7.2 instead of
7.2 instead of ![]() 7.5, as derived
in the more recent work. However, Takada-Hidai & Takeda expect
this to be also underestimated.
In comparison, with our new model atom we find no discrepancies
between the doublet and quartet spin system lines (we attribute this to the
usage of accurate collisional data) and the statistical error
is also reduced, also indicating an improvement.
7.5, as derived
in the more recent work. However, Takada-Hidai & Takeda expect
this to be also underestimated.
In comparison, with our new model atom we find no discrepancies
between the doublet and quartet spin system lines (we attribute this to the
usage of accurate collisional data) and the statistical error
is also reduced, also indicating an improvement.
In this case, the comparison of the LTE results is also very instructive.
Only one weak line (
![]()
![]() 150mÅ) is present in
the Takeda & Takada-Hidai (1995) study, N I
150mÅ) is present in
the Takeda & Takada-Hidai (1995) study, N I ![]() 8728.
We adopt the corresponding LTE value for their LTE mean abundance for this star.
Takeda & Takada-Hidai (1995) adopt different stellar parameters
from the literature (
8728.
We adopt the corresponding LTE value for their LTE mean abundance for this star.
Takeda & Takada-Hidai (1995) adopt different stellar parameters
from the literature (
![]() K/
K/
![]() ).
Consequently they
derive a slightly higher LTE N I abundance for similar gf-values
and measured equivalent widths, which can be understood qualitatively.
Venn on the other hand uses almost the same stellar parameters, (9700/2.0) vs.
our (9600/2.0), with an identical microturbulence. Both sets of gf-values are
almost identical and her equivalent widths are (except for one line)
systematically smaller by
).
Consequently they
derive a slightly higher LTE N I abundance for similar gf-values
and measured equivalent widths, which can be understood qualitatively.
Venn on the other hand uses almost the same stellar parameters, (9700/2.0) vs.
our (9600/2.0), with an identical microturbulence. Both sets of gf-values are
almost identical and her equivalent widths are (except for one line)
systematically smaller by ![]() 10%. From this, Venn's higher LTE abundance
- by more than 70% - is surprising. However, when comparing only the
three lines used by Venn in her LTE analysis this difference is reduced to
0.1 dex, which agrees within the corresponding uncertainties.
10%. From this, Venn's higher LTE abundance
- by more than 70% - is surprising. However, when comparing only the
three lines used by Venn in her LTE analysis this difference is reduced to
0.1 dex, which agrees within the corresponding uncertainties.
In addition, Lambert et al. (1988) analysed several N I lines of this supergiant in LTE for significantly different stellar parameters (10500/2.2) and lower gf-values in the doublet spin system, cf. their Table 2, which qualitatively explains their higher abundance result.
Vega
![]() (14)
(14)
![]() Leo
Leo
![]() (21)
(21)
HD111613
![]() (17)
(17)
HD92207
![]() (12)
(12)
![]() Ori
Ori
![]() (27).
(27).
The nitrogen underabundance by 0.25 dex in Vega supports the claims for a
deficit of the light elements by ![]() 0.3 dex in this star, in contrast to
the
0.3 dex in this star, in contrast to
the ![]() 0.5 dex underabundance of the refractory (
0.5 dex underabundance of the refractory (![]() - and iron-peak)
elements, which lead to the conclusion that Vega is a mild
- and iron-peak)
elements, which lead to the conclusion that Vega is a mild ![]() Bootis
star. In the sample supergiants, we find nitrogen overabundances by
Bootis
star. In the sample supergiants, we find nitrogen overabundances by
![]() 0.3-0.6 dex, which in view of accompanying carbon underabundances -
with the sum of the carbon and nitrogen abundances staying close to solar -
indicates the presence of CN-cycled matter in the atmospheric layers.
This observational finding is in excellent accord with the predictions
of the new stellar evolution calculations accounting for mass-loss and rotation.
Our model results match the observed profiles well.
0.3-0.6 dex, which in view of accompanying carbon underabundances -
with the sum of the carbon and nitrogen abundances staying close to solar -
indicates the presence of CN-cycled matter in the atmospheric layers.
This observational finding is in excellent accord with the predictions
of the new stellar evolution calculations accounting for mass-loss and rotation.
Our model results match the observed profiles well.
In comparison with previous non-LTE studies on N I, in particular for supergiants, we find significantly higher abundances, up to a factor of 2. This has a large impact on the interpretation of the evolutionary status of such stars, when compared with stellar evolution models. We obtain our conclusions from observational material at higher S/N and larger wavelength coverage (i.e. more lines are available) and from a model atom accounting for improved atomic data; consistent results are derived from N I lines of the doublet and quartet spin systems alike - avoiding the inconsistencies found in the previous studies - and from N II lines.
In a main sequence star like Vega, the non-LTE abundance corrections
for N I lines are below 0.3 dex. This changes drastically for
supergiants, where atmospheric nitrogen overabundances produce strong lines,
with line formation regions extending over considering parts of the
atmosphere where departure coefficients deviate significantly from unity.
Non-LTE abundance corrections in excess of 1 dex are found in some cases.
N II lines are observable in the supergiants due to the nitrogen
overabundances and are otherwise absent in late B- and early A-type stars;
abundance corrections for this ionic species amount to ![]() 0.5 dex
in the mean.
Both, N I and N II lines are strengthened systematically in
non-LTE.
The nature of the non-LTE effects is well understood for N I but
for N II the smallness of the non-LTE departures complicates the
identification of the responsible effects. A strong sensitivity
of the N I lines to changes in the collisional excitation data is found.
Accurate energy-dependent collision strengths for a large number of
transitions are used for the first time.
0.5 dex
in the mean.
Both, N I and N II lines are strengthened systematically in
non-LTE.
The nature of the non-LTE effects is well understood for N I but
for N II the smallness of the non-LTE departures complicates the
identification of the responsible effects. A strong sensitivity
of the N I lines to changes in the collisional excitation data is found.
Accurate energy-dependent collision strengths for a large number of
transitions are used for the first time.
Subtle effects are evoked by the inclusion of the microturbulence parameter in the statistical-equilibrium calculations for N I/II. In contrast to the standard approach - accounting for microturbulence only in the line formation - even weak lines might be affected by modified level populations. N I lines are strengthened in most cases while the N II lines are unaffected. This can result not only in different abundances but - when using the N I/II ionization equilibrium as a temperature indicator - also in modified stellar parameters. The effect is small but cannot be neglected for high quality observations.
Acknowledgements
We are grateful to A. Kaufer for his help in obtaining some of the spectra at La Silla and to S. Tubbesing for his aid with the data reduction. Our work has benefitted from the beautiful spectrum of Vega contributed by A. Korn. We would further like to thank R. M. Frost for providing extended tabulations of collisional data in digital form and K. A. Venn and Y. Takeda for clarifying comments and J. Puls for helpful discussions. This research has made use of the Simbad database, operated at CDS, Strasbourg, France.
![\begin{figure}
\par\includegraphics[width=8.1cm,clip]{ms1631f1a.eps}\hspace*{10m...
...\hspace*{10mm}
\includegraphics[width=8.1cm,clip]{ms1631f1d.eps}\par\end{figure}](/articles/aa/full/2001/45/aa1631/img20.gif)
![\begin{figure}
\par\mbox{
\includegraphics[width=8.8cm,clip]{ms1631f6a.eps}\includegraphics[width=8.8cm,clip]{ms1631f6b.eps} }
\end{figure}](/articles/aa/full/2001/45/aa1631/img109.gif)
![\begin{figure}
\par\includegraphics[width=8.7cm,clip]{ms1631f8a.eps}\hspace*{5mm}
\includegraphics[width=8.7cm,clip]{ms1631f8b.eps}\par\end{figure}](/articles/aa/full/2001/45/aa1631/img123.gif)