The photometric reduction of the combined U-, V- and
![]() -band images was performed
using the DAOPHOT II programme (Stetson 1987,1994).
First, we located all the objects that were >3
-band images was performed
using the DAOPHOT II programme (Stetson 1987,1994).
First, we located all the objects that were >3![]() above the
background on individual images.
More than 50 relatively bright, not saturated, isolated,
stellar objects were chosen to create the variable PSF for each image.
ALLSTAR fitting of the PSF to all the objects produced the object
lists that were matched with DAOMATCH and DAOMASTER, where only objects
with good photometry in at least two frames were kept. The final
photometric catalogue was obtained with ALLFRAME which uses as
input information photometry lists from ALLSTAR and fits the PSF to all
frames (in U, V and K-band) simultaneously.
Again, only the objects detected in at least 2 images
were kept. Using the information on the location of stars in all bands
simultaneously improved our photometry, which is deeper by
above the
background on individual images.
More than 50 relatively bright, not saturated, isolated,
stellar objects were chosen to create the variable PSF for each image.
ALLSTAR fitting of the PSF to all the objects produced the object
lists that were matched with DAOMATCH and DAOMASTER, where only objects
with good photometry in at least two frames were kept. The final
photometric catalogue was obtained with ALLFRAME which uses as
input information photometry lists from ALLSTAR and fits the PSF to all
frames (in U, V and K-band) simultaneously.
Again, only the objects detected in at least 2 images
were kept. Using the information on the location of stars in all bands
simultaneously improved our photometry, which is deeper by ![]() 1 mag with
respect to ALLSTAR photometry. Moreover, the treatment of close companions,
in particular the ones
that have different colors, is much better with ALLFRAME.
1 mag with
respect to ALLSTAR photometry. Moreover, the treatment of close companions,
in particular the ones
that have different colors, is much better with ALLFRAME.
NGC 5128 is close enough that its globular clusters appear slightly
resolved, in the sense of having a larger FWHM and non-stellar PSF
(Minniti et al. 1996; Rejkuba 2001).
Restricting the sharpness and goodness of the fit parameters to
-0.7< SHARP <0.7, we rejected most of the
galaxies, star clusters and other extended objects as well as remaining
blemishes and cosmic rays from the final photometry list. Also stars with
large photometric uncertainties in one or more filters (
![]() mag)
were rejected.
mag)
were rejected.
![\begin{figure}
\par\includegraphics[angle=270,width=12.8cm,clip]{MS1535f3.eps} \end{figure}](/articles/aa/full/2001/45/aa1535/img33.gif) |
Figure 3: Photometric calibration of Landolt (1992) stars during the nights of observations in U and V filters. Left panels: the scatter for the calibration without the color term; right panels: the scatter for the calibration with the color term. |
For the photometric calibration of the optical images, standard stars from
the catalogue of Landolt (1992) were used.
We checked the photometric
quality of the two nights separately and since both were photometric,
with almost identical zeropoints, we
combined the standard stars for the two nights. Using a total of 14 stars in
4 different fields, spanning the color range
-1.321<(U-V)< 4.162,
we derived the following calibration transformations:
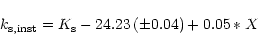
Observations at our reference ![]() -band epoch (G in Table 1) were taken
in photometric conditions. During the same night, July 8 2000,
three standard stars from the list of Persson et al. (1998) were observed. Each standard star
was observed at 5 different positions on the IR-array. In this way, a total of
15 independent measurements were obtained. However, the number of
measurements with different airmass was only 3, so that we preferred to adopt
the mean extinction coefficients measured on Paranal for
-band epoch (G in Table 1) were taken
in photometric conditions. During the same night, July 8 2000,
three standard stars from the list of Persson et al. (1998) were observed. Each standard star
was observed at 5 different positions on the IR-array. In this way, a total of
15 independent measurements were obtained. However, the number of
measurements with different airmass was only 3, so that we preferred to adopt
the mean extinction coefficients measured on Paranal for ![]() -band
of 0.05 mag/airmass.
The derived zeropoint of the
G-epoch observations is
-band
of 0.05 mag/airmass.
The derived zeropoint of the
G-epoch observations is
![]() .
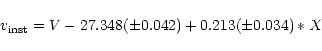
The following calibration equation
was applied to our data:
.
The following calibration equation
was applied to our data:
![\begin{figure}
\par\includegraphics[angle=270,width=8.7cm,clip]{MS1535f6.eps} \end{figure}](/articles/aa/full/2001/45/aa1535/img45.gif) |
Figure 6:
The completeness as function of radial distance from the center
of NGC 5128 calculated around 90% completeness limit for U- and V-band
(for (U-V)=0.7)
and around 65% for |
We made extensive tests to measure completeness and magnitude uncertainties
as a function of magnitude and radial distance from the center of the galaxy.
The completeness for the U, V and ![]() -band photometry has
been calculated using the ADDSTAR programme within DAOPHOT.
We made twenty artificial star experiments, adding each time
-band photometry has
been calculated using the ADDSTAR programme within DAOPHOT.
We made twenty artificial star experiments, adding each time ![]() 3000 stars to the first frame. The stars were added on a regular grid separated
by
3000 stars to the first frame. The stars were added on a regular grid separated
by
![]() 1 pixels in order not to
alter crowding (where RPSF is the PSF radius used for fitting the
image with the worst seeing) and having magnitudes randomly distributed in
the observed range. The position of the first star in the list was chosen
randomly, so that over 20 different experiments the added stars were uniformly
distributed over the whole field. After the appropriate
coordinate shifts were applied and magnitudes changed to the instrumental
system taking into account the observed magnitudes and colors, the same
stars from the first frame were added also to all other frames.
Their photometry was
recomputed in the same way as for the original images. The stellar PSF
obtained from the field stars for the respective image was used in
the simulations. Incompleteness in Field 1,
defined by a recovery rate of 50% from the artificial-star experiment,
sets in around magnitude
25 in the U-band (but depends strongly on U-Vcolor; see Fig. 4)
and 22.5 in
1 pixels in order not to
alter crowding (where RPSF is the PSF radius used for fitting the
image with the worst seeing) and having magnitudes randomly distributed in
the observed range. The position of the first star in the list was chosen
randomly, so that over 20 different experiments the added stars were uniformly
distributed over the whole field. After the appropriate
coordinate shifts were applied and magnitudes changed to the instrumental
system taking into account the observed magnitudes and colors, the same
stars from the first frame were added also to all other frames.
Their photometry was
recomputed in the same way as for the original images. The stellar PSF
obtained from the field stars for the respective image was used in
the simulations. Incompleteness in Field 1,
defined by a recovery rate of 50% from the artificial-star experiment,
sets in around magnitude
25 in the U-band (but depends strongly on U-Vcolor; see Fig. 4)
and 22.5 in ![]() -band (Fig. 5).
The corresponding numbers for Field 2 are 25 for U-band
and 21.3 for
-band (Fig. 5).
The corresponding numbers for Field 2 are 25 for U-band
and 21.3 for ![]() -band.
The difference at
-band.
The difference at
![]() -band between the two fields is due to (1) better
seeing in Field 1 (
-band between the two fields is due to (1) better
seeing in Field 1 (
![]() pix vs. 2.7 pix) and (2) higher
surface brightness in Field 2.
pix vs. 2.7 pix) and (2) higher
surface brightness in Field 2.
Dependence of the completeness on radial distance from the center of the
galaxy (
![]() ,
,
![]() )
was calculated for the magnitude bin around 90%
level of completeness in U- and V-band (Fig. 6) and around
65% of completeness in
)
was calculated for the magnitude bin around 90%
level of completeness in U- and V-band (Fig. 6) and around
65% of completeness in ![]() -band.
There is no significant spatial variation of completeness in our data.
-band.
There is no significant spatial variation of completeness in our data.
To assess the accuracy of our photometry, we calculated the difference between the input and recovered magnitudes for each magnitude bin (Figs. 4, 5). Our photometry is reliable down to the incompleteness limit and blending does not seriously affect our data (see the discussion in Sect. 4.2). For magnitudes fainter than the 50% completeness limit, the measured values are systematically brighter, because of the bias towards brighter fluctuations and blending due to crowding. The colors of the recovered stars with magnitudes fainter than the 50% completeness limits are redder than the input colors in the UV CMDs (Fig. 4), due to the larger incompleteness in the U- than in the V-band. In the VK CMDs the colors of the recovered stars range from slightly redder than the input color for the very red stars, due to the dominant incompleteness in the V-band, to bluer for the faintest and bluest stars, due to the dominant incompleteness in the K-band (Fig. 5). We did not correct our data for this systematic shift, because magnitudes fainter than the 50% completeness limit will not be used in further analysis.
Contamination by foreground Galactic stars and unresolved background galaxies
is important because of the low Galactic latitude of our fields
(
![]() )
and the very deep photometric limits observed.
We used the Besançon group model of stellar population synthesis of the
Galaxy available through the
Web
)
and the very deep photometric limits observed.
We used the Besançon group model of stellar population synthesis of the
Galaxy available through the
Web![]() (Robin & Creze 1986;
Robin et al. 1996) to simulate the total number
and optical magnitude and color distribution of Galactic foreground
stars in our fields.
The simulated catalogue has 1827 stars in the FORS1 field
(
(Robin & Creze 1986;
Robin et al. 1996) to simulate the total number
and optical magnitude and color distribution of Galactic foreground
stars in our fields.
The simulated catalogue has 1827 stars in the FORS1 field
(
![]() )
in the magnitude interval
18<V<30. In order to get a realistic estimate for the number of stars
that would be observed in our fields, the correction for completeness
is necessary. Therefore, we
added the stars from the simulated catalogue (with magnitudes scaled to
correspond to instrumental magnitudes) to our images and re-measured
their magnitudes. In this way, realistic photometric uncertainties were
applied and
the number of stars recovered in two fields was corrected for completeness.
A total of 340 and 350 stars with U- and V-band photometry satisfying
profile fitting and photometric uncertainty
selection criteria were measured in Field 1 and 2, respectively.
Most of the foreground stars have 0<U-V<3 (Fig. 7). All
of the stars in the red part of the Field 2 CMD brighter than
)
in the magnitude interval
18<V<30. In order to get a realistic estimate for the number of stars
that would be observed in our fields, the correction for completeness
is necessary. Therefore, we
added the stars from the simulated catalogue (with magnitudes scaled to
correspond to instrumental magnitudes) to our images and re-measured
their magnitudes. In this way, realistic photometric uncertainties were
applied and
the number of stars recovered in two fields was corrected for completeness.
A total of 340 and 350 stars with U- and V-band photometry satisfying
profile fitting and photometric uncertainty
selection criteria were measured in Field 1 and 2, respectively.
Most of the foreground stars have 0<U-V<3 (Fig. 7). All
of the stars in the red part of the Field 2 CMD brighter than ![]() are expected to be foreground stars (see Sect. 4.1).
In order to adjust for the expected number of Galactic stars we
normalized the models to the observed number of reddest stars in
Field 2. Thus the total number of foreground stars was increased by 31%
in both fields.
are expected to be foreground stars (see Sect. 4.1).
In order to adjust for the expected number of Galactic stars we
normalized the models to the observed number of reddest stars in
Field 2. Thus the total number of foreground stars was increased by 31%
in both fields.
The Galaxy model simulation supplies
not only the colors of the simulated stars, but also their metallicities,
ages, spectral types and luminosity classes. Using all these data and
the Kurucz (1998)
model atmospheres![]() ,
we derived the foreground contamination in the K-band.
After correction for completeness, the expected number of foreground stars
in ISAAC images is 112 and 91 in the VK CMD of Field 1 and 2, respectively.
All of the foreground stars have
1.0< V-K < 4.5(Fig. 7 right panel).
,
we derived the foreground contamination in the K-band.
After correction for completeness, the expected number of foreground stars
in ISAAC images is 112 and 91 in the VK CMD of Field 1 and 2, respectively.
All of the foreground stars have
1.0< V-K < 4.5(Fig. 7 right panel).
The measured number of compact
background galaxies on the FORS1 images, taken in
similar observing conditions, is
![]() 400 in the magnitude
range V=20-25 mag for the selection of sharpness parameter
400 in the magnitude
range V=20-25 mag for the selection of sharpness parameter
![]() (Jerjen & Rejkuba 2001). Our tighter selection
criteria (
(Jerjen & Rejkuba 2001). Our tighter selection
criteria (
![]() )
eliminated most of them.
In the smaller field of view of ISAAC, the predicted
number of background galaxies is
)
eliminated most of them.
In the smaller field of view of ISAAC, the predicted
number of background galaxies is ![]() 330 in the interval of
magnitudes
330 in the interval of
magnitudes
![]() and
and ![]() 180 between
180 between
![]() (Saracco et al. 2001).
Most of the background galaxies are resolved and rejected by sharp and
magnitude uncertainty parameter requirements on our photometry.
Only few compact galaxies might contaminate the sample.
(Saracco et al. 2001).
Most of the background galaxies are resolved and rejected by sharp and
magnitude uncertainty parameter requirements on our photometry.
Only few compact galaxies might contaminate the sample.
Several recent studies of resolved stellar populations in NGC 5128 exist in the literature, all but one made with HST in F606W (V) and F814W (I) or F110W (J) and F160W (H) photometric bands, which are not very sensitive to the recent star formation. Our Field 2 is centered on the field of Soria et al. (1996), which was also observed in the near-IR (F110W and F160W filters) by Marleau et al. (2000), but the direct comparison is not possible due to different photometric bands used.
The only possible direct comparison is for our Field 1 photometry, which
partially overlaps with the HST
photometry of Mould et al. (2000) and the ground based photometry of
Fasset & Graham (2000). The last authors observed a wider field than
ours in U, B and V Glass filters, but due to smaller telescope aperture
(2.5 m), their photometry is much shallower. The HST photometry is
deeper, but covers a much smaller area. The mean difference between
V magnitudes of Fasset & Graham and Mould et al. photometry is
![]() mag, in the sense of HST photometry having a systematically fainter
zero point (Fasset & Graham 2000). Comparison of 26 stars in common
between our data and that of Fasset & Graham for the brightest blue stars
(their Table 3) is presented in Fig. 8.
mag, in the sense of HST photometry having a systematically fainter
zero point (Fasset & Graham 2000). Comparison of 26 stars in common
between our data and that of Fasset & Graham for the brightest blue stars
(their Table 3) is presented in Fig. 8.
![\begin{figure}
\par\includegraphics[width=8.4cm,angle=0,clip]{MS1535f8.eps} \end{figure}](/articles/aa/full/2001/45/aa1535/img59.gif) |
Figure 8: Comparison of our photometry with that of Fasset & Graham (2000) for 26 bright blue stars in common. In the upper panned the comparison of V band magnitudes is presented and in the lower panel U-band magnitudes are compared. The two extended objects (#4 and #5 in Table 2) noted by Rejkuba (2001) are plotted with filled symbols. The mean offset of -0.13 mag in U-band is indicated with the dashed line. |
| # |
|
|
|
|
|
| 1 | 19.94 | +0.23 | -0.54 | 19.987 | 19.498 |
| 4a | 21.07 | +0.12 | -1.26 | 20.871 | 19.711 |
| 5b | 21.19 | +0.04 | -1.26 | 20.925 | 19.717 |
| 7c | 21.51 | -0.07 | -0.34 | |
20.291 |
| 10 | 21.65 | +0.04 | -1.16 | 20.986 | 20.440 |
| 12 | 21.72 | +0.21 | -0.20 | 21.722 | 21.580 |
| 13 | 21.75 | +0.11 | -0.84 | 21.667 | 20.600 |
| 15 | 21.86 | +0.09 | -0.61 | 21.885 | 21.099 |
| 16 | 21.94 | -0.05 | -0.92 | 21.978 | 20.862 |
| 17 | 21.95 | +0.34 | -0.82 | 21.963 | 21.391 |
| 18d | 22.01 | +0.30 | -0.84 | |
|
| 20 | 22.10 | +0.07 | -0.82 | 22.150 | 21.144 |
| 21 | 22.12 | -0.08 | -1.00 | 22.127 | 20.942 |
| 26 | 22.25 | +0.08 | -0.98 | 22.323 | 21.234 |
| 27 | 22.35 | -0.03 | -0.91 | 22.331 | 21.295 |
| 28 | 22.40 | -0.05 | -0.87 | 22.412 | 21.323 |
| 30 | 22.51 | +0.20 | -0.56 | 22.631 | 22.032 |
| 32 | 22.53 | +0.13 | -0.50 | 22.579 | 22.217 |
| 33 | 22.54 | +0.07 | -0.76 | 22.623 | 21.528 |
| 35 | 22.55 | +0.11 | -0.55 | 22.503 | 21.968 |
| 36 | 22.58 | -0.08 | -0.88 | 22.606 | 21.535 |
| 37 | 22.58 | +0.02 | -1.06 | 22.777 | 21.549 |
| 39 | 22.69 | -0.12 | -0.82 | 22.706 | 21.585 |
| 42 | 22.82 | +0.00 | -1.02 | 22.856 | 21.646 |
| 46 | 22.89 | +0.31 | -0.12 | 22.919 | 23.260 |
| 47 | 22.90 | -0.05 | -1.00 | 22.934 | 21.737 |
| 48 | 22.96 | +0.08 | -0.74 | 23.051 | 22.149 |
| 50 | 22.99 | -0.04 | -0.81 | 23.134 | 22.027 |
a f1.GC-8 (Rejkuba 2001).
b f1.GC-25 (Rejkuba 2001).
c Saturated in FORS1 V image.
d Extended in FORS1 images.
| (4) |
| (5) |
Copyright ESO 2001
![\begin{figure}
\par\includegraphics[angle=270,width=8.6cm,clip]{MS1535f4.eps} \end{figure}](/articles/aa/full/2001/45/aa1535/img43.gif)
![\begin{figure}
\par\includegraphics[angle=270,width=8.6cm,clip]{MS1535f5.eps} \end{figure}](/articles/aa/full/2001/45/aa1535/img44.gif)
![\begin{figure}
\par\includegraphics[angle=0,width=6.4cm,clip]{MS1535f7.eps} \end{figure}](/articles/aa/full/2001/45/aa1535/img57.gif)