 |
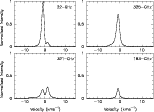
Figure 3: Calculated lineshapes at 22, 321, 325 and 183GHz. Lineshape specific intensity is normalised to the peak value at 22GHz. |
Figure 3 displays the spectra calculated for the stellar H2O masers at 22, 321, 325 and 183GHz. The synthetic lineshapes displayed in Fig. 3 are each composed of the emission from several hundred emitting components. In the case of the 22, 321 and 325GHz masers however, emission from a relatively small number of sites dominates (see Sect. 5). We compare our synthetic lineshapes with the observational data below.
 |
Figure 3: Calculated lineshapes at 22, 321, 325 and 183GHz. Lineshape specific intensity is normalised to the peak value at 22GHz. |
(i) Lineshapes observed for stars of low ![]() ,
such as M-Miras,
tend to display a single dominant peak which occurs at the
stellar velocity, to within a few kms-1. The velocity extent
of emission is typically
,
such as M-Miras,
tend to display a single dominant peak which occurs at the
stellar velocity, to within a few kms-1. The velocity extent
of emission is typically ![]() 10 kms-1. The 183GHz maser
generally displays the broadest lineshape, and that at
321GHz the narrowest.
10 kms-1. The 183GHz maser
generally displays the broadest lineshape, and that at
321GHz the narrowest.
(ii) The peak intensities of the 22 and 325GHz lineshapes
are generally comparable. The 321GHz lineshape tends
to be weaker by a factor of 2-5 (Yates et al. 1995). In
general, the 183GHz lineshape is also weaker, by a factor
of up to ![]() 12 for the Miras in González-Alfonso et al. (1998).
12 for the Miras in González-Alfonso et al. (1998).
(iii) Some spectral features occur at similar velocities for all the maser transitions, suggesting that maser emission at different frequencies may originate from common regions of the CE. In particular, the 22 and 325GHz maser line profiles often bear a strong resemblance (Yates et al. 1995).
(iv) Timescales for the variability of maser lineshapes vary between transitions. Change in peak intensity by a factor of 2 occurs most rapidly in 321GHz masers (21 days), followed by 22 and 325GHz masers (50 days) (Yates et al. 1996). The least variable are the 183GHz profiles, which do not appear to alter significantly in intensity over time (González-Alfonso et al. 1998).
(i) Synthetic line profiles also peak near the stellar velocity,
to within ![]() 2 kms-1. Velocity extents are within the range
observed, although the broadest line profile is not that
of the 183GHz maser, as is typically observed.
2 kms-1. Velocity extents are within the range
observed, although the broadest line profile is not that
of the 183GHz maser, as is typically observed.
(ii) The synthetic 22GHz and 325GHz line profiles are of
comparable peak intensity, with the 321 and 183GHz
lineshapes less intense by a factor of ![]() 4. These values are
consistent with the observations of Yates et al. (1995)
and González-Alfonso et al. (1998).
4. These values are
consistent with the observations of Yates et al. (1995)
and González-Alfonso et al. (1998).
(iii) The 22, 325 and 183GHz lineshapes are of the same
general form, with a single dominant feature peaking 1-2 kms-1 to the blue of V*. In common with the 22GHz
profile, the 321GHz lineshape displays another peak 1.5 kms-1 to the red of V*. These similarities arise due to the
spatial coincidence of different masers in the model CE.
In particular, the following trends for emitting components
influence the form of the single-dish spectra:
a) The most intense 183GHz maser sites also
produce fairly intense 325GHz emission, but are weak at 22GHz
and weak/non-existent at 321GHz. This leads to the similarity
between the 325GHz and 183GHz line profiles evident in
Fig. 3;
b) It is not unusual for 183 and
325GHz emission to be entirely absent from masing clumps which
are very bright at 321GHz. These components also emit at 22GHz,
and form the feature to the red of V* which is absent in the
325GHz and 183GHz spectra;
(iv) Variability appears to correlate with the number of emitting components contributing to the maser lineshape. The location of the sites in the model CE is also a likely factor, see Sect. 7.
Copyright ESO 2001