The origin of the line-doubling phenomenon in LPVs has been a long-standing problem (see 1 for a review). The most definitive way to prove that the line doubling is not the result of purely radiative processes but is actually caused by the differential bulk motions in the atmosphere arising from the propagation of a shock wave is to check whether or not the temporal sequence of the line doubling follows the Schwarzschild scenario.
Schwarzschild (1952) developed his scenario for WVir variables, but in principle it can be generalized to any variable star where a shock wave propagates through the photosphere. According to this scenario, the temporal evolution of the intensity of the components of a double line should obey a precise sequence: the intensity of the blue component, formed in deeper, ascending photospheric layers, should increase from zero to maximum, while at the same time the red component, formed in the upper infalling photospheric layers, decreases from maximum to zero (Fig. 1 of 1).
Thanks to a two-month-long monitoring of two LPVs around maximum light, it was shown in 1 that (at least some) LPVs do follow the Schwarzschild scenario. The present set of observations of many LPVs spread over two years enables us to answer the following questions in relation with the line-doubling phenomenon: (i) at which phases does it occur? (ii) does it repeat identically from one cycle to the next? (iii) what is the fraction of LPV stars exhibiting the line doubling phenomenon and what are their distinctive properties?
Although it was shown in 1 that the line profile of the Mira RTCyg followed the Schwarzschild scenario around maximum light, there was no information available about the evolution of the profile at later phases.
In the present sample, the circumpolar Mira SCep (C7, 4e; P=486.84 d according to the GCVS) has a good phase coverage and allows to draw the velocity curve over a full light cycle (Fig. 3): a typical S-shaped curve emerges that is very similar to the curves obtained from the rotation-vibration CO or CN lines in the near-infrared (Hinkle et al. 1997 and references therein). SCep was already known to exhibit the line-doubling phenomenon for those lines (Hinkle & Barnbaum 1996; Fig. 3).
Figure 4 presents the sequence of CCFs obtained for SCep. Several important features must be noted: (i) as seen in Fig. 3, the velocities of the red and blue components are almost identical from one cycle to the next (although their relative intensities change somewhat: compare the profiles at phases 0.95 and 1.96 on Fig. 4); (ii) the center-of-mass velocity derived from the submm CO lines falls in between the red and blue peaks, as expected (Figs. 3 and 4; see also Sect. 4.2); (iii) the velocities derived from the near infrared CO lines (Hinkle et al. 1997) are very similar to those derived from the optical CCFs.
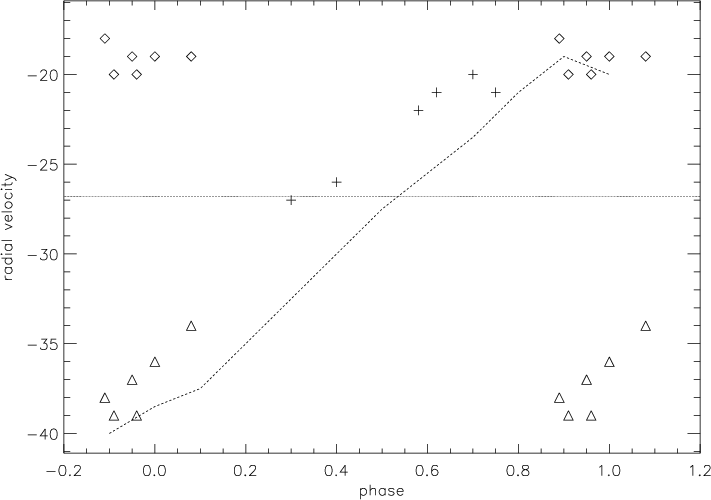 |
Figure 3:
Velocity variations of SCep (cross: single component;
triangles: blue component; diamonds: red component). The dotted line
indicates the center-of-mass velocity (see
Table 4). The velocities between phases 0.8 and 1.1
are shown twice to illustrate the velocity behaviour through
an entire cycle. The dashed line is an eye fit to the
radial-velocity curve of S Cep obtained by Hinkle & Barnbaum (1996)
from CN
|
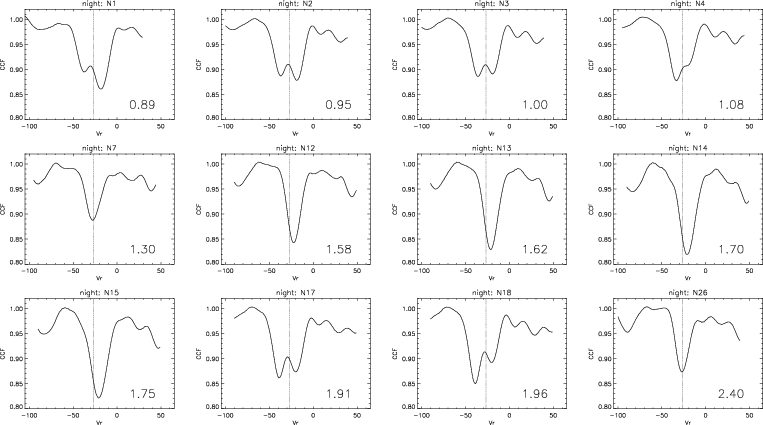 |
Figure 4: Sequence of CCFs for SCep with the default K0III mask. The labels beside each CCF refer to the visual phase computed from the GCVS period and the AAVSO ephemeris. The observing night number is given on top of each panel according to Table 2. The dotted line indicates the center-of-mass velocity (see Table 4). |
The location of the center-of-mass (COM) velocity with respect to the blue and red peaks provides important information about the shock. In the classical Schwarzschild scenario, the COM velocity falls in between the blue and red peaks. It might happen, however, that the shock is not strong enough to oppose the infalling matter. In that case, both peaks would be redshifted with respect to the COM velocity (indicating that the shock is receding in a Eulerian rest frame), as observed for RRLyr stars at some phases (Chadid & Gillet 1996).
This does not occur in SCep, as seen in Figs. 3 and 4 (see also Hinkle & Barnbaum 1996) where the dotted line corresponds to the COM velocity derived by Neri et al. (1998) from sub-mm observations. And seemingly, receding shocks are not observed in Miras at all. Table 4 lists the COM velocity (when available) for LPVs which exhibit a double-peak CCF. The first column gives the star name, the second column the velocities of the blue and red components (extreme value observed), the third column the median of the blue- and red-peak velocities, the fourth column the COM velocity derived from sub-mm observations and the last column the reference for this COM velocity. The COM velocity does always fall in between the blue and red peaks (the median of the red- and blue-peak velocities is in fact blueshifted with respect to the COM velocity, as expected if the shock front is moving outwards), in agreement with the conclusion already reached by Hinkle et al. (1997) from infrared CO lines. It is thus possible to conclude that, unlike in other classes of variable stars such as RRLyrae, shock waves are rather strong in Mira stars.
| GCVS | CCF | median | Center-of-mass | Ref. |
| radial velocities | red/blue | velocity | ||
| (km s-1) | (km s-1) | (km s-1) | ||
| R And | -38/-10 | -24 | -20.3 | 2 |
| R Cet | +22/+48 | +35 | +42.1 | 1 |
| U Ari | -65/-43 | -54 | -46.5 | 1 |
| R Gem | -57/-39 | -48 | -47.6 | 2 |
| S CMi | +50/+72 | +61 | +65.9 | 2 |
| W Aql | -54/-27 | -40.5 | -39.2 | 2 |
| Z Cyg | -179/-160 | -169.5 | -165.8 | 1 |
| AX Cep | -10/+8 | -1 | +0.4 | 1 |
| S Cep | -39/-18 | -28.5 | -26.8 | 3 |
|
References:
1: Groenewegen et al. (1999). 2: Knapp et al. (1998). 3: Neri et al. (1998). |
Not all LPVs exhibit the line doubling (at least when considering only
those CCFs classified as "2p'' or "ap'' as described in
Sect. 3, thus excluding CCFs of the "2p?'' and "np''
kinds; see Fig. 1),
even when observed at maximum light
(see the example of XOph in 1): about 47% of the sample stars observed
at maximum light (between phases -0.10 and 0.10) did not exhibit line
doubling with the K0-template (see Fig. 2).
In an attempt to identify the key stellar parameter(s) governing the
appearance of the line doubling, the distribution of several potentially
relevant parameters is displayed in Fig. 5
(
![]() against the brightness range),
Fig. 6 (period distribution) and
Fig. 7 (distribution of spectral type at maximum
light for oxygen-rich LPVs).
against the brightness range),
Fig. 6 (period distribution) and
Fig. 7 (distribution of spectral type at maximum
light for oxygen-rich LPVs).
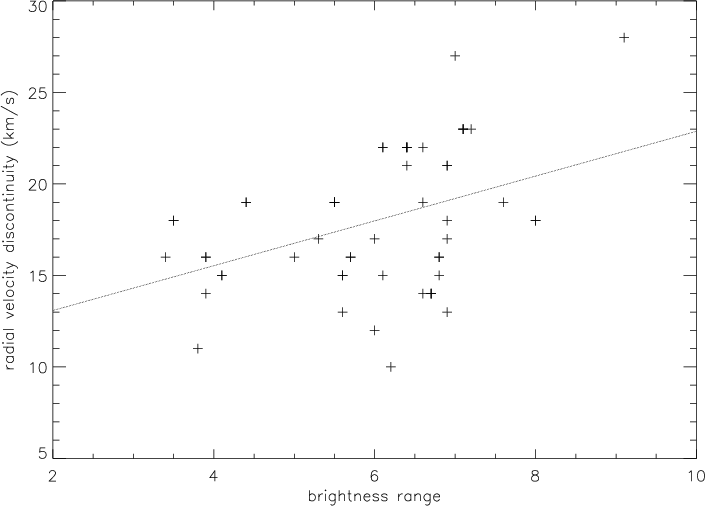
There is a weak correlation between the brightness range and the velocity discontinuity (Fig. 5), but the scatter in the relation is very large, albeit similar to that obtained by Hinkle et al. (1997; their Fig. 11) when considering only Miras. The important result from Fig. 5 is that there is no visual-amplitude threshold beyond which line doubling only would occur: instead, small-amplitude as well as large-amplitude Miras are liable to exhibit the line-doubling phenomenon.
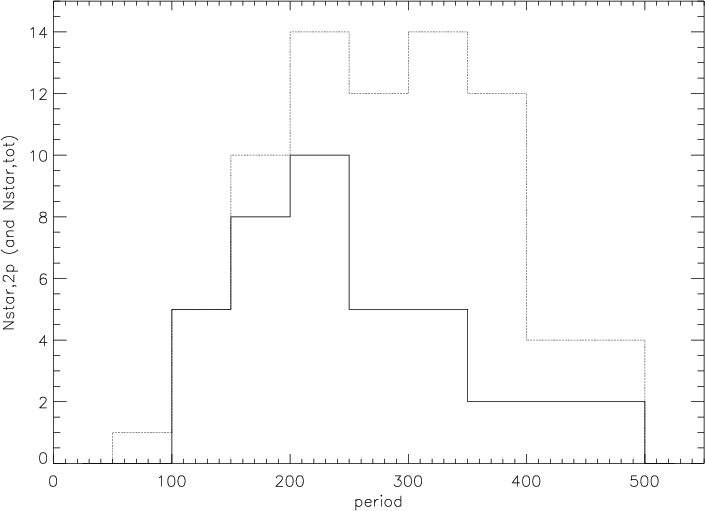
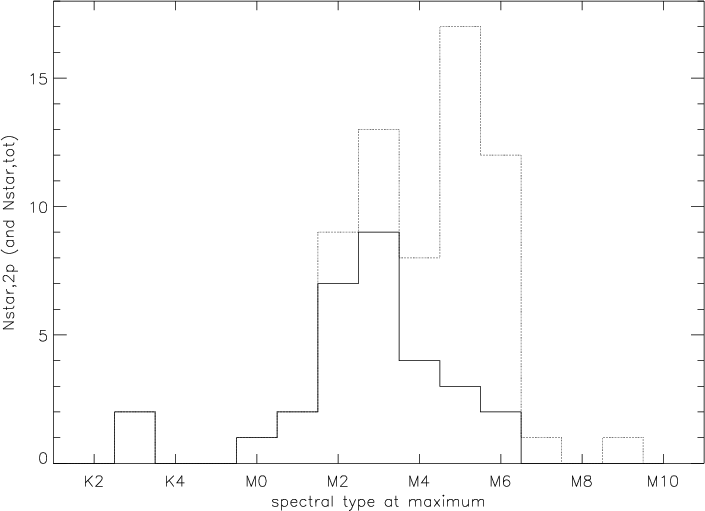
The same conclusion is reached when considering the period (Fig. 6) or spectral type (Fig. 7) distributions: double-peak profiles are found among short- as well as long-period LPVs and among early- as well as late-type LPVs. The frequency of double-peak profiles is nevertheless somewhat larger among short-period and early-type LPVs (almost all LPVs with a period less than 250 d and almost all oxygen-rich LPVs with a spectral type earlier than M3 showed line-doubling), suggesting that the line-doubling is restricted to LPVs of small radius (Sect. 4.3.2).
Since the period is correlated with the luminosity and the spectral type
with the effective temperature, and since these two parameters suffice
to define a stellar radius, we investigate the relationship between
the line-doubling phenomenon and the quantity
![]() .
Although this quantity is certainly related to the stellar radius, it
should not be taken at face value since the definition of a stellar radius
for LPVs is a complex task
(e.g. Perrin et al. 1999; Hofmann et al. 2000).
The quantity
.
Although this quantity is certainly related to the stellar radius, it
should not be taken at face value since the definition of a stellar radius
for LPVs is a complex task
(e.g. Perrin et al. 1999; Hofmann et al. 2000).
The quantity ![]() should somehow reflect the stellar size, at
least in a relative sense when comparing one star to another.
should somehow reflect the stellar size, at
least in a relative sense when comparing one star to another.
Luminosities were estimated from the
![]() -P relation of Feast et al. (1989), with no zero-point
correction.
-P relation of Feast et al. (1989), with no zero-point
correction.
Effective temperatures of LPVs are also difficult to derive. Apart from a scarce number of direct determinations from interferometric observations, little is known about the temperature scale of Mira and semi-regular variables. Colour-temperature relations may in principle be used (e.g. Bessell et al. 1998; Alvarez et al. 2000b; Houdashelt et al. 2000), but in practice it is difficult to collect the required set of simultaneous photometric observations for a large sample of LPVs.
In order to estimate
![]() for a number of sample stars as large as possible,
the choice was made to rely on a spectral type-temperature relation,
taking advantage of the fact that almost all LPVs have been given a spectral
type, at least at maximum light. The spectral type/temperature scale of
Perrin et al. (1998) was used for this purpose, with the spectral types at
maximum light taken from the GCVS.
As spectral-type assignments generally carry some degree of subjectivity, so
will the
for a number of sample stars as large as possible,
the choice was made to rely on a spectral type-temperature relation,
taking advantage of the fact that almost all LPVs have been given a spectral
type, at least at maximum light. The spectral type/temperature scale of
Perrin et al. (1998) was used for this purpose, with the spectral types at
maximum light taken from the GCVS.
As spectral-type assignments generally carry some degree of subjectivity, so
will the
![]() values derived from the present procedure.
Their accuracy will be sufficient for the present purpose of identifying a
possible relationship between
values derived from the present procedure.
Their accuracy will be sufficient for the present purpose of identifying a
possible relationship between ![]() and the line-doubling phenomenon.
The derived
and the line-doubling phenomenon.
The derived ![]() values are listed in Table 3.
values are listed in Table 3.
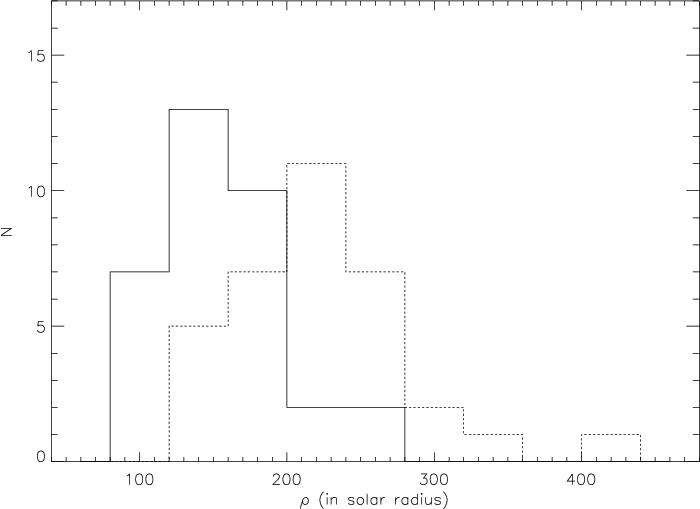
Figure 8 shows the ![]() distribution for two sub-samples:
(i) the stars for which a double or asymmetrical peak was obtained
with the K0-template (solid line);
(ii) the stars for which a double or asymmetrical peak was not
obtained, even when observed at maximum light (dashed line).
Semi-regular variables (as they do not follow the period-luminosity
relation) and carbon stars (as they do not obey the oxygen-rich spectral
type/temperature relation) are excluded from Fig. 8.
Stars with a double peak are clearly separated from single-peak stars.
A large majority of small-size stars (
distribution for two sub-samples:
(i) the stars for which a double or asymmetrical peak was obtained
with the K0-template (solid line);
(ii) the stars for which a double or asymmetrical peak was not
obtained, even when observed at maximum light (dashed line).
Semi-regular variables (as they do not follow the period-luminosity
relation) and carbon stars (as they do not obey the oxygen-rich spectral
type/temperature relation) are excluded from Fig. 8.
Stars with a double peak are clearly separated from single-peak stars.
A large majority of small-size stars (
![]() )
present a double
peak, whereas large-size stars (
)
present a double
peak, whereas large-size stars (
![]() )
are almost all
single-peak stars. Such a segregation is quite remarkable given the various
sources of uncertainty on
)
are almost all
single-peak stars. Such a segregation is quite remarkable given the various
sources of uncertainty on ![]() .
It accounts for the results of 1,
namely the occurrence of line-doubling in RTCyg (
.
It accounts for the results of 1,
namely the occurrence of line-doubling in RTCyg (
![]() )
but not in XOph (
)
but not in XOph (
![]() ).
).
The predictive power of Fig. 8 is of interest in relation with abundance analyses of LPVs in external systems, where the available spectral resolution may not be high enough to reveal the line doubling. This may introduce large errors on the abundances, and Fig. 8 reveals that such a risk is highest for warm and short-period LPVs.
Figure 8, which shows that the line-doubling phenomenon
is only present in the most compact Mira stars, is one of the
most striking result of this paper.
At this stage, two interpretations of this result are still possible:
(i) it is an artefact of the use of the K0III template which is not
able to reveal the double peaks in the
LPVs with large ![]() which have very late and crowded spectra;
which have very late and crowded spectra;
(ii) the observed segregation in terms of ![]() is real and related
to the physics of the shocks in LPVs.
is real and related
to the physics of the shocks in LPVs.
These two possibilities are discussed in turn in the remainder of this
section.
Since the K0III
template better matches the spectra of early-type LPVs than of
late-type LPVs,
it may possibly be more efficient
in detecting line-doubling in early-type LPVs, thus possibly causing a bias
against the detection of line doubling in large-![]() LPVs.
The interpretation of Fig. 8 simply in terms of such
a selection bias caused by the use of too warm a template appears
however too simplistic, as we now discuss.
LPVs.
The interpretation of Fig. 8 simply in terms of such
a selection bias caused by the use of too warm a template appears
however too simplistic, as we now discuss.
Since the cooler M4V template![]() constitutes a better match to the crowded
spectra of late-type LPVs, one might have
expected a better efficiency of detection of line doubling with that template.
We already
showed in Sect. 3 that even less
double-peaked
CCFs are found with the M4V template than with the
K0III one. Figure 9 shows that the segregation of
single/double peaks in terms of
constitutes a better match to the crowded
spectra of late-type LPVs, one might have
expected a better efficiency of detection of line doubling with that template.
We already
showed in Sect. 3 that even less
double-peaked
CCFs are found with the M4V template than with the
K0III one. Figure 9 shows that the segregation of
single/double peaks in terms of ![]() remains basically the same with
the M4V template as with the K0III template.
remains basically the same with
the M4V template as with the K0III template.
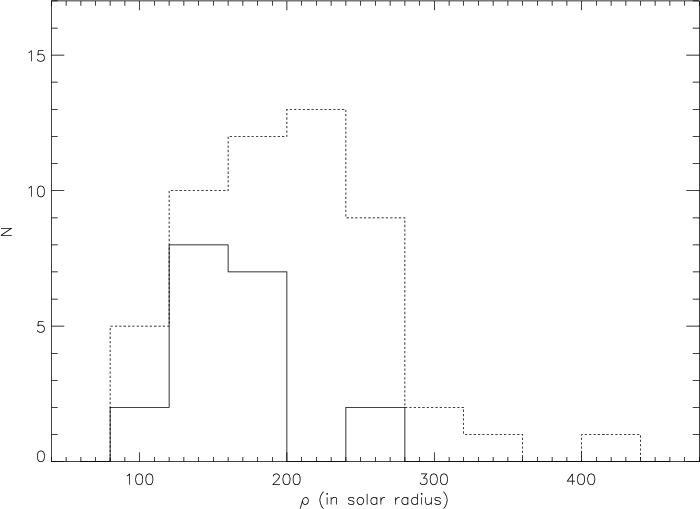 |
Figure 9: Same as Fig. 8 for the M4-template. |
Nevertheless, by considering infrared CO
![]() lines around
1.6
lines around
1.6 ![]() m, Hinkle et al. (1984, 1997) reported line doubling around
maximum light for several
late-type
LPVs
with large
m, Hinkle et al. (1984, 1997) reported line doubling around
maximum light for several
late-type
LPVs
with large ![]() (Table 5) that were flagged as 1p or 1p? with the K0III
and M4V templates.
Thus line doubling is definitely present at least in
some of those stars as well.
(Table 5) that were flagged as 1p or 1p? with the K0III
and M4V templates.
Thus line doubling is definitely present at least in
some of those stars as well.
Quite interestingly, Hinkle et al. (1984)
note that in these late-type LPVs line doubling is more easily seen
in the deep photospheric layers probed by the
infrared CO
![]() lines around
1.6
lines around
1.6 ![]() m than in the higher layers where the blue-violet absorption
lines form. In an attempt to uncover double-peak CCFs in late-type
LPVs as well, their spectra were correlated with various masks
(constructed with the procedure of Baranne et al. 1979)
mimicking F0V, G2V (solar), K4III (81 Gem) and M4III
(HD 123657) spectra.
m than in the higher layers where the blue-violet absorption
lines form. In an attempt to uncover double-peak CCFs in late-type
LPVs as well, their spectra were correlated with various masks
(constructed with the procedure of Baranne et al. 1979)
mimicking F0V, G2V (solar), K4III (81 Gem) and M4III
(HD 123657) spectra.
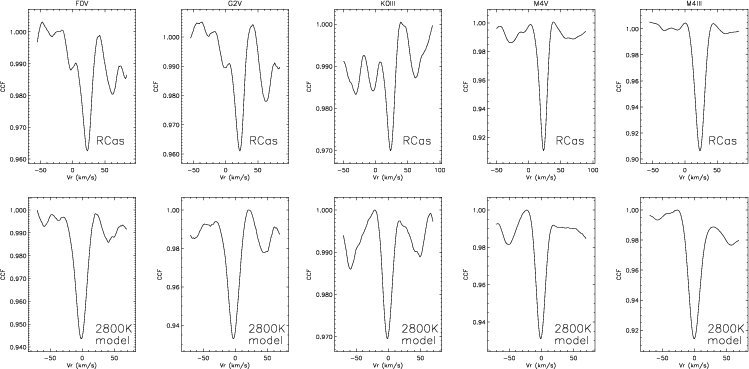
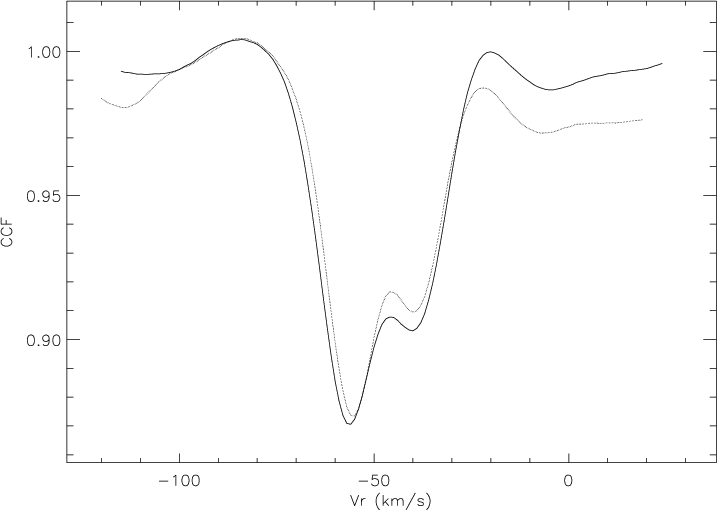
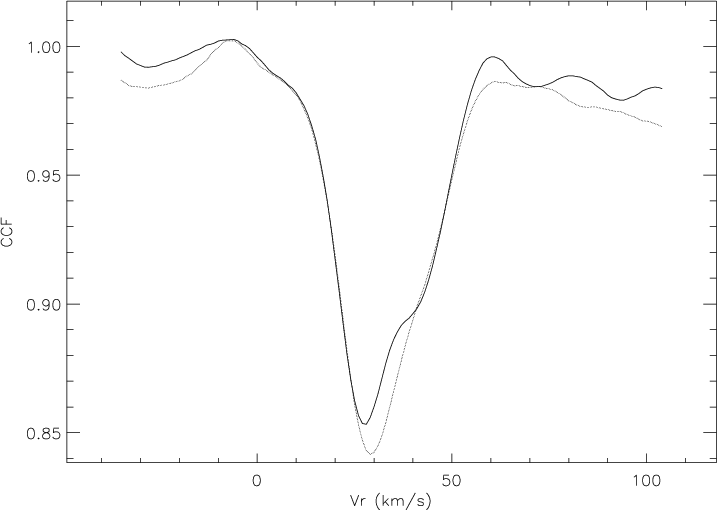
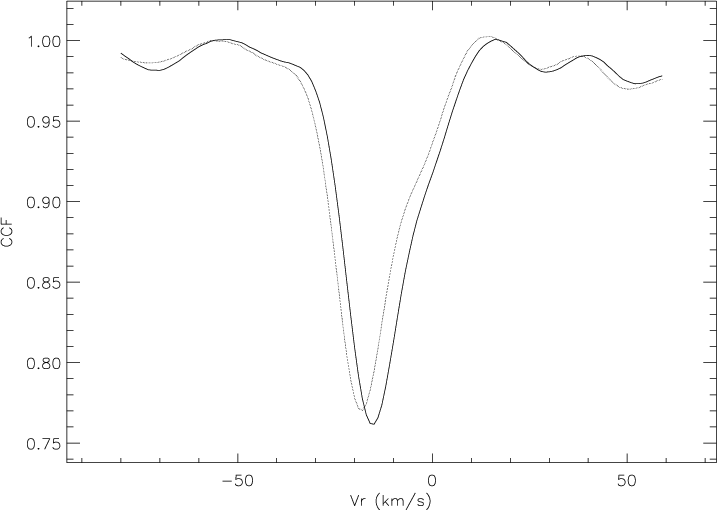
While the cool masks (M4V and M4III) yield very clean, albeit single, CCFs, interesting results are indeed obtained with the warm F0V and G2V masks, which are expected to probe deeper layers. They reveal asymmetric, or even double-peak, CCFs (Table 5 and Fig. 10), with velocities similar to those obtained by Hinkle et al. (1984). There is however a drawback to the application of warm templates to cool LPVs. Since the warm templates contain far fewer lines than the spectrum of cool LPVs, many spurious secondary peaks must be expected in their CCFs. These peaks correspond to the chance coincidence occurring between the mask and the forest of lines flanking the lines actually probed by the mask. This situation is well illustrated by Fig. 10 which compares the CCFs obtained with different masks applied on the late-type LPV R Cas and on the synthetic spectrum of a static 2800 K model. The latter CCFs make it possible to identify the spurious secondary peaks caused by the correlation noise invoked above. By comparison, the CCFs of R Cas obtained with the warm templates exhibit the same spurious peaks as the 2800 K model, except that a supplementary blue component appears around 0 km s-1 (see also Table 5). This component not observed in the CCF of a static spectrum may thus tentatively be related to the dynamics of the envelope of R Cas.
| CO
|
CCF | K0III | M4V | F0V | ||||||||
| Spect. type | Phase | Phase | night | |||||||||
| R And | S3,5e - S8,8e | 217 | 0.96 | -29.3/-5.7 | 0.98 | N26 | 2p | -38.3/-10.2 | 1p | -9.5 | 2p | -38.1/-9.8 |
| R Cas | M6e - M10e | 282 | 0.03 | +5.9/+28.5 | 1.02 | N13 | 1p? | - | 1p | +22.7 | 2p? | 0/+21.7 |
| T Cep | M5.5e - M8.8e | 238 | 0.87 | -19.2/-2.4 | 1.91 | N23 | np | - | 1p | -14.9 | 1pa | -19.5/-10.3 |
| o Cet | M5e - M9e | 150 | 0.96 | +44.7/+67.8 | 1.91 | N15 | 1p? | - | 1p | +61.7 | 2p? | +38.4/+57.9 |
Many of the LPVs with large ![]() that were originally classified as
1p or 1p? from their K0III CCF actually behave like R Cas as shown in
Fig. 10.
that were originally classified as
1p or 1p? from their K0III CCF actually behave like R Cas as shown in
Fig. 10.
In conclusion, double-peaked
CCFs may actually be present in LPVs with large ![]() as well.
We nevertheless stress that this conclusion must be subject to
caution, since these double-peak CCFs - if real -
are quite difficult to detect because of the crowded
nature of their parent spectra.
In Sect. 4.3.2.2, we discuss the possibility that this
difficult detection may also be caused partly by the
secondary peaks being truly weaker in stars
with large
as well.
We nevertheless stress that this conclusion must be subject to
caution, since these double-peak CCFs - if real -
are quite difficult to detect because of the crowded
nature of their parent spectra.
In Sect. 4.3.2.2, we discuss the possibility that this
difficult detection may also be caused partly by the
secondary peaks being truly weaker in stars
with large ![]() due to weaker shocks.
due to weaker shocks.
The behaviour of the H![]() emission line in our sample of
LPVs provides important clues to help us interpret, in terms of the properties
of the shocks in LPVs, the result that the
line-doubling phenomenon
is conspicuous only in the most compact LPVs.
emission line in our sample of
LPVs provides important clues to help us interpret, in terms of the properties
of the shocks in LPVs, the result that the
line-doubling phenomenon
is conspicuous only in the most compact LPVs.
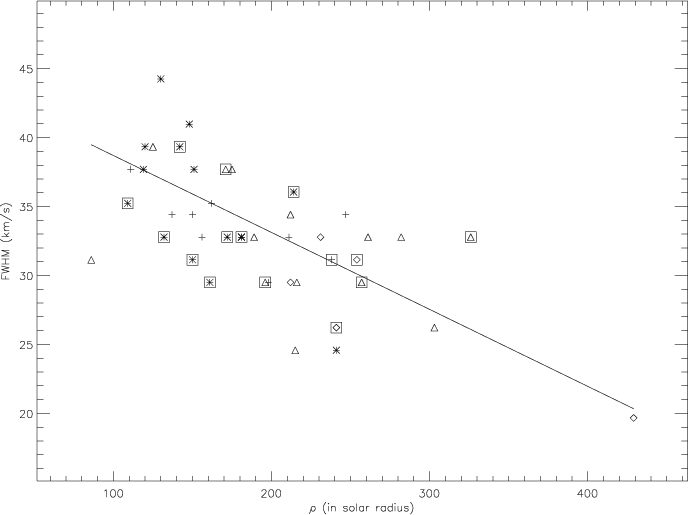 |
Figure 11:
Full width at half maximum of the H |
The first important result regarding H![]() is that it appears in emission around maximum light
for all LPVs in our sample
(see Fig. 11 discussed
below). Since H
is that it appears in emission around maximum light
for all LPVs in our sample
(see Fig. 11 discussed
below). Since H![]() is considered as a good signature of the
presence of shocks in those atmospheres,
the above result thus suggests that double-peak CCFs, being another signature
of shocks, should be observed as well in all
LPVs.
We argue in the present section that the behaviour of H
is considered as a good signature of the
presence of shocks in those atmospheres,
the above result thus suggests that double-peak CCFs, being another signature
of shocks, should be observed as well in all
LPVs.
We argue in the present section that the behaviour of H![]() and the statistics of double-peak CCFs in LPVs may be reconciled
by realizing that
the shock strength
becomes smaller in stars of larger
and the statistics of double-peak CCFs in LPVs may be reconciled
by realizing that
the shock strength
becomes smaller in stars of larger ![]() .
Figure 11 presents the full width at
half maximum (FWHM) of the H
.
Figure 11 presents the full width at
half maximum (FWHM) of the H![]() emission line vs. the stellar size
emission line vs. the stellar size
![]() .
We observe a trend of decreasing H
.
We observe a trend of decreasing H![]() FWHMs
with increasing stellar sizes
FWHMs
with increasing stellar sizes ![]() .
Among the Balmer lines, H
.
Among the Balmer lines, H![]() is the best
indicator of the energy transferred by the shock to the gas,
since H
is the best
indicator of the energy transferred by the shock to the gas,
since H![]() suffers the least from
mutilations induced by molecular absorptions
(the TiO line absorption and H2 scattering
coefficients are indeed minimum around H
suffers the least from
mutilations induced by molecular absorptions
(the TiO line absorption and H2 scattering
coefficients are indeed minimum around H![]() ;
Gillet 1988b).
Its width measures the temperature in the post-shock gas
where the Balmer
emission lines form. The heating in the shock wake must in turn be
related to the energy carried by the shock.
;
Gillet 1988b).
Its width measures the temperature in the post-shock gas
where the Balmer
emission lines form. The heating in the shock wake must in turn be
related to the energy carried by the shock.
Similarly, the difficulty of detecting double-peaked CCFs
in stars with large ![]() might also somehow relate to
the weakness of the shocks in those stars (as inferred from their
smaller H
might also somehow relate to
the weakness of the shocks in those stars (as inferred from their
smaller H![]() FWHMs), although a definite proof
of this statement would require solving of the equation of radiative
transfer in dynamical atmospheres, with detailed shock models.
FWHMs), although a definite proof
of this statement would require solving of the equation of radiative
transfer in dynamical atmospheres, with detailed shock models.
Self-consistent dynamical models of LPV atmospheres are clearly necessary to confirm that the strongest shocks only occur in the more compact Mira stars. In any case, the relation of the shock strength with the stellar size empirically revealed by Fig. 11 will have to be accounted for by future dynamical models of LPV atmospheres.
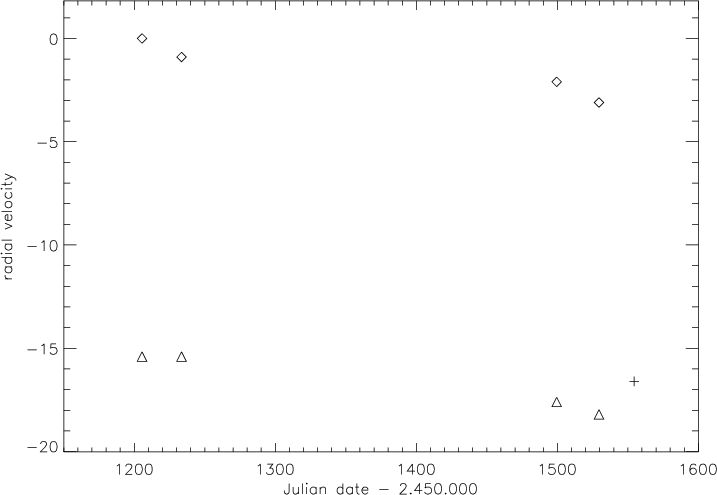 |
Figure 15: Radial-velocity curve of SCam with the default K0III mask. Symbols are as in the last panel of Fig. 3. Notice the long-term trend, unlike the situation observed for SCep in Fig. 3. |
Observations spread over several cycles are available for some stars and allow us to address the questions of (i) the repeatability of the line doubling from one cycle to the other (as far as the relative peak intensities and velocities are concerned), and (ii) the frequency of spectroscopic binaries among LPVs. In Figs. 12 and 13 are presented the CCFs obtained for RGem and STAnd respectively, at maximum light for two consecutive pulsational cycles. The CCF profile is remarkably similar from one cycle to the other, with the same velocities to within 1 km s-1 for the blue and red peaks. This result, based on only two stars, may not necessarily be extrapolated to all LPVs.
By contrast, the situation observed in SCam (Fig. 14) is quite interesting: although the CCF shape is almost identical for similar phases of two consecutive cycles, it is shifted by about 3 km s-1. Figure 15 shows the radial-velocity curve of SCam: the common velocity shift for the blue and red peaks from one cycle to the next is quite clear, and flags this star as a suspected binary. The example of S Cam only serves to illustrate the method, since to confirm the binary nature of S Cam would still require us to prove that the phases compared in Fig. 14 are really identical, i.e. that the period is constant (this is not necessarily the case for a SRa variable like S Cam) and that the observed radial-velocity shift is larger than the typical cycle-to-cycle scatter.
Little is known about the binary frequency among LPVs (see Jorissen 2001 for a
recent review). As pointed out in
Sect. 4.1 and Fig. 3, the
radial-velocity variations induced by the LPV pulsation are large
(
![]() km s-1 over
km s-1 over ![]() 1 y) as compared to the
variations expected for the orbital motion of a large giant in a relatively
wide binary system (
1 y) as compared to the
variations expected for the orbital motion of a large giant in a relatively
wide binary system (
![]() 5 km s-1 over several years).
5 km s-1 over several years).
However, the example of SCam provides a hint on how binary systems may be found among LPVs exhibiting a double-peak CCF: a similar velocity shift observed for both the red and blue components from one cycle to the other may be indicative of a binary motion. Such a strategy is unfortunately quite time-consuming as only double-peak CCFs obtained around the same pulsational phase in successive cycles may be used, and is obviously not applicable to those LPVs exhibiting only a single-peak CCF.
In our sample of 81 LPVs, 43 showed a double-peak CCF at least once with
the K0-template (Table 3), but only 9 could be observed at about the same phase
(within 0.1) in consecutive cycles and exhibited double-peak CCFs (namely
YAnd, VTau, SCam, RGem, YVir, ZOph, RTCyg, SCep and
STAnd).
In this sample, the average absolute velocity shift between similar phases in
consecutive cycles amounts to
![]() (rms) km s-1
and
(rms) km s-1
and
![]() (rms) km s-1 when removing the suspected binaries SCam
(having
(rms) km s-1 when removing the suspected binaries SCam
(having
![]() and 2.8 km s-1,
and
and 2.8 km s-1,
and
![]() and 2.2 km s-1) and, somewhat
less likely, Y Vir (having
and 2.2 km s-1) and, somewhat
less likely, Y Vir (having
![]() km s-1,
and
km s-1,
and
![]() km s-1).
No other star in the above list shows a significant signature of binary motion.
km s-1).
No other star in the above list shows a significant signature of binary motion.
For the stars not suspected of being binaries, the red- and blue-peak
shifts from one cycle to the next may sometimes be quite different, since the
average
![]() ,
instead of being close
to 0, amounts to
,
instead of being close
to 0, amounts to
![]() (rms) km s-1.
(rms) km s-1.
Copyright ESO 2001