

Up: A multi-wavelength study of
From Table 1, it is evident that the SUMER ECH
observations cover most of the
electron temperature range from the upper chromosphere through the
transition region with minimal gaps. If the ECH radio
enhancements are due to a difference in
the electron temperature height profile in the 10000 K to 630000 K range
between the QS and portions
of the ECH we would expect to see enhancements in some of the UV lines
measured. In fact, there are no corresponding differences in
UV line intensity in
any of the ECH radio enhancement sub-regions observed from October 19-28, 1999
beyond the normal
network UV brightening (Wilhelm et al. 2001), however, as mentioned above relative
maxima were observed.
Increases in line width were measured in all of
the chromospheric and transition region lines observed in the ECH
network, consistent with previous
observations (Lemaire et al. 1999). These increases are probably
due to line-of-sight spicular motions
and not directly related to the electron temperature, which determines
radio brightness. Outflow velocities of 5 to 10 km s-1were detected for lines
formed above 100000 K. The investigation demonstrated that
ECHs were very similar to PCHs in all measurable aspects.
We may estimate the effect of temperature increases on the UV
spectral lines observed with SUMER. The computation depends upon the
line optical depth.
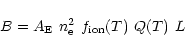
For lines from optically thin regions,
the brightness B is computed by
integrating the
local emissivity E along the line of sight:
 |
(1) |
where the integral is performed over the path L, which spans the
radiating plasma.
The local emissivity is given by:
 |
(2) |
where  is the electron density,
  is the species density
and Q is the
excitation coefficient, computed by integrating the electron collisional
excitation cross-section over the Maxwellian electron energy distribution, and
therefore a function of electron temperature.
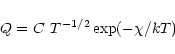
The species density is given by:
is the species density
and Q is the
excitation coefficient, computed by integrating the electron collisional
excitation cross-section over the Maxwellian electron energy distribution, and
therefore a function of electron temperature.
The species density is given by:
 ,
where
,
where  is the elemental abundance fraction and
 is the
ionization state fraction, also a function of electron temperature.
is the
ionization state fraction, also a function of electron temperature.
If ,
Q,
are taken to be the mean quantities
along the effective path length rather than local quantities, the
brightness is given by:
 |
(3) |
where the temperature dependence of
and Q is explicitly
noted.
The ionization fraction may be calculated by simultaneously solving
a set of rate equations for the population of each ionization
state. These calculations are involved and detailed results are not
readily available. However, for the purpose of this study, we assume that
all ions are at temperatures which are near the peak of their
abundance versus temperature curves, and therefore the ionization
fractions are not sensitive to the small temperature changes being
considered here. While this might not hold for all the lines observed,
this assumption allows an upper limit to be determined for any
possible temperature increase. In the fixed abundance case,
the temperature dependence
of the line brightness is determined only by the excitation coefficient, Q.
The temperature dependence of Q determines the ratio
between the fractional changes in line brightness and electron temperature
under the assumption of all other quantities remaining constant. This factor,
denoted by
 ,
satisfies the relation:
,
satisfies the relation:
 |
(4) |
From Eqs. (3) and (4),
 |
(5) |
For a Maxwellian electron energy distribution and allowed dipole transitions,
Q is given by (McWhirter 1965):
 |
(6) |
where C is a constant dependent on atomic physics,
k is Boltzmann's constant
and  is the
difference between upper state and
lower state energies in the collisional excitation.
The ratio
of the fractional change in brightness to the fractional change
in electron temperature is
given by:
is the
difference between upper state and
lower state energies in the collisional excitation.
The ratio
of the fractional change in brightness to the fractional change
in electron temperature is
given by:
 |
(7) |
All of the lines observed except for the hydrogen Lyman lines are assumed to
be from optically thin regions.
The ratios, ,
for these
lines were computed and are listed in Table 1.
The range of
is from -0.02 to 14.0,
with the lowest values of -0.02 and
-0.2 for lines formed at the highest temperatures,
288000 K and 630000 K. For
lines formed at temperatures between 10000 K and 230000 K,
we find
 ,
and therefore
those lines are sensitive to changes in temperature. If the radio
enhancement was caused by an increase in electron temperature of
at least 15 to 20% at the
formation height of the lines measured, there would be corresponding increase
of at least 7.5% in line brightness for the least sensitive line and
a factor of 14 increase in brightness for the most sensitive line.
Since any increase in
line brightness with respect to quiet sun levels
is less than 2%, the evidence is not strong for the
optically thin case of higher electron
temperatures in ECH radio enhanced regions. It is possible that the
assumptions of constancy in ,
L, etc. are invalid, but it is
highly unlikely that these other factors would change in such
a way as to keep all of the line brightness constant under a significant
temperature change.
For the nearly optically thick case, such as SUMER lines
H I Ly
,
and therefore
those lines are sensitive to changes in temperature. If the radio
enhancement was caused by an increase in electron temperature of
at least 15 to 20% at the
formation height of the lines measured, there would be corresponding increase
of at least 7.5% in line brightness for the least sensitive line and
a factor of 14 increase in brightness for the most sensitive line.
Since any increase in
line brightness with respect to quiet sun levels
is less than 2%, the evidence is not strong for the
optically thin case of higher electron
temperatures in ECH radio enhanced regions. It is possible that the
assumptions of constancy in ,
L, etc. are invalid, but it is
highly unlikely that these other factors would change in such
a way as to keep all of the line brightness constant under a significant
temperature change.
For the nearly optically thick case, such as SUMER lines
H I Ly and Ly 4, the brightness B is approximated by the Planck distribution:
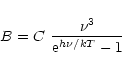 |
(8) |
where C is a constant,
 is the photon frequency and h is Planck's constant.
When the photon energy,
is the photon frequency and h is Planck's constant.
When the photon energy,  ,
is large compared with the thermal
energy, kT, the brightness is very sensitive to temperature changes.
In the case of the Ly
and Ly 4 lines,
,
is large compared with the thermal
energy, kT, the brightness is very sensitive to temperature changes.
In the case of the Ly
and Ly 4 lines,
 ,
and a 1.5% change in temperature would cause
a 15% change in brightness. These are rough estimates, since the conditions
in question are not completely optically thick.
Since no brightness increase was measured in the enhancement region,
there is no evidence for an increased temperature at
the Ly
and Ly 4 formation height, where the temperature is 20000 K.
,
and a 1.5% change in temperature would cause
a 15% change in brightness. These are rough estimates, since the conditions
in question are not completely optically thick.
Since no brightness increase was measured in the enhancement region,
there is no evidence for an increased temperature at
the Ly
and Ly 4 formation height, where the temperature is 20000 K.
Up: A multi-wavelength study of
Copyright ESO 2001