To derive atmospheric parameters (effective temperature, surface gravity,
and photospheric helium abundance) and projected rotational velocities all
Balmer lines
and the He I lines
![]() 4026 Å, 4388 Å, 4438 Å,
4472 Å, 4713 Å, 4922 Å, 5016Å, 5048 Å, 5678 Å,
in the observed spectra were fitted with synthetic line
profiles calculated from model atmospheres.
4026 Å, 4388 Å, 4438 Å,
4472 Å, 4713 Å, 4922 Å, 5016Å, 5048 Å, 5678 Å,
in the observed spectra were fitted with synthetic line
profiles calculated from model atmospheres.
We computed LTE model atmospheres using
the program of Heber et al. (2000), which calculates
plane parallel, chemically
homogeneous and fully line blanketed models, using the
opacity distribution functions for metal
line blanketing by Kurucz (1979, ATLAS6).
From these model atmospheres synthetic spectra were calculated with
Lemke's version![]() of
the LINFOR program (developed originally by Holweger, Steffen, and
Steenbock at Kiel University). The spectra
include the Balmer lines H
of
the LINFOR program (developed originally by Holweger, Steffen, and
Steenbock at Kiel University). The spectra
include the Balmer lines H![]() to H22 and the He I lines listed
above
and the grid covers the range 11000 K
to H22 and the He I lines listed
above
and the grid covers the range 11000 K![]()
![]()
![]() 40000 K,
3.5
40000 K,
3.5 ![]()
![]()
![]() 6.5 and
6.5 and ![]()
![]()
![]() at solar
metallicity.
at solar
metallicity.
The fit procedure is based on a ![]() test using the routines
developed by Bergeron et al. (1992) and Saffer et al.
(1994) and modified by Heber et al. (1997)
to derive also the rotational
velocity.
The theoretical spectra are convolved with the
instrument profiles (Gaussian with the appropriate instrumental FWHM) and a
rotational profile. The fit program then normalizes theoretical and
observed spectra using the same continuum points.
Example fits for a rapidly rotating and a slowly rotating programme star are
shown in Fig. 1 for hydrogen and helium lines, whilst
Fig. 2 compares the metal line spectra
of slowly rotating (PHL 159, BD-15
test using the routines
developed by Bergeron et al. (1992) and Saffer et al.
(1994) and modified by Heber et al. (1997)
to derive also the rotational
velocity.
The theoretical spectra are convolved with the
instrument profiles (Gaussian with the appropriate instrumental FWHM) and a
rotational profile. The fit program then normalizes theoretical and
observed spectra using the same continuum points.
Example fits for a rapidly rotating and a slowly rotating programme star are
shown in Fig. 1 for hydrogen and helium lines, whilst
Fig. 2 compares the metal line spectra
of slowly rotating (PHL 159, BD-15![]() 115) stars
and a rapidly rotating star (PG 1533+467).
115) stars
and a rapidly rotating star (PG 1533+467).
![\begin{figure}
\par\includegraphics[angle=270,width=17.3cm,clip]{ms1632f1.eps}
\end{figure}](/articles/aa/full/2001/42/aa1632/img17.gif) |
Figure 1:
Fit examples for a slowly rotating star (BD-15 |
![\begin{figure}
\includegraphics[angle=270,width=16.6cm,clip]{ms1632f2.eps}
\end{figure}](/articles/aa/full/2001/42/aa1632/img18.gif) |
Figure 2: Wavelength range with strong N II and O II lines to show examples for spectra of slowly rotating (bottom, middle) and rapidly rotating (top) stars. |
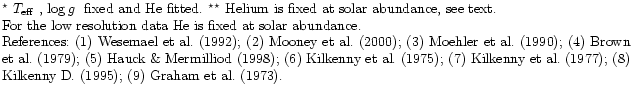
| High Resolution | Low Resolution | Photometry | ||||||
| Name |
|
|
|
|
|
|
E(b-y) | |
| (K) | (km s-1) | (K) | (K) | |||||
| PG 0122+214 | 18300 | 3.86 | -0.98 | 117 | 18700 | 3.90 | 18500 (1) | 0.0 |
| PG 1511+367 | 16100 | 4.15 | -1.16 | 77 | 15600 | 4.20 | 15900 (1) | 0.0 |
| PG 1533+467 | 18500 | 4.09 | -0.94 |
215 | 17700 | 3.93 | 17700 (1) | 0.020 |
| PG 1610+239 | 15500 | 3.72 | -0.84 |
75 | 15400 | 3.69 | 18600 (1) | 0.082 |
| PG 2219+094 | 19500 | 3.58 | -1.00 |
225 | 18200 | 3.52 | 16700 (2) | 0.037 |
| 19500 (3) | 0.081 | |||||||
| PHL 159 | 18500 | 3.59 | -0.84 | 21 | - | - | 20900 (4) | 0.025 |
| PHL 346 | 20700 | 3.58 | -1.00 | 45 | - | - | 22300 (7) | 0.037 |
| SB 357 | 19700 | 3.90 | -1.00 |
180 | - | - | 19700 (5) | 0.052 |
| 19700 (8) | 0.061 | |||||||
| 19800 (9) | 0.037 | |||||||
| BD-15 |
20100 | 3.81 | -0.97 | 35 | - | - | 19800 (5) | 0.0 |
| 20200 (6) | 0.0 | |||||||
| HS 1914+7139 | 17600 | 3.90 | -0.99 | 250 | 18100 | 3.60 | - | - |
For rapidly rotating stars the ![]() minimum
is too poorly defined to allow a reliable determination of the He abundance
simultaneously. Therefore, in a first step the
helium abundance was kept fixed at -1.00 (i.e. solar) for the fit procedure.
In a second iteration step the helium abundance was determind by fitting
the helium lines while keeping the
minimum
is too poorly defined to allow a reliable determination of the He abundance
simultaneously. Therefore, in a first step the
helium abundance was kept fixed at -1.00 (i.e. solar) for the fit procedure.
In a second iteration step the helium abundance was determind by fitting
the helium lines while keeping the
![]() and
and
![]() fixed at those values determined in the first iteration step.
For all stars (except HS 1914+7139) Strømgren photometry
is available, which allowed an independent determination of the effective
temperature. We used the program of
Moon (1985) as modified by Napiwotzki et al. (1993) to derive
the effective temperature and the reddening and
compare the photometric temperatures to the spectroscopic ones in
Table 2. There is a good agreement between results from low
and high resolution spectra and photometry, except for PG 1610+239,
PHL 159 and PHL 346.
The spectrum of SB 357 shows the presence of emission in
fixed at those values determined in the first iteration step.
For all stars (except HS 1914+7139) Strømgren photometry
is available, which allowed an independent determination of the effective
temperature. We used the program of
Moon (1985) as modified by Napiwotzki et al. (1993) to derive
the effective temperature and the reddening and
compare the photometric temperatures to the spectroscopic ones in
Table 2. There is a good agreement between results from low
and high resolution spectra and photometry, except for PG 1610+239,
PHL 159 and PHL 346.
The spectrum of SB 357 shows the presence of emission in
![]() and
and
![]() but not in
but not in
![]() .
Therefore the effective temperature
were obtained from Strømgren photometry and the surface
gravity from fitting the far wings of the hydrogen lines. The helium lines of
this object were difficult to fit, but the observation is compatible with normal
abundance and there is no indication of emission in any of the helium lines observed.
The parameters used for further analyses were taken from the high resolution spectra,
because of the larger wavelength coverage and the excellent quality of the fits.
In the case of PG 1533+467, however, the wavelength coverage of the low resolution
spectrum is larger than that of the high resolution one and
therefore we used the average. The finally adopted parameters are listed
in Table 6.
Results are shown in a (
.
Therefore the effective temperature
were obtained from Strømgren photometry and the surface
gravity from fitting the far wings of the hydrogen lines. The helium lines of
this object were difficult to fit, but the observation is compatible with normal
abundance and there is no indication of emission in any of the helium lines observed.
The parameters used for further analyses were taken from the high resolution spectra,
because of the larger wavelength coverage and the excellent quality of the fits.
In the case of PG 1533+467, however, the wavelength coverage of the low resolution
spectrum is larger than that of the high resolution one and
therefore we used the average. The finally adopted parameters are listed
in Table 6.
Results are shown in a (
![]() ,
,
![]() )
diagram (Fig. 3).
)
diagram (Fig. 3).
Copyright ESO 2001