| (1) | |||
| (2) |
A&A 378, 1100-1106 (2001)
DOI: 10.1051/0004-6361:20011239
O. Fors1,2 - J. Núñez1,2 - A. Richichi3
1 - Departament d'Astronomia i Meteorologia, Universitat de Barcelona,
Av. Diagonal 647, 08028 Barcelona, Spain
2 -
Observatori Fabra, Camí de l'Observatori s/n, 08035 Barcelona, Spain
3 -
European Southern Observatory, Karl-Schwarzschild-Strasse 2, 85748 Garching bei
München, Germany
Received 15 May 2001 / Accepted 16 August 2001
Abstract
A CCD drift-scanning technique for lunar occultation (LO) observations is presented. While this approach has been addressed before by Sturmann (1994) for the case of large telescopes, the technical validity has never been discussed for sub-meter class telescopes. In contrast to Sturmann's scheme, the proposed technique places the CCD in the image plane of the
telescope. This does not represent a problem in the case of small telescopes, where the practical angular resolution attainable by LO is not limited by aperture smoothing. Photon-generated charge is read out at millisecond rates on a column by column basis, as the diffraction pattern of the occulted star is being tracked. Two LO events (SAO 79031 and SAO 77911) were observed to demonstrate the feasibility of the method. Data analysis was carried out, yielding unresolved angular diameters for both objects. We show, however, that the technique could be useful for close binary detections with small telescopes. A discussion of the limiting resolution and magnitude imposed by our instrumentation is carried out, showing that the drift-scanning technique could be extended to 1-2 m telescopes for stellar diameter determination purposes. Finally, we point out that the technical demands required by this technique can be easily met by most
small professional observatories and advanced amateurs.
Key words: instrumentation: detectors - techniques: high angular resolution - occultations - stars: fundamental parameters - stars: binaries: general
Along with eclipses, lunar occultations (hereafter LO) are the oldest astronomical phenomena ever recorded. Since the first high-speed photoelectric observations (Whitford 1939) LO have become one of the highest angular resolution techniques available in visible and infrared astronomy. It provides the opportunity to obtain milliarcsecond resolution, far beyond the seeing and the diffraction limits of even the largest telescopes. Also note that optical LO is one of the few astronomical observations which can be successfully performed from light-polluted areas, since the natural background of the Moon overcomes any other background source. The purpose of observing such events has changed over the centuries: geographical longitude calculation, Earth rotation studies, investigation of close binaries and stellar angular diameters. While timing applications have been largely overcome by atomic clocks and GPS, LO still play of an important role in the direct establishment of fundamental stellar quantities. Tests of stellar atmosphere models via the derived effective temperatures (Richichi et al. 1998) and studies of stellar pulsation and circumstellar shells (Richichi et al. 1988) are just a few examples of them.
In the 1970s, several intensive LO programs were started in the visible (Nather & Evans 1970; Ridgway et al. 1974). Later infrared programs were also initiated (Ridgway 1980; Richichi 1987). The usual detectors for all programs have been high speed photometers, with different photomultiplier technology depending on observing frequency (GaAs for visible and InSb for NIR). For the visible, we call such systems photoelectric photometers (PEP). The PEP technical basis is widely documented in the literature (Henden & Kaitchuck 1990).
CCDs have never been used in a routine way for LO observational programs. During the last two decades, technical specifications of CCDs have constantly been improved. Despite this rapid development, most current-research grade cameras are still not able to meet the read-out speed which LO work demands (1ms sampling time), while operating at low read-out noise (RON) and high digitization resolution mode. The situation in the near-IR domain is different, with panoramic arrays being used for LO observations thanks to the possibility of implementing fast read-out schemes on subarray sections. An example is the MAGIC camera (Herbst et al. 1993) at the Calar Alto observatory (Richichi 1996). Even in this successful case, the achieved sampling interval time is several times slower than achieved by photometers.
Recently, with the advent of adaptative optics (AO), a few expensive state-of-the-art frame transfer imagers have been released for assembly in wavefront sensor systems (Ragazzoni 1998). These devices can operate above 3 M pixel/s rates at moderate RON regime, meeting most of LO requirements. While they will play a key role in the near future as a medium-cost solution for fast photometry programs, their cost is currently too high for most professional and high-end amateur astronomers.
In this paper we show how low-cost full-frame CCDs can be considered as an alternative for LO detection, when operated in the drift-scanning mode.
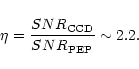
In Sect. 2 we state the main observational constraints when observing LO events. In Sect. 3 we compare the traditional observing method based on PEP systems of to the the drift-scanning technique with CCDs that we propose. In Sect. 3.3, we present signal-to-noise ratio (hereafter SNR) constraints for LO as an indicator of data quality, and a theoretical estimation of lightcurve SNR for both detector systems is performed. In Sect. 4 we present in detail two observations by the drift-scanning technique. Finally, a brief description of the data analysis procedure is shown in Sect. 5. Results from fits with both an unresolved source and a binary source model are discussed.
As for every astronomical observation, a LO lightcurve is distorted by several non-ideal observing factors, each one having different characteristics. Typically, we can distinguish between two aspects which limit the data quality: instrumental effects and random errors. While the former are usually deterministic and can be removed a posteriori if we have an accurate calibration of our instrumental equipment, the latter is associated with stochastic processes with a (presumably) known noise distribution function.
We can also consider the SNR of the lightcurve as an indicator of achievable angular resolution. Actually, this is the key parameter when evaluating data quality, since it establishes how well deterministic distortions can be restored until their effects vanish into noise fluctuations.
In Sects. 2.1 and 2.2, we outline each one of the two mentioned limits on data quality.
From Eq. (1) we see that large telescopes and long integration times, in spite of increasing SNR, blur high frequency information. This is one of the few cases in which the size of the telescope plays against the observer. On the other hand, with smaller D and shorter ![]() the resolution is preserved, but the SNR is decreased, making more difficult the a posteriori
removal of instrumental distortions, and restricting observations only to bright stars. For mV
the resolution is preserved, but the SNR is decreased, making more difficult the a posteriori
removal of instrumental distortions, and restricting observations only to bright stars. For mV ![]() 5 stars, this trade-off relation balances to optimal SNR for about 1m telescope and 1ms integration time. For a typical value of v of 0.5
5 stars, this trade-off relation balances to optimal SNR for about 1m telescope and 1ms integration time. For a typical value of v of 0.5
![]() ,
the above relation yields
,
the above relation yields
![]() mas.
mas.
Since diffraction is a wavelength-dependent phenomenon, polychromatic observations introduce an additional distortion in the lightcurve. As seen in Eq. (2), the magnitude of this effect depends on filter bandwidth. Again, we find a trade-off between
![]() and recorded SNR, which must be balanced properly. Considering, as in our case, a Johnson R filter (
and recorded SNR, which must be balanced properly. Considering, as in our case, a Johnson R filter (
![]() 580
580 ![]() )
we obtain
)
we obtain
![]()
![]() .
.
As stated before, given sufficient SNR it is possible to deconvolve for these deterministic effects on the lightcurve, and achieve angular resolution much smaller than the formal limits of Eqs. (1) and (2).
Depending on the detection technique and the temporal resolution, different noise sources appear. In the particular case of LO work, we should consider the following as dominant.
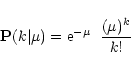
Firstly, in most astronomical situations, the detection process is Poisson distributed, i.e. the probability of obtaining a realization of intensity k coming from a source of mean flux ![]() is given by the Poisson probability:
is given by the Poisson probability:
Secondly, in some detectors, as CCDs, the realization k is read by the electronics of the detector, and a Gaussian RON of zero mean and standard deviation
![]() is introduced. The probability of obtaining a particular realization m from k is
is introduced. The probability of obtaining a particular realization m from k is
Likewise the former Poisson+Gaussian case in Eq. (5), the Poisson+Log-normal compound probability of obtaining a realization m given the mean ![]() and all its possible Poisson realizations k is:
and all its possible Poisson realizations k is:
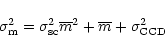
The right-hand terms in Eq. (8) are scintillation, Poisson and Gauss noise contributions, respectively. For usual intensity ranges in LO, lightcurve SNR will be marginally affected by CCD readout noise
![]() .
If, as usual, turbulence is not
negligible (
.
If, as usual, turbulence is not
negligible (
![]() ), the scintillation factor must be taken into account, becoming dominant in the high intensity regime.
), the scintillation factor must be taken into account, becoming dominant in the high intensity regime.
Most LO work at visible wavelengths has been conducted by photoelectric instruments. These devices are usually based on a single thermoelectrically cooled GaAs cell detectors. They are placed at the telescope focal plane. The size of their field of view must be large enough to collect all photons from the seeing-affected stellar image, but at the same time small enough to include as less sky background as possible. One of the more remarkable features of PEP systems is their effective lack of read out noise: they are nearly pure photon counting devices.
The conventional use of a CCD device is the operation in stare mode in which the CCD chip is read out at the end of the exposure. Once the shutter is closed, the charge generated by the incident light on the surface of the CCD is converted to digital numbers, in column by column basis, as the clocked charge moves through a serial register. This has been the usual operating mode in astronomy for years.
However, other modes can be considered since the clocking rate ![]() can normally be specified by the user. Typically, one has three options:
can normally be specified by the user. Typically, one has three options:
![]() ,
,
![]() or
or
![]() ,
where
,
where ![]() is the sidereal rate.
is the sidereal rate.
In the first case, the acquired data appear as point-like sources the provided clocking charge direction coincides with star motion over the chip and the telescope tracking system is disconnected. In the second case, in order to record point-like images it is necessary to have the camera properly aligned and to slow down telescope tracking. These two variants in scanning mode are usually referred to as drift-scanning and time delay integration (TDI). This is the way several meridian circles (e.g. Stone et al. 1996) and Schmidt cameras (e.g. Sabbey et al. 1998) observe for fast sky coverage at moderate limiting magnitude.
The third case is the one we adopt for observing LOs. ![]() can be chosen according to rate and magnitude of the event to be recorded. The detector does not need to have a specific orientation thanks to the ability to track with the telescope. Thus, the stellar image remains stationary over the chip while photogenerated charge is clocked through the serial register at the desired rate
can be chosen according to rate and magnitude of the event to be recorded. The detector does not need to have a specific orientation thanks to the ability to track with the telescope. Thus, the stellar image remains stationary over the chip while photogenerated charge is clocked through the serial register at the desired rate
![]() .
It is interesting to note that our technique is, in a sense, based on the same principle originally proposed by MacMahon (1908) to observe lunar occultations. In that case, a photographic plate on a revolving cylinder had been considered. Such an observation was performed later by Arnulf (1936).
.
It is interesting to note that our technique is, in a sense, based on the same principle originally proposed by MacMahon (1908) to observe lunar occultations. In that case, a photographic plate on a revolving cylinder had been considered. Such an observation was performed later by Arnulf (1936).
It is worth noting that a measure of the star flux is actually obtained every time a column is read out. In standard full-frame CCDs this can be done typically at frequencies of 10 to 500kHz, fast enough for LO work. The fact that these CCDs can only readout one column at a time makes temporal sampling non-optimal, and introduces some smearing in the LO lightcurve. However, this can be overcome by compressing the image scale in order to image the star over a few pixels.
In addition, as our technique makes use of a CCD, a flatfield calibration could be required. Also, residual image motion over several pixels due to atmospheric turbulence could in principle produce a smearing of the fringes. However, the compression of the image scale, plus the fact that pixel sensitivity does not significantly change along a small CCD portion, minimize the incidence of this effect.
As SNR plays a key role in data analysis, the choice of a detector with both high QE and low RON is crucial for data quality. From this point of view, CCDs look very attractive in terms of QE compared to PEPs. We see, therefore, how a full-frame CCD could be used for recording a fast photometry event as LOs. This detector, far from being a specialized one, is very common among instrumentation available in all astronomical observatories. Moreover, it turns out to be a low-cost satisfactory solution for sub-meter class telescopes of low-end a professional and high-end amateur profile.
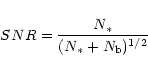
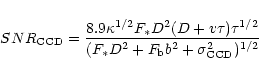
The SNR for a pure-Poisson detector like PEPs placed in the image plane can be expressed as:
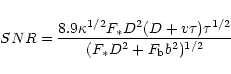
Equation (10) for the case of CCD turns into:
To assess of the theoretical SNR performance between PEPs and CCDs, we consider the following parameters to be input in Eqs. (10) and (11) for either case:
![]() ,
,
![]()
![]() ,
,
![]()
![]() ,
D=0.36
,
D=0.36![]() ,
,
![]()
![]() ,
b=4
,
b=4
![]() and
and
![]() ,
which is typical during LO events just beside the Moon. This is close to the observational setting that we present in Sect. 4. As for the QE of both detector systems, we adopt from Kristian & Blouke (1982) typical values:
,
which is typical during LO events just beside the Moon. This is close to the observational setting that we present in Sect. 4. As for the QE of both detector systems, we adopt from Kristian & Blouke (1982) typical values:
![]() and
and
![]() .
.
The gain ![]() obtained by the use of a CCD is:
obtained by the use of a CCD is:
It is also worth remarking that in the case of our proposed technique, it is possible to adjust a posteriori the size of the integrating aperture. In the data reduction stage, the user could adapt this size to obtain the optimum SNR depending on the actual image motion and on the brightness of the source. In the case of PEPs, the integrating aperture is fixed and in general this has the disadvantage, especially for faint sources and in the visual range, of introducing a large noise contribution from the background.
Thus, we cannot conclude that CCDs have in general better LO SNR than PEPs. However, even with non-optimal temporal sampling inherent to the proposed CCD column shifting technique, it is reasonable to consider CCDs as potential detectors for LO work in a moderately bright star regime.
| (1) | (2) | (3) | (4) | (5) | (6) | (7) | (8) | (9) | (10) | (11) | (12) |
| Source | Date | Filter |
|
mV | CA | PA | Limb vel. | System | Sep. | PA | |
| (nm) | (ms) | (
|
(
|
(
|
magnitudes | (
|
(deg) | ||||
| SAO 77911 | 13-03-00 | R | 2.344 | 4.6 | 34S | 146 | 0.242 | 5.5 | - | - | |
| 6.3 | 0.02a | 178a | |||||||||
| 6.3a | 1.0a | 335a | |||||||||
| SAO 79031 | 14-03-00 | R | 2.067 | 4.0 | 63S | 123 | 0.350 | 4.5 | - | - | |
| 4.5a | 0.10a | 90a |
| |
Figure 1:
Raw image of SAO 79031 occultation at Fabra Observatory. Strip patch spans for 1 s data record, where every 20-pixel column corresponds to 2.067 |
| Open with DEXTER | |
The current paper examines the small-telescope regime. In particular, a Celestron 14 inches Schmidt-Cassegrain telescope (hereafter C14) was used to observe the occultation events reported below. The C14 tube was mounted parallel to the Mailhat double 38 cm-astrograph at Fabra Observatory, Barcelona, Spain (see Docobo 1989 and Núñez et al. 1992 for a more specific description of the astrograph).
Regarding the detector, we employed a Texas Instruments TC-211 CCD, set inside an SBIG ST8 camera as the tracking chip. This is a full-frame front-illuminated CCD with
![]() m pixels and a
m pixels and a
![]() pixel format. Being read out through a parallel port, its electronic module can operate at 30 kHz with 12 electrons rms RON. With these technical specifications and its high quantum efficiency (QE peak reaches 70% at both 650
pixel format. Being read out through a parallel port, its electronic module can operate at 30 kHz with 12 electrons rms RON. With these technical specifications and its high quantum efficiency (QE peak reaches 70% at both 650 ![]() and 730
and 730 ![]() ), the TC-211 appears to be suitable for fast imaging purposes, such as tracking and millisecond photometry.
), the TC-211 appears to be suitable for fast imaging purposes, such as tracking and millisecond photometry.
LO data has been acquired by the drift-scanning scheme described in Sect. 3.2. This technique demands an accurate relative timing method while reading out on a column by column basis (absolute time reference is not a major concern for stellar diameter determination and binary detection). As the time sampling required for LO is about 1ms, the timing accuracy should be far below this figure. Accuracies of 1![]() s are usually achieved either by using specifically dedicated PC-boards or interrupting the CPU internal clock cycle counter. In our case, the latter option was chosen. Both the timing and reading out procedure was carried out by a DOS-based program called SCAN
s are usually achieved either by using specifically dedicated PC-boards or interrupting the CPU internal clock cycle counter. In our case, the latter option was chosen. Both the timing and reading out procedure was carried out by a DOS-based program called SCAN![]() .
.
Table 1 summarizes the data for two observed occultation events. Columns (1) and (2) report source name and observation date. Columns (3) to (5) correspond to filter name, central wavelength and bandwidth and sampling time. Visual magnitude is detailed at Col. (6), while Cols. (7) to (9) report position angle (angle along Moon's limb scans the star), contact angle (angle between lunar motion and scan direction) and angular rate of the event, respectively. All last three columns are predicted values. Columns (10) to (12) show the binary system description: magnitudes of the components, angular separation and position angle. We have split the components into different lines.
As an example of a strip obtained by the technique described in Sect. 3.2, we show in Fig. 1 the final part of the SAO 79031 occultation. In that case, a 20-pixel column is stored every 2.067ms on average. It is important to note here that the proposed drift-scanning scheme allows us to start observation far before predicted LO occultation time. This gives us more flexibility, since it prevents of eventual errors occuring in such predictions.
In Sects. 5.2 and 5.3 we discuss our results separately for SAO 77911 and SAO 79031 events.
We computed lightcurves from raw strip images by averaging central pixels of every column and subtracting the background estimated from the outer pixels. This represents an advantage of the proposed technique with respect to lightcurves derived from PEP systems, since it incorporates both source and background level in the recorded signal. In this way, ![]() can be discarded
from Eq. (13).
can be discarded
from Eq. (13).
![]() Ori (HR 2135, BD+20 1233) is a B2 Ia emission line star. Its angular diameter has been determined by indirect methods three times, w0ith all values smaller than 1
Ori (HR 2135, BD+20 1233) is a B2 Ia emission line star. Its angular diameter has been determined by indirect methods three times, w0ith all values smaller than 1 ![]() (Pasinetti-Fracassini et al. 2001). As stated in Table 1, this is suspected to be a close binary system, discovered by grazing LO (Reynolds & Povenmire 1975). There is great uncertainty in the separation of the components derived from that graze, since there
were only two rather widely spaced stations. In addition, a tertiary component is catalogued. However, serious doubts about its actual existence have been cast of, since if it were really 1.0
(Pasinetti-Fracassini et al. 2001). As stated in Table 1, this is suspected to be a close binary system, discovered by grazing LO (Reynolds & Povenmire 1975). There is great uncertainty in the separation of the components derived from that graze, since there
were only two rather widely spaced stations. In addition, a tertiary component is catalogued. However, serious doubts about its actual existence have been cast of, since if it were really 1.0
![]() apart, it would have been resolved by Hipparcos (Dunham & Bulder 2001).
apart, it would have been resolved by Hipparcos (Dunham & Bulder 2001).
![\begin{figure}
\par\includegraphics[width=8.8cm,clip]{ms1477f2.eps}\end{figure}](/articles/aa/full/2001/42/aa1477/img81.gif) |
Figure 2: SAO 77911 occultation on March 13th, 2000. Data shown as dots, best point-like source fit as solid line, residuals as crosses. |
| Open with DEXTER | |
![\begin{figure}
\par\includegraphics[width=8.8cm,clip]{ms1477f3.eps}\end{figure}](/articles/aa/full/2001/42/aa1477/img82.gif) |
Figure 3: SAO 79031 occultation on March 14th, 2000. Data shown as dots, best point-like source fit with periodic pick-up noise as solid line, residuals as crosses. |
| Open with DEXTER | |
The observation was conducted under partially cloudy conditions, and we are confident that the SNR of the resulting lightcurve could have been slightly higher under clear skies. Nevertheless, a visual inspection denotes a clear magnitude drop at the moment of occultation, and reveals at least the principal diffraction fringe. The same occultation event was also observed few minutes before by
the TIRGO telescope at
![]() 2.2
2.2
![]() .
.
We performed a binary fit of both Fabra and TIRGO lightcurves, and no evidence of binarity was found in either of them. In order to check the good degree of accordance of SAO 77911 Fabra lightcurve data with single point source model in Eq. (13), we show this in Fig. 2, along lightcurve data, the fit and residuals.
|
|
Observational | Ref. | |
| technique | |||
| 2200 | Lunar occultation | 1 | |
| (1 m telescope) | |||
| 2170 |
|
Lunar occultation | 2 |
| (4 m telescope) | |||
| 2170 |
|
Optical interferometry | 3 |
| (38 m baseline) | |||
| 1670 |
|
Lunar occultation | 2 |
| (4 m telescope) | |||
| 1650 |
|
Optical interferometry | 4 |
| (104 m baseline) | |||
| 800 |
|
Optical interferometry | 5 |
| (8-31 m baseline) | |||
| 735 |
|
Optical interferometry | 6 |
| (37.5 m baseline) | |||
| 450 |
|
Optical interferometry | 5 |
| (8-31 m baseline) |
Mekbuda (HR 2650, zet Gem, BD+20 1687) is a Cepheid variable whose fundamental properties (angular diameter, absolute radius, etc.) have been studied by several authors (see Table 2). It is a multiple system. The brightest component is catalogued in Dunham & Warren (1995) as an occultation double separated by
![]() .
That was derived from a single visual observation made with a nearly full Moon (Dunham 2001). On the other hand, recent observations
performed by modern optical interferometers clearly discard such duplicity (Nordgren et al. 2000). Therefore, hereafter we will consider SAO 79031 as a single object.
.
That was derived from a single visual observation made with a nearly full Moon (Dunham 2001). On the other hand, recent observations
performed by modern optical interferometers clearly discard such duplicity (Nordgren et al. 2000). Therefore, hereafter we will consider SAO 79031 as a single object.
The data are shown in Fig. 3: at least two first diffraction fringes can be clearly seen. The lightcurve is significantly affected by both scintillation and pick-up noise. In particular, it has been proven that when scintillation is not taken into account in the lightcurve model, the derived angular diameters are biased towards larger values (Knoechel & von der Heide
1978). Our data analysis method, described by Eq. (3), allowed us to account for both pick-up noise and scintillation. On the other hand, in our particular case with small telescope, stellar diameters could be confidently derived only for very bright and large stars. As shown in Table 2, SAO 79031 appears to have an angular diameter smaller than the limiting angular
resolution imposed by our instrumentation (
![]()
![]() with R filter bandwidth). The lightcurve SNR appears to be insufficient to remove such smearing effect.
with R filter bandwidth). The lightcurve SNR appears to be insufficient to remove such smearing effect.
Thus, as shown in Fig. 3, we have fitted the lightcurve using a single point-source model. Superimposed over the theoretical diffraction curve we have included the 90 Hz pick-up noise found in our electrical network. At the bottom, residuals give idea of the behaviour of scintillation component of noise. We consider that, taking into account the modest equipment being used, the fit is in good accordance with the data points.
A new approach for observing LO has been described. We demonstrate that CCD drift-scanning at millisecond rate turns to be a viable alternative for LO observations. In our case, given the small telescope used, the SNR appears to be insufficient to deconvolve instrumental smearing at the level required for angular diameter studies, but we estimate that the technique yields enough spatial information to perform of binary detection work.
We remark that the proposed technique can be applied to any CCD which supports charge shifting at a tunable rate. This can be done in nearly all CCDs of professional profile and in a large number on the amateur market.
In the visible domain, the same technique extended to observations performed with 1-2 ![]() telescopes would increase the SNR and, therefore, enable one to deconvolve most of the smearing caused by filter bandwidth and allow stellar diameter determination.
telescopes would increase the SNR and, therefore, enable one to deconvolve most of the smearing caused by filter bandwidth and allow stellar diameter determination.
Acknowledgements
This work was supported in part by the DGICYT Ministerio de Ciencia y Tecnología (Spain) under grant No. BP97-0903 and AYA2001-3092. O. Fors is supported by a fellowship from DGESIC Ministerio de Educación, Cultura i Deportes (Spain), Ref. AP97 38107939. We would like to express our gratitude here to Christoph Flohr for making available his program SCAN, which was crucial for performing observations in drift-scanning mode. We would like to thank Xavier Otazu for helping in observation tasks. The TIRGO observation of SAO 79031 was obtained by G. Calamai. We thank the referee, Dr. B. Stecklum, for his valuable comments.
![\begin{displaymath}%
{\bf P}(m\vert k) =
\frac{1}{\sqrt{2\pi}\sigma_{{\rm CCD}}}\exp\left[-\frac{(m-k)^2}
{2\sigma_{{\rm CCD}}^2}\right]\cdot
\end{displaymath}](/articles/aa/full/2001/42/aa1477/img23.gif)
![\begin{displaymath}%
{\bf P}(m\vert\mu) = \sum_{k=0}^{\infty}
\frac{1}{\sqrt{2\p...
...rm CCD}}^2}\right]
{\rm e}^{-\mu}\;\;\frac{(\mu)^{k}}{k!}\cdot
\end{displaymath}](/articles/aa/full/2001/42/aa1477/img24.gif)
![\begin{displaymath}%
{\bf P}(m\vert k) =
\frac{1}{\sqrt{2\pi}bm}\exp\left[
-\frac{(\ln\frac{m}{k}-\frac{b^2}{2})^2}{2b^2}\right]
\end{displaymath}](/articles/aa/full/2001/42/aa1477/img25.gif)
![\begin{displaymath}%
{\bf P}(m\vert\mu) = \sum_{k=0}^{\infty}
\frac{1}{\sqrt{2\p...
...2}{2})^2}{2b^2}\right]
{\rm e}^{-\mu}\;\;\frac{(\mu)^{k}}{k!},
\end{displaymath}](/articles/aa/full/2001/42/aa1477/img28.gif)
![$\displaystyle \left[\beta(t)+[1+\xi(t)]\int{\int{I^0(t,\overline{x},\phi) T(\overline{x})S(\phi){\rm d}\overline{x}{\rm d}\phi}}\right]$](/articles/aa/full/2001/42/aa1477/img75.gif)