 |
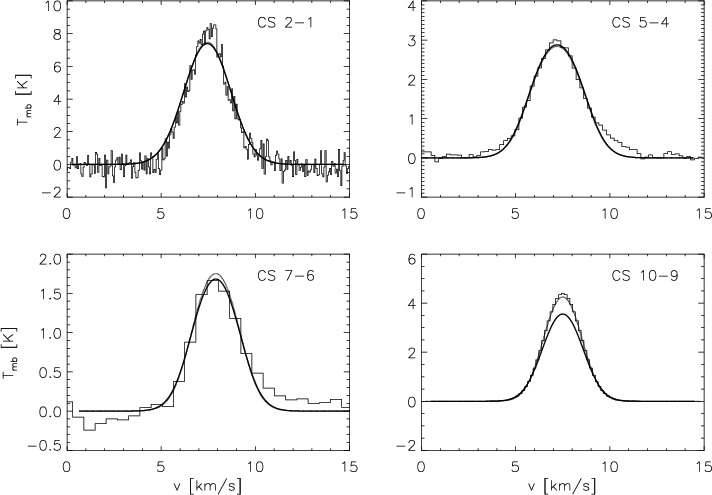
Figure 3: Best fit models to the S255 observations fitting only the three lower transitions (solid lines) or all four transitions (dotted line). |
|
|
|
|
|
|
|
|
|
| [pc] | [pc] | [cm-3] | [K] | [kms-1] | |||
| 4 | [:0.08] | [0.66:] | [1.6:2.2]
|
-[1.3:1.7] | [41:52] | [1.6:2.9] | [-0.01:0.42] |
| 3 | [:0.21] | [0.68:] | [4.4:6.1]
|
-[1.2:1.8] | [40:59] | [1.7:3.2] | [-0.07:0.70] |
| Source |
|
|
|
|
|
|
D |
| [cm-3] | [1023 cm-2] | [K] | [ |
[ |
[pc] | ||
| W49A(a) |
|
2.6 | 4.6 | 92 | 15000 | 22000 | 11000 |
| W49A(b) |
|
0.80 | 4.8 | 109 | 19000 | 14000 | 11000 |
| W33 |
|
2.3 | 3.8 | 28 | 7400 | 6300 | 4000 |
| W51A |
|
3.0 | 9.8 | 43 | 54000 | 30000 | 7500 |
| W3(OH) |
|
1.0 | 1.5 | 39 | 1900 | 1900 | 2200 |
| W3 |
|
3.6 | 9.7 | 41 | 1700 | 1100 | 2200 |
| S255 |
|
1.1 | 0.78 | 47 | 870 | 530 | 2500 |
| S235B |
|
0.66 | 0.22 | 20 | 180 | 210 | 1800 |
| S106 |
|
0.32 | 0.23 | 137 | 280 | 200 | 600 |
| Serpens |
|
0.22 | 0.17 | 93 | 53 | 80 | 310 |
| DR21 |
|
0.82 | 0.79 | 83 | 1800 | 1800 | 3000 |
| Mon R2 |
|
0.22 | 0.18 | 54 | 310 | 260 | 950 |
| NGC 2264 |
|
0.46 | 0.71 | 37 | 450 | 720 | 800 |
| OMC-2 |
|
0.34 | 0.24 | 27 | 95 | 52 | 400 |
|
|
0.12 | 0.12 | 20 | 96 | 34 | 160 | |
| NGC 2024 |
|
1.3 | 1.6 | 36 | 17 | 35 | 420 |
The main constraint to the core parameters that we can derive is set by the molecule and the transitions observed. They are only sensitive to a relatively narrow density range. We can test the limitation of the fits provided by the restriction to three line profiles by comparing the results obtained for cores where we have additional CS 10-9 profiles. With the data from Plume et al. (1997) for S255 we investigate how much information is lost due to the lack of CS 10-9 data in most cores. Figure 3 shows the resulting best fits to the central line profiles in S255 when either all four lines are fitted or only the information from the lower three transitions is used. Table 8 lists the corresponding model parameters from the fits. Isothermal models provided good fits to the data and the derived physical parameters are almost identical except for the inner radius. The additional information from the CS 10-9 transition can set a smaller limit here corresponding to the higher central densities. When predicting the 10-9 line data from the best fit of the three other lines the intensity is too low by only about 20% (Fig. 3). Hence, we expect reliable results also for those cores where only three lines are observed but it would be favourable to add information from higher transitions for a better resolution of the densest inner region.
Moreover, a fourth line will reduce the error bars of the parameters. In Table 9 we compare the error obtained for the S255 observations using either the three- or the four-lines fit. As discussed above the possible range of the inner and outer radii is limited only in one direction. Thus, the fourth line mainly reduces the uncertainty of the inner radius. It hardly influences the error of the outer radius and the density at the inner radius but it also reduces the error of the density exponent, the temperature and the velocity structure. Thus the inclusion of additional lines in the model fits would also give a better constraint of the parameters derived.
Table 10 shows quantities characterising the global properties of the clouds computed from the fit parameters in Table 7. The average density in the second column is given by the cloud mass within the outer radius. We see the strong discrepancy between the average density (Table 10) and the central clump density (Table 7) reflecting a very inhomogenous structure with low volume filling factor of dense clumps.
In the Cols. 3 and 4 of Table 10 one can compare the
average column density towards the centre in the nonlocal model with
the column density computed from the escape probability model.
Here, we have used the molecular column densities from Table 5
assuming a CS abundance of
![]() .
We find an agreement within a factor
of about 1.5, despite the completely different
analysis applied, except for W49A, W51, and W3 where the column density
from the escape probability model is more than a factor of two higher
and S235B where it is lower. S235B, W49A, and W3 are
the smallest sources in our sample unresolved even in the
CS 2-1 beam. Here, the beam filling factors used in the escape probability
model are uncertain so that they may be responsible for the difference.
For W51A, no simple explanation
for the difference is obvious. It is however, by far the most
massive core in our sample so that it might be somewhat peculiar
from that point of view. In general, we find that the escape probability
analysis provides a reasonable determination for the column density
when we have a good estimate of the beam filling factor. It fails to
derive correct densities or sizes.
.
We find an agreement within a factor
of about 1.5, despite the completely different
analysis applied, except for W49A, W51, and W3 where the column density
from the escape probability model is more than a factor of two higher
and S235B where it is lower. S235B, W49A, and W3 are
the smallest sources in our sample unresolved even in the
CS 2-1 beam. Here, the beam filling factors used in the escape probability
model are uncertain so that they may be responsible for the difference.
For W51A, no simple explanation
for the difference is obvious. It is however, by far the most
massive core in our sample so that it might be somewhat peculiar
from that point of view. In general, we find that the escape probability
analysis provides a reasonable determination for the column density
when we have a good estimate of the beam filling factor. It fails to
derive correct densities or sizes.
Columns 6 and 7 in Table 10 shows the core masses
computed in two different ways.
Column 6 gives the integrated mass of the model cloud assuming the
smallest fitting outer radius and the maximum possible central radius.
The influence of the inner radius on the total mass is negligible, but the uncertainty
from the lack of information on the outer radius has to be kept in mind.
Increasing the amount of virtually invisible material around the core
by increasing the outer cloud radius can easily increase the total mass
by more than a factor 10. As the mass computation relies on the knowledge of the
CS molecular abundance (Sect. 4.2), the resulting
values are to be changed if the true abundances deviate from the
assumed value of
![]() .
.
Column 7 contains the core virial mass assuming equipartition
of kinetic and gravitational energy in a homogenous spherical cloud. We used
the central CS 2-1 line profile and the size of the cloud visible in this
transition to estimate the velocity dispersion in the line of sight
and the radius. Following Lang (1980)
we obtain the virial mass by
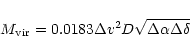 |
(3) |
For all clouds except ![]() Oph A the agreement between the two masses
falls within a factor of two. The behaviour of
Oph A the agreement between the two masses
falls within a factor of two. The behaviour of ![]() Oph A is due to the
radius of the excitation model which is larger than the smallest
resolved core, as discussed above. Hence, it provides a larger mass than
the virial estimate which uses this visible core size. The general
good agreement is quite amazing regarding the uncertainty of the outer boundary
of the models. The clouds seem to be virialised and the CS abundance
estimate holds approximately for all clouds.
Oph A is due to the
radius of the excitation model which is larger than the smallest
resolved core, as discussed above. Hence, it provides a larger mass than
the virial estimate which uses this visible core size. The general
good agreement is quite amazing regarding the uncertainty of the outer boundary
of the models. The clouds seem to be virialised and the CS abundance
estimate holds approximately for all clouds.
The agreement of the mass from the SimLine fits with the virial mass and independent estimates from the literature indicates that the cores are well confined and our minimum outer radius corresponds to a real, relatively sharp boundary for most cores in agreement with the results from continuum observations of several cores by André et al. (1999). Future investigations are, however, necessary to confirm this result because the nature of virialisation is still not understood and it is therefore not clear how much of the "invisible'' low density mass would contribute to the virial mass.
To judge the reliability of the parameters derived here, we can compare them with core parameters obtained independently from observations in other tracers and with other telescopes. In general they provide only values for few of the cloud parameters but they may serve as an independent test of our results. We cannot include a complete discussion of the literature concerning the 15 massive cores considered here. Rather we restrict ourselves to a few selected observations showing the general power and limitations of the method.
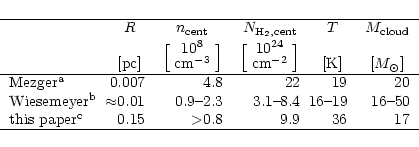
For NGC 2024 we have compared our data with results from complementary
high-resolution observations in Table 11. Mezger et al. (1992)
combined the results of SEST observations at 1.3 mm with IRAM 30 m
continuum maps at 870 ![]() m to identify several clumps in NGC 2024
and to deduce their physical properties from the continuum fluxes.
The given values correspond to FIR5 falling at our central position.
Wiesemeyer et al. (1997)
used a spherically symmetric continuum transfer model to derive the
physical parameters of FIR5 from 3 mm continuum observations
taken with the IRAM Plateau de Bure interferometer combined with the
data from Mezger et al. (1992) and VLA 1.3 cm observations of Gaume et al. (1992).
Depending on the assumed luminosity and dust properties
they found a range of parameters fitting the observed continuum.
The last line in Table 11 represents the results from
the SimLine fit to our data.
In contrast to Table 10, the central column density
given here is not averaged but computed towards a central clump to
allow a better comparison with the dust observations which are
able to resolve this clump.
m to identify several clumps in NGC 2024
and to deduce their physical properties from the continuum fluxes.
The given values correspond to FIR5 falling at our central position.
Wiesemeyer et al. (1997)
used a spherically symmetric continuum transfer model to derive the
physical parameters of FIR5 from 3 mm continuum observations
taken with the IRAM Plateau de Bure interferometer combined with the
data from Mezger et al. (1992) and VLA 1.3 cm observations of Gaume et al. (1992).
Depending on the assumed luminosity and dust properties
they found a range of parameters fitting the observed continuum.
The last line in Table 11 represents the results from
the SimLine fit to our data.
In contrast to Table 10, the central column density
given here is not averaged but computed towards a central clump to
allow a better comparison with the dust observations which are
able to resolve this clump.
|
We see that one cannot reveal the true radius of the core from our low resolution observations. Moreover, the CS observations cannot trace the same high densities as the dust observations so that they provide only a lower limit. It is, however, already close to the central density given by Wiesemeyer et al. (1997). The mass and column density derived from our radiative transfer computations agree quite well with the values provided by the high-resolution observations. A possible explanation for the difference between the gas kinetic temperature and the dust temperatures was provided already by Schulz et al. (1991). They performed NH3 and CS observations of NGC 2024 and obtained temperatures between 35 and 40 K at the position considered. Using a two-component dust model they demonstrated that these temperatures are also consistent with the observations by Mezger et al. (1992). Altogether we are able to derive realistic values for the core parameters with a clumpy radiative transfer model even if we are not able to deduce the exact object size as we cannot resolve it.
W51 consists of three compact molecular cores located within about
one arcmin. Interferometric observations by Young et al. (1998)
and the combination of line and
continuum measurements by Rudolph et al. (1990) seem to indicate
collapse of the component W51e2 with a mass of about 40000 ![]() .
The mass determined by the SimLine fit is 54000
.
The mass determined by the SimLine fit is 54000 ![]() .
The FCRAO and KOSMA observations show no signatures of collapse as
they are probably blurred by our low spatial resolution.
Sievers et al. (1991) obtained temperatures between
20K and 57K and Zang & Ho (1997) derived 40-50 K for an inner
region of about 0.2 pc and 25-30K for the outer cloud based on
NH3 observations. We were able to fit the observations with an
isothermal cloud at 44 K, however cannot exclude such a temperature
structure. Young et al. (1998) used an LTE code assuming spherical
or spheroidal symmetry to simulate the inner 0.2 pc region of W51e2
fitting the observed ammonia data. They obtained density gradients
of -1.8 to -2.2 somewhat steeper than in our fit, indicating that
a dense central region might be surrounded by an envelope
with a flatter density gradient. Their central densities between
1.5 and
.
The FCRAO and KOSMA observations show no signatures of collapse as
they are probably blurred by our low spatial resolution.
Sievers et al. (1991) obtained temperatures between
20K and 57K and Zang & Ho (1997) derived 40-50 K for an inner
region of about 0.2 pc and 25-30K for the outer cloud based on
NH3 observations. We were able to fit the observations with an
isothermal cloud at 44 K, however cannot exclude such a temperature
structure. Young et al. (1998) used an LTE code assuming spherical
or spheroidal symmetry to simulate the inner 0.2 pc region of W51e2
fitting the observed ammonia data. They obtained density gradients
of -1.8 to -2.2 somewhat steeper than in our fit, indicating that
a dense central region might be surrounded by an envelope
with a flatter density gradient. Their central densities between
1.5 and
![]() cm-3 bracket our value of
cm-3 bracket our value of
![]() .
The assumption of a smooth medium by Young et al. (1998) results
in a central temperature estimate below 25K and a steep
temperature gradient. I.e. significantly lower temperatures than
in our clumpy turbulent model. We have tested this behaviour by trying to
fit the data without clumping in our model and also got low
temperatures below 20 K but quite bad
.
The assumption of a smooth medium by Young et al. (1998) results
in a central temperature estimate below 25K and a steep
temperature gradient. I.e. significantly lower temperatures than
in our clumpy turbulent model. We have tested this behaviour by trying to
fit the data without clumping in our model and also got low
temperatures below 20 K but quite bad ![]() values. Thus the
correct treatment of the internal clumping is essential for a
reliable temperature derivation.
values. Thus the
correct treatment of the internal clumping is essential for a
reliable temperature derivation.
W3(OH) was studied e.g. by Wilson et al. (1991) using VLA observations
of methanol and OH and by Tieftrunk et al. (1998) and Helmich et al. (1996)
with single dish observations of ammonia and HDO, respectively.
The KOSMA beam covers several maser spots
and a luminous mm continuum source - probably a class 0 object. Wilson
et al. (1991) obtained a kinetic temperature of the molecular cores of
20K, whereas Tieftrunk et al. (1998) derived 27K. Both agreed with our
total mass estimate of about 2000 ![]() .
The radius of 1.3 pc
determined by Tieftrunk is somewhat smaller than the value computed from
our model, but clearly within the error bar. From the HDO excitation
Helmich et al. (1996) conclude dust temperatures above 100K at densities
between 105 and 106 cm-3, with few embedded clumps at
107 cm-3. This clump density and the column density
of about
.
The radius of 1.3 pc
determined by Tieftrunk is somewhat smaller than the value computed from
our model, but clearly within the error bar. From the HDO excitation
Helmich et al. (1996) conclude dust temperatures above 100K at densities
between 105 and 106 cm-3, with few embedded clumps at
107 cm-3. This clump density and the column density
of about
![]() cm-2 agree approximately with the values from
our spherical model. The temperature of
39 K determined from the CS observations falls into the range discussed
but the difference to the methanol and ammonia values asks for an
explanation. Around the massive
core there is probably still an extended envelope of gas at low densities
insufficient to excite the observed CS transitions (Tieftrunk et al. 1998).
cm-2 agree approximately with the values from
our spherical model. The temperature of
39 K determined from the CS observations falls into the range discussed
but the difference to the methanol and ammonia values asks for an
explanation. Around the massive
core there is probably still an extended envelope of gas at low densities
insufficient to excite the observed CS transitions (Tieftrunk et al. 1998).
W3 was studied in detail by Tieftrunk et al. (1995, 1997, 1998) using C34S,
C18O, NH3, and continuum observations. Our beam covers the
two bright components W3 Main and W3 West. Moreover, the region
contains some ultracompact H II regions related to infrared sources.
The molecular line emission peaks at a position close to W3 West. The line
velocity of our CS observations at -42 kms-1 agrees with the
velocity of W3 West indicating this component as the main originator
of the observed CS emission.
The combination of single dish and VLA observations by Tieftrunk et al.
(1997, 1998) showed extended gas at a temperature of 25-45K, a
density of 104 cm-3, an size of about 1 pc, and a total
mass of 1100-1400 ![]() .
This corresponds well to the parameters
derived from the KOSMA observations. We have
traced the emission to the somewhat larger radius of 1.4 pc, but within
a radius of 1 pc we get about the same average density of
.
This corresponds well to the parameters
derived from the KOSMA observations. We have
traced the emission to the somewhat larger radius of 1.4 pc, but within
a radius of 1 pc we get about the same average density of
![]() cm-3. Our mass estimate of 1100
cm-3. Our mass estimate of 1100 ![]() and the average
temperature of 41 K also agree. The VLA observations
showed several very compact clumps with a size of 0.02 pc, densities
of 107 cm-3, and
and the average
temperature of 41 K also agree. The VLA observations
showed several very compact clumps with a size of 0.02 pc, densities
of 107 cm-3, and
![]() K. They are not resolvable
from our data, but correspond to the clumps in the turbulence description
and the core parameters derived from
the radiative transfer model show a similar size and density. In the
smooth temperature distribution assumed in the radiative transfer model
we are not able to resolve hot spots with 250 K but found the
need for an increased temperature towards the centre.
K. They are not resolvable
from our data, but correspond to the clumps in the turbulence description
and the core parameters derived from
the radiative transfer model show a similar size and density. In the
smooth temperature distribution assumed in the radiative transfer model
we are not able to resolve hot spots with 250 K but found the
need for an increased temperature towards the centre.
From the group of low mass cores, Castets & Langer (1995) analysed CS
observations of OMC-2 by means of an LVG analysis providing
![]() K,
a density of
K,
a density of
![]() cm-3 and a CS column density of
cm-3 and a CS column density of
![]() cm-2 in agreement with our results.
They found already indications for substructure with clump radii
of about 0.022 pc and higher densities in observations with higher resolution.
Our analysis shows densities of at least
cm-2 in agreement with our results.
They found already indications for substructure with clump radii
of about 0.022 pc and higher densities in observations with higher resolution.
Our analysis shows densities of at least
![]() cm-3at a scale of 0.019 pc. The virial mass of 71
cm-3at a scale of 0.019 pc. The virial mass of 71 ![]() computed
by Castets & Langer is only somewhat smaller than our mass estimate
of 95
computed
by Castets & Langer is only somewhat smaller than our mass estimate
of 95 ![]() .
Recent 1.3 mm observations by Chini et al. (1997) show at
least 11 embedded condensations in OMC-2 with masses between 5 and
8
.
Recent 1.3 mm observations by Chini et al. (1997) show at
least 11 embedded condensations in OMC-2 with masses between 5 and
8 ![]() and temperatures between 20 and 33 K whereas 350
and temperatures between 20 and 33 K whereas 350 ![]() m continuum
data by Lis et al. (1998) reveal even 30 clumps but lower temperatures of
17 K supporting our approach of the clumpy cloud model.
m continuum
data by Lis et al. (1998) reveal even 30 clumps but lower temperatures of
17 K supporting our approach of the clumpy cloud model.
The comparison shows that different tracers see different parts
of a cloud corresponding to different physical conditions. Results
from other authors based on CS observations agree in most cases
quite well, whereas the results from other tracers may considerably
differ. The relatively large uncertainty
in the temperature structure that we cannot resolve within our
analysis asks for additional observations in higher transitions
or at better spatial resolution. For nearby clouds like NGC 2024,
OMC-2 or ![]() Oph A we get a good agreement with results from
high-resolution or even interferometric observations, whereas
for distant massive cores like W49A and W51A there are several
open question, especially regarding the temperature structure.
Oph A we get a good agreement with results from
high-resolution or even interferometric observations, whereas
for distant massive cores like W49A and W51A there are several
open question, especially regarding the temperature structure.
All massive cores seem to be approximately virialised independent of their internal structure with respect to the number, distribution and luminosity of young stars. Although one could expect that violent bipolar outflows observed in some cores will drastically change the energy balance in the core, the physics of the turbulence in the cores seems to be extremely stable guaranteeing a continuous state of virialisation.
The relatively sharp outer boundary suggested by the mass estimates can be interpreted in terms of collapse models. The collapse of an isothermal sphere would result in a self-similar density distribution without clear boundary whereas our results rather tend towards the scenario of a finite-size Bonnor-Ebert condensation (Bonnor 1956). The outer boundary is, however, not well determined but only set by the mass constraints because the radiative transfer model itself cannot exclude a continuation of the density structure to larger radii.
The density exponent of about -1.6 derived for most cores is consistent with several collapse models (see Sect. 4.3) but deviations from the exponent for particular clouds up to values around -2 have to be explained.
On the other hand we have seen that simple collapse models are not relevant for the massive cores considered here. Clumpiness is a main feature of all clouds and smooth microturbulent models are not able to explain the observed lines. In agreement with other high-resolution observations we find typical clump sizes of 0.01-0.02 pc at least for the nearby cores. In massive distant cores the situation might be more complex including a hierarchy of clump sizes resulting in a larger uncertainty of the temperature profile derived from our model.
Copyright ESO 2001