 |
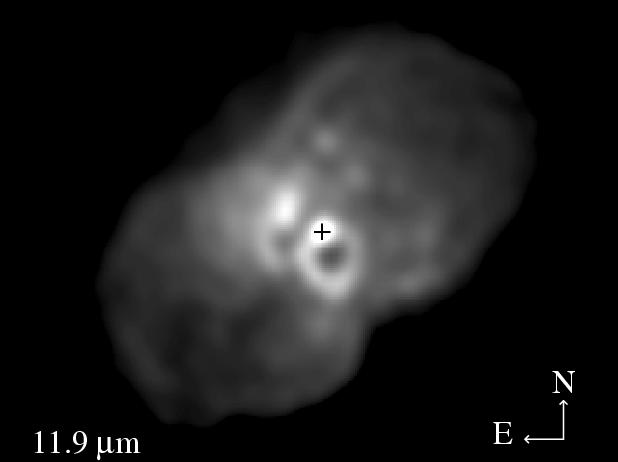
Figure 1:
TIMMI2 image of |
The images were reduced using a shift-and-add technique, where the
shift between individual frames was determined from a least-squares
comparison between the images. The resulting images were then
deconvolved using an empirically determined point spread function
obtained by observing ![]() Cru with the same set-up as
Cru with the same set-up as
![]() Car. For the Q band image we have no good empirical point
spread function. However, given that in the Q band TIMMI2 at the 3.6 m
is diffraction-limited, we have adopted a Gaussian beam of 1.25 arcsec
to deconvolve the Q band image.
Car. For the Q band image we have no good empirical point
spread function. However, given that in the Q band TIMMI2 at the 3.6 m
is diffraction-limited, we have adopted a Gaussian beam of 1.25 arcsec
to deconvolve the Q band image.
We show the final images in Figs. 1 and 2.
Figure 3 shows a temperature map, derived assuming that the
total flux in the images is equal to that seen in the ISO-SWS spectrum
(Mor99). We realize that the variability of ![]() Car
may introduce errors in this calibration. However, we verified the
calibration at 7.9 and 11.9
Car
may introduce errors in this calibration. However, we verified the
calibration at 7.9 and 11.9 ![]() m using
m using ![]() Cru and found values
of
Cru and found values
of
![]() and
and
![]() Jy. The agreement between the two
methods is within 10-20 per cent. We stress that unless the shape of
the spectrum of
Jy. The agreement between the two
methods is within 10-20 per cent. We stress that unless the shape of
the spectrum of ![]() Car has changed considerably between 1996 and
2001, our method should result in reasonable estimates of the
temperature. Note that the strong 10
Car has changed considerably between 1996 and
2001, our method should result in reasonable estimates of the
temperature. Note that the strong 10 ![]() m silicate band
(e.g. Mor99) may introduce some errors (
m silicate band
(e.g. Mor99) may introduce some errors (![]() 15%)
in the temperature map.
15%)
in the temperature map.
Copyright ESO 2001