A&A 376, 460-475 (2001)
DOI: 10.1051/0004-6361:20010879
Multi-frequency variations of the Wolf-Rayet system HD193793 (WC7pd+O4-5)
III. IUE observations
D. Y. A. Setia Gunawan1,2,3 - K. A. van der Hucht2 - P. M. Williams4 - H. F. Henrichs5 - L. Kaper5 - D. J. Stickland6 - W. Wamsteker7
1 - Kapteyn Astronomical Institute, PO Box 800,
9700AV Groningen, The Netherlands
2 - Space Research Organization Netherlands, Sorbonnelaan 2,
3584CA Utrecht, The Netherlands
3 - present address: Australia Telescope National Facility, PO Box 76,
Epping, NSW1710, Australia
4 - Institute for Astronomy, University of Edinburgh, Royal
Observatory, Blackford Hill, Edinburgh EH93HJ, UK
5 - Astronomical Institute Anton Pannekoek, University of
Amsterdam, Kruislaan 403, 1098 SJ Amsterdam, The Netherlands
6 - Space Science Department, Rutherford Appleton Observatory,
Chilton, Didcot, Oxon OX11 OQX, UK
7 - ESA-IUE Observatory, VILSPA, PO Box 50727, 28080 Madrid, Spain
Received 20 February 2001 / Accepted 15 June 2001
Abstract
The colliding-wind binary system WR140 (HD193793, WC7pd+O4-5,
P=7.94yr) was monitored in the ultraviolet by IUE from 1979
to 1994 in 35 Short- Wavelength high-resolution spectra. An
absorption-line radial-velocity solution is obtained from the photospheric
lines of the O component, by comparison with a single O star. The
resulting orbital parameters, e=0.87 0.05,
0.05,
 =31
=31 9
and
9
and
 =2515 kms-1, confirm the large eccentricity
of the orbit, within the uncertainties of previous optical studies. This
brings the weighted mean UV-optical eccentricity to
e=0.850.04. Occultation of the O-star light by the WC wind
and the WC+O colliding-wind region results into orbital modulation of the
P-Cygni profiles of the C II, C IV and Si IV resonance
lines. Near periastron passage, the absorption troughs of those
resonance-line profiles increase abruptly in strength and width, followed
by a gradual decrease. In particular, near periastron the blue
black-edges of the P-Cygni absorption troughs shift to larger outflow
velocities. We discuss that the apparently larger wind velocity and
velocity dispersion observed at periastron could be explained by four
phenomena: (i) geometrical resonance-line eclipse effects being the
main cause of the observed UV spectral variability, enhanced by sightline
crossing of the turbulent wind-wind collision zone; (ii) the
possibility of an orbital-plane enhanced WC7 stellar wind; (iii)
possible common-envelope acceleration by the combined WC and O stellar
radiation fields; and (iv) possible enhanced radiatively driven mass
loss due to tidal stresses, focused along the orbiting line of centers.
=2515 kms-1, confirm the large eccentricity
of the orbit, within the uncertainties of previous optical studies. This
brings the weighted mean UV-optical eccentricity to
e=0.850.04. Occultation of the O-star light by the WC wind
and the WC+O colliding-wind region results into orbital modulation of the
P-Cygni profiles of the C II, C IV and Si IV resonance
lines. Near periastron passage, the absorption troughs of those
resonance-line profiles increase abruptly in strength and width, followed
by a gradual decrease. In particular, near periastron the blue
black-edges of the P-Cygni absorption troughs shift to larger outflow
velocities. We discuss that the apparently larger wind velocity and
velocity dispersion observed at periastron could be explained by four
phenomena: (i) geometrical resonance-line eclipse effects being the
main cause of the observed UV spectral variability, enhanced by sightline
crossing of the turbulent wind-wind collision zone; (ii) the
possibility of an orbital-plane enhanced WC7 stellar wind; (iii)
possible common-envelope acceleration by the combined WC and O stellar
radiation fields; and (iv) possible enhanced radiatively driven mass
loss due to tidal stresses, focused along the orbiting line of centers.
Key words: stars: binaries: spectroscopic - stars: early-type - stars:
Wolf-Rayet - stars: individual: WR140 - stars: winds, outflows
- ultraviolet: stars
1 Introduction
Wolf-Rayet (WR) stars are massive stars characterized by strong stellar
winds, driving mass-loss rates of the order of
 yr-1 (viz., van der Hucht 1992). In
the case of WR+OB binary systems, wind-wind collision causes heating and
compression where the WR and OB wind momenta match. In case of eccentric
binary orbits, the change in binary separation of, and in lines-of-sight
to, the two binary components cause variability in several wavelength
domains: X-ray flux variability, ultraviolet line-profile variability,
infrared flux variability in case of episodic dust formation, and
non-thermal radio flux variability.
yr-1 (viz., van der Hucht 1992). In
the case of WR+OB binary systems, wind-wind collision causes heating and
compression where the WR and OB wind momenta match. In case of eccentric
binary orbits, the change in binary separation of, and in lines-of-sight
to, the two binary components cause variability in several wavelength
domains: X-ray flux variability, ultraviolet line-profile variability,
infrared flux variability in case of episodic dust formation, and
non-thermal radio flux variability.
WR140 (HD193793, V1687Cyg, van der Hucht et al. 1981; van der Hucht 2001) is a spectroscopic WC7 binary system with a O4-5
companion (according to Arnal (2001) possibly escaped from a
triple system some 1.3 105 yr ago), for which the
difficulties in finding a reliable radial-velocity solution have puzzled
many observers (e.g., McDonald 1947; Conti 1971;
Cherepashchuk 1976; Lamontagne et al. 1984; Conti et
al. 1984). First classified as a WR star by Fleming
(1889), its variability has drawn attention only since the 1970s.
Discovery papers are: Schumann & Seggewiss (1975) on optical
spectral variability; Hackwell et al. (1976) on infrared
photometric variability; Florkowski & Gottesman (1977) on radio
variability; Moffat & Shara (1986) on optical photometric
variability; and Williams et al. (1987) on its combined IR, UV
and X-ray variability linked to its spectroscopic orbit.
105 yr ago), for which the
difficulties in finding a reliable radial-velocity solution have puzzled
many observers (e.g., McDonald 1947; Conti 1971;
Cherepashchuk 1976; Lamontagne et al. 1984; Conti et
al. 1984). First classified as a WR star by Fleming
(1889), its variability has drawn attention only since the 1970s.
Discovery papers are: Schumann & Seggewiss (1975) on optical
spectral variability; Hackwell et al. (1976) on infrared
photometric variability; Florkowski & Gottesman (1977) on radio
variability; Moffat & Shara (1986) on optical photometric
variability; and Williams et al. (1987) on its combined IR, UV
and X-ray variability linked to its spectroscopic orbit.
As to continuum variations, Williams et al. (1990, hereafter
Paper I) searched for UV continuum variations in the then available IUE spectra of WR140, but found none. At optical wavelengths, Moffat &
Shara (1986) found micro-variability in broadband Bobservations of WR140 obtained in a time span of 14 days, with an
amplitude of 0.02mag and a tentative period of P=6.25d. More
recently, Panov et al. (2000) monitored WR140 from 1991 to
1998 in UBV photometry. In 1993, a dip in the light curve in all
passbands has been observed around periastron passage (see below), with a
V-amplitude of 0.03mag. They interpreted this dip in terms of an
"eclipse'' by dust condensation in the WC wind, of the type reported by Veen
et al. (1998) for a number of late WC stars.
Thanks to the development of IR photometry in the early 1970s, unexpected
IR variability of WR140 was discovered. The 7.9yr interval between two
IR excesses was proven in a radial-velocity solution by Williams et al.
(1987) to be the orbital period of an eccentric (e=0.84)
binary, with the IR excesses due to periodic dust formation around
periastron passage. This motivated the classification WC7pd (van der Hucht
2001). The infrared, radio and X-ray observations were linked to
a refined orbit by Williams et al. (1990: Paper I). Another IR
excess of WR140 occurred at the predicted time in March 1993 (Williams
1995; 2001).
Annuk (1995) measured the radial velocities of absorption lines
and the C IV 4650 Å emission line. Combining his
observational result and those of others, he derived a period of 2893d.
Annuk's absorption-line solution confirmed the orbital elements derived in
PaperI with a slightly larger eccentricity, e=0.850.01.
4650 Å emission line. Combining his
observational result and those of others, he derived a period of 2893d.
Annuk's absorption-line solution confirmed the orbital elements derived in
PaperI with a slightly larger eccentricity, e=0.850.01.
Radio studies of WR140, also showing the 7.94yr period, were published
by Williams et al. (1994, hereafter Paper II) and by White &
Becker (1995).
The observations mentioned above lead to a model for WR140 of a
WC7pd+O4-5 binary with interacting stellar winds forming two shock fronts
with a contact discontinuity in between (see Papers I and II). Since
the ratio of the wind momenta
 =
=
 (WC7)/
(O4-5)
(WC7)/
(O4-5)
 ,
the cone-shaped contact discontinuity is formed relatively close to the O component, with an opening angle depending on the value of .
Applying the orbital elements derived in Paper I, the O component is, in
the line-of-sight, "behind'' the WC star roughly at phases
0<
,
the cone-shaped contact discontinuity is formed relatively close to the O component, with an opening angle depending on the value of .
Applying the orbital elements derived in Paper I, the O component is, in
the line-of-sight, "behind'' the WC star roughly at phases
0< <0.1 (see Fig. 2; periastron defines
=0). In this phase range, the sightline (assuming an inclination
i
<0.1 (see Fig. 2; periastron defines
=0). In this phase range, the sightline (assuming an inclination
i
 60
)
to the O component passes through the densest part
of the WC and O stellar winds and their interaction region. Because in the
UV the O component is
60
)
to the O component passes through the densest part
of the WC and O stellar winds and their interaction region. Because in the
UV the O component is  mag brighter than the WC component
(Paper I), absorption in the sightline to the O component will dominate
the P-Cygni absorption troughs in the spectrum of the WR140 system in
this phase range. The sightline to the O component is for about half of
the orbit dominated by the WC7 wind.
mag brighter than the WC component
(Paper I), absorption in the sightline to the O component will dominate
the P-Cygni absorption troughs in the spectrum of the WR140 system in
this phase range. The sightline to the O component is for about half of
the orbit dominated by the WC7 wind.
Both the WC7 and O4-5 binary components of WR140 have terminal wind
velocities of the order of
 kms-1.
Fitzpatrick et al. (1982) derived from the composite (WC7+O4-5)
IUE- SWP8004 spectrum of WR140, that the
C IV
kms-1.
Fitzpatrick et al. (1982) derived from the composite (WC7+O4-5)
IUE- SWP8004 spectrum of WR140, that the
C IV
 1548,1551 Å,
Si IV
1394,1403 Å and
C III1909 Å P-Cygni line profiles yield
1548,1551 Å,
Si IV
1394,1403 Å and
C III1909 Å P-Cygni line profiles yield
 =3000100 kms-1. They also observed two
narrow absorption features in the broad P-Cygni Si IV line. Since
the spacing of these narrow absorption features is identical to the doublet
spacing, they interpreted the narrow features as Si IV lines with a
velocity of
=3000100 kms-1. They also observed two
narrow absorption features in the broad P-Cygni Si IV line. Since
the spacing of these narrow absorption features is identical to the doublet
spacing, they interpreted the narrow features as Si IV lines with a
velocity of
 kms-1. Prinja et al.
(1990) argued that the edge velocity (
kms-1. Prinja et al.
(1990) argued that the edge velocity (
 )
of the
saturated absorption part of P-Cygni profiles in high-resolution IUE
spectra of OB and WR stars represented the terminal wind velocity, with on
average
)
of the
saturated absorption part of P-Cygni profiles in high-resolution IUE
spectra of OB and WR stars represented the terminal wind velocity, with on
average
 .
From the
composite (WC7+O4-5) IUE- SWP31504 spectrum of WR140, they
measured for the resonance lines the wind velocities
.
From the
composite (WC7+O4-5) IUE- SWP31504 spectrum of WR140, they
measured for the resonance lines the wind velocities
 =1510 kms-1,
 =2640 kms-1, and
 =2900 kms-1. Eenens & Williams (1994)
measured the terminal velocities of WR stars from the P-Cygni absorption
components of the near-IR He I lines at 1.083
=2900 kms-1. Eenens & Williams (1994)
measured the terminal velocities of WR stars from the P-Cygni absorption
components of the near-IR He I lines at 1.083 m and
2.058m. They found that the observed He I
terminal wind velocities correspond to about 70% of the violet-edge
velocities of the UV resonance P-Cygni profiles of C IV and Si
IV, agreeing well with
of the saturated absorption
troughs. The terminal wind velocities that they derived for WR140 were
m and
2.058m. They found that the observed He I
terminal wind velocities correspond to about 70% of the violet-edge
velocities of the UV resonance P-Cygni profiles of C IV and Si
IV, agreeing well with
of the saturated absorption
troughs. The terminal wind velocities that they derived for WR140 were
 =2900 kms-1 and
 =2845 kms-1, and were ascribed to the WC7
component.
=2845 kms-1, and were ascribed to the WC7
component.
The motivation for the present study was to monitor WR140 for variations
in the UV P-Cygni profiles of resonance lines of abundant ions as a
function of orbital phase, and to obtain a UV radial velocity solution, the
combination of both allowing us to interpret any observed variations as a
function of orbital geometry, aspect angle, and varying lines-of-sight
towards the binary components, and improving our understanding of the
physical nature of the wind-wind interaction.
We present results of monitoring of WR140 in the period 1978 to 1994 with
the International Ultraviolet Explorer (IUE) Short
Wavelength Spectrograph. Observations and data reduction are
described in Sect.2. The analysis, in
Sect.3, includes
(i) a radial-velocity study based on the O component absorption lines;
(ii) a study of the continuum flux variations as a function of
orbital phase;
(iii) a study of the statistical significance of the observed
line profile variability; and
(iv) a study of the variability of the observed P-Cygni profiles.
In Sect.4 the results are discussed, and
Sect.5 summarizes the conclusions.
Preliminary studies of these data were published by Setia Gunawan et al.
(1995a; 1995b).
2 Observations and data reduction
WR140 was observed with IUE from 1979 to 1994 in 35 SWP (
Short Wavelength Prime camera,
1165-2126Å,
 Å)
images, through the large aperture (10´´20´´), mostly in
our own programs at the ESA-IUE Observatory in Villafranca, Spain,
many of them as service observations.
Å)
images, through the large aperture (10´´20´´), mostly in
our own programs at the ESA-IUE Observatory in Villafranca, Spain,
many of them as service observations.
Most IUE- SWP spectra were taken with an exposure time of 120 min; SWP data taken with an exposure time of 195 min show
saturation and could not be used for the emission-line variability study,
but were still useful to study the O-star absorption lines. Some spectra
were recorded in shorter exposure times caused by time-loss during
hand-over between the NASA and ESA ground-stations. The log of
observations is presented in Table 1. The orbital phases
were calculated from the weighted means of the orbital parameters resulting
from this study and those of Paper I.
The spectra were extracted from photometrically corrected
PHOT-images, except the first two IUE- SWP spectra (
SWP6945 and SWP8004) which were extracted from GPHOT-images,
using the STARLINK IUEDR software package (Rees et al.
1996a, 1996b). After correction for order-overlap
using the algorithm of Bianchi & Bohlin (1984), the wavelength
shift was removed by aligning on several narrow interstellar lines.
Subsequently, ripple-correction was applied to the IUE- SWP
images following Barker (1984). The spectra were then mapped
onto an equidistant wavelength grid with intervals of 0.1 Å. The flux
in the resulting spectra is given in units of IUE Flux
Number per second (FN/s). Absolute calibrated spectra can be
retrieved from the INES system (Cassatella 2000).
Analysis of the data was performed by using the STARLINK DIPSO
software package (Howarth et al. 1998). The gaps in the spectra
caused by reseau marks were removed by three-point interpolation at either
side of the gaps. This caused discontinuities in some spectra where the
gaps are too wide. In those cases no interpolation was performed.
3 Analysis
3.1 Radial velocity study
For the purpose of measuring radial velocities of the absorption lines of
the O component of the WR140 system, we used a Cross-
Correlation Function method ( CCF, Stickland & Lloyd
1990). The IUE- SWP spectra of WR140, aligned on
interstellar lines, were compared with the archive IUE spectrum of
the single O4V star HD96715. The orbital parameters were derived by
means of the program RVORBIT by Hill (DAO, private communication).
The single-lined radial-velocity curve is shown in Fig. 1 and
the resulting orbital parameters are listed in Table 2,
Col. (3). We emphasize that this UV radial-velocity solution is
independent from measurements and solutions at other wavelengths, apart
from the adoption of the IR photometric period of P=2900d. In
particular, the high velocities immediately preceding the 1993 periastron
passage, which greatly influence the elements determined, were observed
three cycles later than the corresponding (1969) optical data used for the
solution in Paper I. Column (2) of Table 2 lists the
orbital parameters of Paper I; we note the good correspondence. Column (4) lists the combined orbital parameters, weighted by
 .
The corresponding orbital phases per IUE observation are given in
Table 1.
.
The corresponding orbital phases per IUE observation are given in
Table 1.
The position of the O star with respect to the WC star at the times of the
IUE observations, on the basis of the averaged orbital parameters, is
shown in Fig. 2. The figure demonstrates that owing to the
large eccentricity, both conjunctions are very close to periastron passage,
occurring at =0.957 (O star in front) and =0.010 (O star behind).
![\begin{figure}
\par\includegraphics[angle=90,width=8.5cm,clip]{140fig01.ps}
\end{figure}](/articles/aa/full/2001/35/aah2722/Timg36.gif) |
Figure 1:
The IUE UV single-lined (absorption-line) radial-velocity curve of
the O4-5 companion of WR140, applying as fixed period P=2900d,
following Paper I. The data taken before the 1985.26 periastron passage
are marked with
 symbols; those between the 1985.26 and
1993.2 periastron passages are marked with
symbols; those between the 1985.26 and
1993.2 periastron passages are marked with  symbols; and those
after the 1993.2 periastron passage are marked with
symbols; and those
after the 1993.2 periastron passage are marked with
 symbols. The ensuing orbital parameters are given in
Table2. symbols. The ensuing orbital parameters are given in
Table2. |
| Open with DEXTER |
![\begin{figure}
\par\includegraphics[width=8.4cm,clip]{140fig02.ps}
\end{figure}](/articles/aa/full/2001/35/aah2722/Timg37.gif) |
Figure 2:
The WR140 binary orbit, showing the positions of the O-type component in
the rest-frame of the WR component at the epochs of the IUE
observations listed in Table1. Orbital parameters e and
are weighted means of this study and Paper I. The numbers next
to the O star positions give the orbital phases. |
| Open with DEXTER |
An attempt to measure the radial velocities of emission lines of the
WC component of WR140 by comparison with those of a single WC7 star, to
obtain a double-lined radial-velocity solution, did not lead to significant
results. This is due to line-width differences between individual WC7
stars and severe blending of WC7 emission lines.
The eccentricity
 derived in this study agrees
well with the value
derived in this study agrees
well with the value
 calculated in Paper I from optical
spectra. The UV data suggest that periastron passage occurs
calculated in Paper I from optical
spectra. The UV data suggest that periastron passage occurs
 days earlier than derived in Paper I. The large error bar
is caused by the limited amount of data obtained during periastron: we do
not have sufficient coverage before the 1985 periastron (at phases
0.4<<1.0) and at the time of the 1993 periastron the
position of WR140 was violating the IUE Sun-constraint. Another
indication that periastron occurs earlier, stems from the ASCA X-ray
study of WR140 by Zhekov & Skinner (2000), who argued that
periastron occurs 72 days earlier than derived in Paper I.
days earlier than derived in Paper I. The large error bar
is caused by the limited amount of data obtained during periastron: we do
not have sufficient coverage before the 1985 periastron (at phases
0.4<<1.0) and at the time of the 1993 periastron the
position of WR140 was violating the IUE Sun-constraint. Another
indication that periastron occurs earlier, stems from the ASCA X-ray
study of WR140 by Zhekov & Skinner (2000), who argued that
periastron occurs 72 days earlier than derived in Paper I.
Our least-squares fit of the radial-velocity curve has a relatively small
rms-error of 3.5 kms-1. From the orbital elements resulting from
this UV radial-velocity study, we derive for the O-star orbit a semi-major
axis
 AU and a mass function
 .
Assuming for the mass of the O4-5
component
.
Assuming for the mass of the O4-5
component
 (Paper I) and
 would imply that
 .
.
3.2 The ultraviolet continuum flux
As discussed earlier in Paper I (its Sect.3.4), there is scant
evidence for significant variation in the overall luminosity of WR140.
Recently, Panov et al. (2000) monitored WR140 from 1991 to
1998 in UBV photometry. In 1993 they observed a dip in the light
curves of all three passbands around periastron passage, with a
V-amplitude of 0.03mag.
![\begin{figure}
\par\includegraphics[angle=90,width=7.9cm,clip]{140fig03.ps}
\end{figure}](/articles/aa/full/2001/35/aah2722/Timg63.gif) |
Figure 3:
Ultraviolet continuum fluxes from the absolute calibrated IUE- SWS
high-resolution spectra of WR140 in the wavelength region 1790-1800Å.
The excess point at =0.406 is due to overexposure.
Symbols as in Fig. 1. |
| Open with DEXTER |
In the ultraviolet, Paper I sampled the flux level of the line-free UV
continuum around 1800 Å from low resolution IUE spectra available
at that time. Here we use the 35 absolute flux calibrated IUE
spectra of WR140 retrieved from the INES system (Cassatella
2000). From 34 spectra (excluding the overexposed
SWP-9492), we measured a mean flux level of
 ergs-1cm-2 Å-1.
The flux levels are plotted against orbital phase in
Fig. 3. The amplitude of the scatter is
ergs-1cm-2 Å-1.
The flux levels are plotted against orbital phase in
Fig. 3. The amplitude of the scatter is  %,
and, as in Paper I, we have to regard variation as unproven. However, the
statistically insignificant UV flux dip of
%,
and, as in Paper I, we have to regard variation as unproven. However, the
statistically insignificant UV flux dip of  % at
% at
 ,
i.e., close to periastron, coincides partly with
the much broader optical dip of
,
i.e., close to periastron, coincides partly with
the much broader optical dip of  =0.03mag found by Panov et
al. (2000). They interpreted that dip, which is too broad for a
stellar eclipse, in terms of an "eclipse'' by dust condensation in the
WR-wind, of the type reported by Veen et al. (1998) for a number
of late WC stars.
=0.03mag found by Panov et
al. (2000). They interpreted that dip, which is too broad for a
stellar eclipse, in terms of an "eclipse'' by dust condensation in the
WR-wind, of the type reported by Veen et al. (1998) for a number
of late WC stars.
3.3 The luminosity of the O component
We compare the WR140 WC7pd+O4-5 IUE spectrum with that of the
single WC star WR90 in Willis et al. (1986), and with those of
single O4-5 stars presented in Walborn et al. (1985). We
measured the equivalent widths of absorption and emission parts of the
P-Cygni profiles at around 1400 Å (Si IV) and 1720 Å (N IV), and list them in Table 3.
WR140 shows a strong Si IV
1394,1403 Å P-Cygni resonance doublet and a weak N IV1719 Å P-Cygni profile (see Fig. 5).
O-type stars show a P-Cygni feature at around 1720 Å due to N
IV1719 Å. This feature is strongest in O-type
supergiants, moderate in O-type giants, and weakest in O-type main-sequence
stars. The single O-type supergiants  Pup (O4I(n)f), HD190429A
(O4If+) and HDE269698 (O4If+) show indeed strong N
IV1719 Å P-Cygni and strong Si IV P-Cygni
resonance doublet components. The single O-type giants HD15558
(O5III(f)) and HDE269810 (O3III(f*)) have weak N IV and very
weak Si IV P-Cygni resonance lines. The single O-type main-sequence
stars 9Sgr (O4V((f))), HD46223 (O4V((f))) and HD96715 (O4V((f))) show
weak N IV absorption and no Si IV P-Cygni resonance lines.
Pup (O4I(n)f), HD190429A
(O4If+) and HDE269698 (O4If+) show indeed strong N
IV1719 Å P-Cygni and strong Si IV P-Cygni
resonance doublet components. The single O-type giants HD15558
(O5III(f)) and HDE269810 (O3III(f*)) have weak N IV and very
weak Si IV P-Cygni resonance lines. The single O-type main-sequence
stars 9Sgr (O4V((f))), HD46223 (O4V((f))) and HD96715 (O4V((f))) show
weak N IV absorption and no Si IV P-Cygni resonance lines.
We observe that the 1719 Å P-Cygni profile in the IUE
spectra of WR140 has an emission/absorption ratio of 20 and that of
WR90 has a ratio of 12. The O-type stars in Table3
have ratios in the range  -0.5. Therefore, we suggest that in
the case of WR140 the contribution of the O-companion to that line is
only minor and thus more likely from an O-type main sequence star than a
supergiant, where the latter have stronger 1719 Å lines than the
former.
-0.5. Therefore, we suggest that in
the case of WR140 the contribution of the O-companion to that line is
only minor and thus more likely from an O-type main sequence star than a
supergiant, where the latter have stronger 1719 Å lines than the
former.
The Si IV P-Cygni profile of WR140 almost exactly matches that of
the single WC7 star WR90 (see Willis et al. 1986) in its
strong emission/absorption ratio of  ,
while the O-type stars in
Table 3 have ratios in the range
,
while the O-type stars in
Table 3 have ratios in the range  -0.4.
This indicates that in WR140 the Si IV P-Cygni resonance-line
originates mainly in the WC7 component.
-0.4.
This indicates that in WR140 the Si IV P-Cygni resonance-line
originates mainly in the WC7 component.
From the comparisons made above, we conclude that the O-type component of
WR140 is more likely a main-sequence star.
An alternative way to determine the luminosity of the O component is
provided by van der Hucht (2001). By comparing the equivalent
widths of the C IV5808 Å,
C III4650 Å, C III5696 Å and
O III/IV5592 Å emission lines of WR140 with those
of the five apparently single WC7 stars WR14, WR50, WR56, WR68, and
WR90 (Conti & Massey 1989; Smith et al. 1990), he
found for WR140 that  Mv=
Mv=
 -
-
 =-0.60.3. From a study of galactic WR stars in open
clusters and OB associations, he derived that
=-4.50.7 for single WC7 stars. Thus
=-5.20.5. This corresponds to the luminosity of a
O3-8V star or a O6.5-7III star (Vacca et al. 1996),
consistent with the result derived above.
=-0.60.3. From a study of galactic WR stars in open
clusters and OB associations, he derived that
=-4.50.7 for single WC7 stars. Thus
=-5.20.5. This corresponds to the luminosity of a
O3-8V star or a O6.5-7III star (Vacca et al. 1996),
consistent with the result derived above.
3.4 Statistical significance of the observed variability
![\begin{figure}
\par\includegraphics[width=8.8cm,clip]{140fig04.ps}
\end{figure}](/articles/aa/full/2001/35/aah2722/Timg77.gif) |
Figure 4:
Dots: S/N ratio as a function of
 determined from 35 IUE- SWP spectra of WR140 at 4134
different wavelengths. Curve: best fit of a two-parameter function,
see Eq. (2). determined from 35 IUE- SWP spectra of WR140 at 4134
different wavelengths. Curve: best fit of a two-parameter function,
see Eq. (2). |
| Open with DEXTER |
![\begin{figure}
\par\includegraphics[width=8.5cm,clip]{140fig05.ps} %\end{figure}](/articles/aa/full/2001/35/aah2722/Timg78.gif) |
Figure 5:
Upper panels: average of 35 WR140 IUE- SWP spectra
sampled at 0.1 Å resolution in the 1150-1960 Å range. Relevant
variable features are visible at
1330 Å, 1400 Å and
1550 Å, corresponding to the resonance lines of C II, Si
IV and C IV, respectively. Sharp absorption features are of
interstellar origin.
Lower panels: the Temporal Sigma Spectrum (
TSS), i.e., the corresponding  -ratio, with amplitude
characterizing the variability (Sect.3.4). Slight mismatches
in wavelength calibration introduce peaks in the TSS, especially at
the position of sharp lines. -ratio, with amplitude
characterizing the variability (Sect.3.4). Slight mismatches
in wavelength calibration introduce peaks in the TSS, especially at
the position of sharp lines. |
| Open with DEXTER |
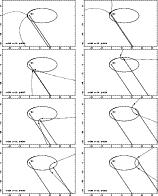 |
Figure 6:
Configurations of the WR140 system as a function of phase shown in the
plane of the orbit and reference frame of the WC component (marked). The
O4-5 star orbits clockwise in this illustration, as does the
wind-interaction region, marked by the contact discontinuity between the WC
and O stellar winds. The form of the contact discontinuity is determined
from the momenta of the two winds (Eichler & Usov 1993) and the
relative velocities of the stellar winds and orbital motion. The changing
sightlines to the two stars are shown. |
| Open with DEXTER |
The UV spectra of WR140 show variations with orbital phase, because the
lines-of-sight towards the two binary components probe at different times
different regions of the O-star wind, the WR wind and the shock cone of the
wind-wind collision region between the two stars.
The significance level of variability in our spectra is expressed in a
Temporal Variance Spectrum (TVS), following Fullerton
et al. (1996). In this method the observed variance in flux in
each wavelength bin (0.1 Å) is compared to the variance due to
instrumental and photon noise (at a corresponding flux level). The TVS can
be approximated by:
![\begin{displaymath}%
(TVS)_\lambda \simeq \frac{1}{({\it N}-1)} \sum_{{\it i}=1}...
...t F}_{\rm
av}(\lambda)}{\sigma_{{\it i}}(\lambda)} \right]^2 ,
\end{displaymath}](/articles/aa/full/2001/35/aah2722/img80.gif) |
(1) |
where N is the number of spectra,
 is the standard
deviation due to instrumental and photon noise,
is the standard
deviation due to instrumental and photon noise,
 is the
flux of the ith spectrum and
is the
flux of the ith spectrum and
 is the average
spectrum.
is the average
spectrum.
The problem is to determine  .
Henrichs et al. (1994) found that
for IUE spectra
can be expressed as a function of flux
only, by measuring the standard deviation of a set of spectra in each
wavelength bin, excluding regions containing the variable spectral lines or
where the echelle orders do not properly overlap. The ratio of
over
.
Henrichs et al. (1994) found that
for IUE spectra
can be expressed as a function of flux
only, by measuring the standard deviation of a set of spectra in each
wavelength bin, excluding regions containing the variable spectral lines or
where the echelle orders do not properly overlap. The ratio of
over
 ,
representing the S/Nratio, is fit with the function (see Fig. 4):
,
representing the S/Nratio, is fit with the function (see Fig. 4):
 |
(2) |
This function is used to specify
for a given Fi in
Eq. (1). To calculate the error in the S/N, we
assumed a Poisson-distribution giving a reduced
 .
The
asymptotic value of S/N=13.6 fits our spectra best. We
used the fit-function above to represent the S/N of all
available WR140 IUE spectra, and to calculate the
.
Next, we calculated the TVS value.
Subsequently, we derived the Temporal Sigma Spectrum
( TSS), which can be approximated by
.
The
asymptotic value of S/N=13.6 fits our spectra best. We
used the fit-function above to represent the S/N of all
available WR140 IUE spectra, and to calculate the
.
Next, we calculated the TVS value.
Subsequently, we derived the Temporal Sigma Spectrum
( TSS), which can be approximated by
 .
This TSS can be considered as the ratio of the observed (
.
This TSS can be considered as the ratio of the observed (
 )
to the expected (
)
to the expected (
 )
standard deviation and is a
direct measure of the amplitude (and significance) of the variability.
)
standard deviation and is a
direct measure of the amplitude (and significance) of the variability.
The average spectrum and the corresponding -ratio of the IUE- SWP spectra of WR140 are shown in Fig. 5. Only
the strongest features are identified. More complete spectral line
identifications of WC7 emission features are listed by Willis et al.
(1986) for the single WC7 star WR90 (HD156385). In the
available spectral regions,
 >1
indicates variability. The larger the ratio, the stronger the degree of
variability. We observe strong, broad variability around
1330 Å, 1400 Å and 1550 Å. Those wavelength
regions correspond to the resonance lines of C II, Si IV and
C IV, respectively, and are discussed below.
>1
indicates variability. The larger the ratio, the stronger the degree of
variability. We observe strong, broad variability around
1330 Å, 1400 Å and 1550 Å. Those wavelength
regions correspond to the resonance lines of C II, Si IV and
C IV, respectively, and are discussed below.
3.5 Variable P-Cygni resonance line profiles
3.5.1 Lines present
All available spectra were scaled to the same flux level by conserving the
total flux in the wavelength regions
 Å,
1565-1605 Å and 1740-1840 Å, where the spectra have relatively
few features. In Fig. 8 we show a dynamic spectrum of the UV
resonance doublet of C II
1335,1336 Å, in
Fig. 9 that of Si IV
1394,1403 Å,
and in Fig. 10 that of C
IV
1548,1551 Å, all in grey-scale representation.
The orbital phase at the time of each observation is indicated by an arrow
along the vertical scale. The horizontal scale represents the velocity
with respect to the rest wavelength of the principal doublet line. Strong
variations occur in the absorption parts of the P-Cygni profiles around
periastron passage (=0, see Fig. 2 for the
geometry of the system).
Å,
1565-1605 Å and 1740-1840 Å, where the spectra have relatively
few features. In Fig. 8 we show a dynamic spectrum of the UV
resonance doublet of C II
1335,1336 Å, in
Fig. 9 that of Si IV
1394,1403 Å,
and in Fig. 10 that of C
IV
1548,1551 Å, all in grey-scale representation.
The orbital phase at the time of each observation is indicated by an arrow
along the vertical scale. The horizontal scale represents the velocity
with respect to the rest wavelength of the principal doublet line. Strong
variations occur in the absorption parts of the P-Cygni profiles around
periastron passage (=0, see Fig. 2 for the
geometry of the system).
3.5.2 Lines varying
In order to visualize the changing sightlines to the two binary components
as a function of orbital phase, we plot in Fig. 6 eight
different configurations, with increasing phase running clockwise. For
most of the orbit, the WC star is observed through its own wind. Only
around conjunction (=0.957), the phase interval depending on the
orbital inclination and the opening angle of the wind-collision cone, can
the sightline pass through the O star wind instead of the outer reaches of
the WC wind. The O-type star, on the other hand, is observed through both
part of the O stellar wind and, apart from a phase interval around
conjunction, a varying sightline through the WC stellar wind whose optical
depth and velocity range depend on phase. Because the O-type star is the
brighter component and the WC wind has the greater optical depth, these
variations have a significant influence on the observed spectrum. We note
the following situations:
(1) Quadratures occur at
 and 0.114. Between these phases,
the O star is more distant than the WC star and is observed through both
red-shifted and blue-shifted WC wind material. Both the velocity and the
optical depth are at maximum at
and 0.114. Between these phases,
the O star is more distant than the WC star and is observed through both
red-shifted and blue-shifted WC wind material. Both the velocity and the
optical depth are at maximum at
 and the effects of this
are clearly seen in the Si IV and C IV observations
(Figs. 7, 9, 10).
and the effects of this
are clearly seen in the Si IV and C IV observations
(Figs. 7, 9, 10).
(2) From =0.114 to about =0.5, and depending on the
inclination of the orbit, the sightline to the O-star passes through less
of the WC stellar wind. At the same time, as the angle between the
sightline and the wind falls, the velocity range covered by the P-Cygni
absorption falls and approaches the terminal wind velocity. This is also
seen in the evolution of the absorption features, particularly Si
IV. This is consistent with the view (Sect. 3.3 and
Table 3) that the Si IV is formed mainly in the
WC7 star.
(3) As the orbit progresses, this evolution continues until
 0.85 (depending on orbital inclination), our sightline to
the WC7 star also passes through the O star wind until conjunction at
=0.957. Our spectrum at this phase ( SWP46119) is not of
the highest quality but the Si IV absorption does appear to be
weakest at this phase.
0.85 (depending on orbital inclination), our sightline to
the WC7 star also passes through the O star wind until conjunction at
=0.957. Our spectrum at this phase ( SWP46119) is not of
the highest quality but the Si IV absorption does appear to be
weakest at this phase.
3.5.2.1. Line-eclipse spectra
![\begin{figure}
\par\includegraphics[angle=90,width=7cm,clip]{140fig07.ps}
\end{figure}](/articles/aa/full/2001/35/aah2722/Timg96.gif) |
Figure 7:
Ratio of the IUE spectrum of WR140 at =0.010 (O star
behind the WR star in line-of-sight) and the average of 19 IUE
spectra of WR140 with 0.5<<1 (O star in front
of the WR star wind in line-of-sight, see Fig. 2) for the
C II, Si IV, and C IV resonance lines, giving "eclipse''
spectra. |
| Open with DEXTER |
In order to visualize what happens around periastron, we took the ratio of
the C II, Si IV and C IV profiles observed at
=0.010 (O star behind the WR star in the line-of-sight, see
Fig. 6) over the average of the 19 spectra observed at
0.5<<1.0 (O star in front of the WR star wind in
the line-of-sight). We verified that all spectra between
 and =0.957 are almost similar. The result,
displayed in Fig. 7, shows "eclipse'' spectra in those
lines at phase =0.010, i.e., very close to periastron. We
observe again that the C IV and Si IV resonance lines show at
periastron excess absorption with
and =0.957 are almost similar. The result,
displayed in Fig. 7, shows "eclipse'' spectra in those
lines at phase =0.010, i.e., very close to periastron. We
observe again that the C IV and Si IV resonance lines show at
periastron excess absorption with
 kms-1, i.e.,
  kms-1faster than at quiescence.
The excess UV absorption occurs at the same phases as the excess X-ray
absorption (Paper I).
![\begin{figure}
\par\includegraphics[width=7cm,clip]{140fig08r.eps}
\end{figure}](/articles/aa/full/2001/35/aah2722/Timg100.gif) |
Figure 8:
The C II resonance doublet of WR140 in grey-scale representation.
Epochs of observation are indicated by arrows. The horizontal scale
represents velocity with respect to the rest-wavelength of the principal
doublet component. The interstellar doublet components of the C II
resonance line mark the rest-wavelengths. At periastron (=0),
the absorption troughs of the P-Cygni profiles become deeper and broader.
The spectrum at =0.406 ( SWS9492) is overexposed. |
| Open with DEXTER |
![\begin{figure}
\par\includegraphics[width=7cm,clip]{140fig10r.eps}
\end{figure}](/articles/aa/full/2001/35/aah2722/Timg102.gif) |
Figure 10:
The same as Fig. 8, here for C IV. The strong narrow
absorption feature at 1527 Å is Si II1526.71 Å. |
| Open with DEXTER |
The broad, shallow absorption features in the Si IV and C IV
ratios are formed in the red-shifted WC wind material as noted above. The
Si IV profile extends to about +3400 kms-1, interpreted as a
red shift of the 1403 Å component by +1250 kms-1.
The profile shows a discontinuity near this velocity which we attribute to
the redshift of the stronger 1394 Å component. Similarly,
we interpret the +2000 kms-1 redward extension of the C IV
profile as a red shift of the 1551 Å component by
+1500 kms-1. These redshifts are interpreted as the maximum
component of the WC stellar wind in our sightline to the O star and can be
used to estimate the inclination of the orbit. Assuming no radiative
braking, the maximum velocity is
 ,
where i is the orbital inclination and
,
where i is the orbital inclination and
 the angle above
the orbital plane subtended at the WC star by the intersection of the
sightline and the wind contact discontinuity. The value of
is found from i and the wind parameters using Eq. (24) of Cantó et al.
(1996) to be
the angle above
the orbital plane subtended at the WC star by the intersection of the
sightline and the wind contact discontinuity. The value of
is found from i and the wind parameters using Eq. (24) of Cantó et al.
(1996) to be
 .
A
+1350 kms-1 maximum redshift then implies an orbital inclination
i=38
.
Owing to the difficulty of fitting the absorption
profiles, this may be a lower limit, but does suggest either that the orbit
of WR140 is not greatly inclined, or that radiative breaking of the WC stellar wind does occur at this phase.
.
A
+1350 kms-1 maximum redshift then implies an orbital inclination
i=38
.
Owing to the difficulty of fitting the absorption
profiles, this may be a lower limit, but does suggest either that the orbit
of WR140 is not greatly inclined, or that radiative breaking of the WC stellar wind does occur at this phase.
3.5.2.2. The CII
1335,1336 Å resonance lines
The time-variable C II resonance P-Cygni line profiles
(Fig. 8) show a significant non-variable narrow absorption dip
in both doublet components at a constant velocity of about
-3100 kms-1, reminiscent of the narrow absorption components seen
in O-type stars (Kaper et al. 1996). These represent very
likely the signature of the terminal wind velocity of the O component.
Although the absorption part of the red doublet component is
contaminated by the emission part of the blue doublet component, we
observe for both doublet components a similar tendency of variability: the
absorption features are broader and deeper right after periastron passage
( ).
).
At the blue end of these absorption features we measure
 kms-1 at all phases. At periastron
passage no change in
is observed, contrary to what happens
in the C IV and Si IV resonance line profiles (see below).
However, at periastron the red black-edge of the C II P-Cygni
absorption trough abruptly expands from about -2800 kms-1 to
-1800 kms-1. The red black-edge of the C II
absorption trough is back to quiescence at
kms-1 at all phases. At periastron
passage no change in
is observed, contrary to what happens
in the C IV and Si IV resonance line profiles (see below).
However, at periastron the red black-edge of the C II P-Cygni
absorption trough abruptly expands from about -2800 kms-1 to
-1800 kms-1. The red black-edge of the C II
absorption trough is back to quiescence at
 ,
when the
the line-of-sight passes through rather more of the O star wind and less of
the WC stellar wind (see Fig. 6).
,
when the
the line-of-sight passes through rather more of the O star wind and less of
the WC stellar wind (see Fig. 6).
3.5.2.3. The SiIV
1394,1403 Å resonance lines
Although the absorption part of the red doublet component is
contaminated by the emission part of the blue doublet component, we
observe for both Si IV doublet components a similar tendency of
variability: the absorption features are broader and deeper right after
periastron passage (=0), and even become saturated.
At the blue end of these absorption features we measure
 kms-1 for
 ,
i.e., during quiescence. Just after periastron passage (),
increases abruptly to about -3200 kms-1. At phase
,
i.e., during quiescence. Just after periastron passage (),
increases abruptly to about -3200 kms-1. At phase
 ,
has gradually returned back to about
-2800 kms-1.
,
has gradually returned back to about
-2800 kms-1.
Also just after periastron passage, the red black-edge of the
Si IV P-Cygni absorption trough abruptly expands from about
-2600 kms-1 to about -2000 kms-1. Thus, at
 the Si IV black absorption trough has a total
extent from about -3200 to -2000 kms-1. In addition, as can be
seen clearly in Fig. 9, overall excess red absorption
extends to +3400 kms-1.
the Si IV black absorption trough has a total
extent from about -3200 to -2000 kms-1. In addition, as can be
seen clearly in Fig. 9, overall excess red absorption
extends to +3400 kms-1.
The blue black-edge of the Si IV absorption trough is back to
quiescence at
 ;
the red black-edge of the
Si IV absorption trough is back to quiescence at
;
the red black-edge of the
Si IV absorption trough is back to quiescence at
 .
.
The time-variable Si IV resonance P-Cygni line profiles
(Fig. 9) show a significant non-variable narrow absorption
feature with approximately the same wavelength separation as the Si
IV doublet components at a constant wavelength, corresponding to a
Si IV velocity of about -3700 kms-1. However, since at
that velocity no absorption features are seen in other P-Cygni profiles of
WR140, these absorption features must be of O star photospheric origin.
3.5.2.4. The CIV
1548,1551 Å resonance
lines
Although the absorption troughs of both C IV doublet components
largely overlap, we observe for both a similar tendency of variability: the
saturated absorption features are broader right after periastron passage
().
At the blue end of these absorption features we measure
kms-1 for
 ,
i.e., during quiescence. Just after periastron passage,
increases abruptly to about -3200 kms-1. At phase
,
i.e., during quiescence. Just after periastron passage,
increases abruptly to about -3200 kms-1. At phase
 ,
has gradually returned back to about
-2800 kms-1.
,
has gradually returned back to about
-2800 kms-1.
Also at periastron the red black-edge of the C IV P-Cygni
absorption trough abruptly expands from about -2600 kms-1 to about
-1700 kms-1. Thus, at
the C IV black
absorption width has a total extent from about -3200 to
-1700 kms-1. In addition, as can be seen clearly in
Fig. 10, overall excess red absorption extends to
+2000 kms-1.
The blue and red black-edges of the C IV absorption
trough are back to quiescence at
.
when the
line-of-sight passes through rather more of the O star wind and less of the
WC stellar wind (see Fig. 6).
The time-variable C IV resonance P-Cygni line profiles
(Fig. 10) show a faint non-variable narrow absorption feature in
both doublet components with approximately the same wavelength separation
as the C IV doublet components at a constant wavelength difference,
corresponding to a C IV velocity of about -3400 kms-1.
However, since at that velocity no absorption features are seen in other
P-Cygni profiles of WR140, these absorption features must be of O star
photospheric origin. IUE spectra of single OV-type stars show
absorption features at the same wavelengths (Walborn 1985).
It appears that the C II, C IV and Si IV resonance
lines behave identically, the difference being the optical depth.
3.5.2.5. Other spectral lines
At 1640Å, the wavelength of the strongest He II emission line,
we find no significant variability. In contrast, IUE spectra of the
WN binaries HD90657 (WR21, WN5+O4-6), V444Cyg (WR139, WN5+O6III-V),
and GPCep (WR153, WN6/WCE+O6I) show variable He
II1640Å emission-line strength when the O star is in
front of the WR star in the line-of-sight (Koenigsberger & Auer
1985).
We also looked for variability in the N
V
1239,1243 Å resonance doublet, which we expect to
be observable from the O-star wind only. Unfortunately, this line is
blended by the absorption part of the WC C
III1247 Å P-Cygni profile (not a resonance line, not
variable) and the S/N ratio is rather low in this part of our
IUE spectra.
4 Discussion
In general, when the inclination of a WR+O colliding wind binary causes
wind occultation effects, we can expect the observed wind velocities
reflected in the blue black-edges of the P-Cygni absorption troughs to vary
between the wind terminal velocities of the individual WR star and O star.
In the absorption part of the Si IV P-Cygni profile
(Fig. 9), the blue black-edge of the absorption trough,
i.e., the apparent terminal wind velocity, increases by
 kms-1 to
 kms-1, when the O star in its orbit
passes the WC star at periastron (
)
and moves behind it
in the line-of-sight (see Fig. 6). In
Sect. 3.3 we concluded that the Si
IV
1394,1403 Å resonance-line doublet originates
only in the WC7 star. Even if the O component contributed to that line,
the increase to maximum blue-shifted velocity of -3200 kms-1at =0 cannot have been caused in the O star wind alone, because
the O star wind provides less absorption than the much denser WC star
wind. The O star light in the line-of-sight at
is being
absorbed by both the O-star wind and the WC-star wind matter. Thus the
apparent
kms-1, when the O star in its orbit
passes the WC star at periastron (
)
and moves behind it
in the line-of-sight (see Fig. 6). In
Sect. 3.3 we concluded that the Si
IV
1394,1403 Å resonance-line doublet originates
only in the WC7 star. Even if the O component contributed to that line,
the increase to maximum blue-shifted velocity of -3200 kms-1at =0 cannot have been caused in the O star wind alone, because
the O star wind provides less absorption than the much denser WC star
wind. The O star light in the line-of-sight at
is being
absorbed by both the O-star wind and the WC-star wind matter. Thus the
apparent
 occurs when the line-of-sight to the O star
passes very close to the WC star through the WC wind.
occurs when the line-of-sight to the O star
passes very close to the WC star through the WC wind.
Contrary to this, the C II
1335,1336 Å and
C IV
1548,1551 Å resonance lines originate in
both binary components. This can be seen clearly in the C II
profile (Fig. 8), where two sets of shifted doublet components
are present. One set is blue-shifted by about -2800 kms-1, and
the other set, slightly fainter, is blue-shifted by about
-3100 kms-1. The set with higher velocity shows a consistent
brightness throughout the orbit while the set with lower velocity shows
variability. The absorption profile is very broad just after periastron
and gradually becomes narrower until around phase
 ,
whereafter the absorption trough becomes
relatively weak. The larger velocity is reminiscent of the terminal wind
velocities
kms-1 for O4-5 stars (Conti
1988). The smaller velocity is consistent with the observations of WR140
by Eenens & Williams (1994), who measured (He
I1.083m)=2900 kms-1 and (He
I2.058m)=2845 kms-1, respectively.
,
whereafter the absorption trough becomes
relatively weak. The larger velocity is reminiscent of the terminal wind
velocities
kms-1 for O4-5 stars (Conti
1988). The smaller velocity is consistent with the observations of WR140
by Eenens & Williams (1994), who measured (He
I1.083m)=2900 kms-1 and (He
I2.058m)=2845 kms-1, respectively.
Again, we emphasize that the variability is observed as excess absorption,
i.e., in the absorption troughs of the P-Cygni line profiles of C
II, Si IV and C IV during and just after
,
and over the whole P-Cygni profiles of Si IV
and C IV. Thus the variations are related to changes in the
lines-of-sight towards both stars. When the O star is in front of
the WC wind (0.6

 ,
see
Fig. 6), we observe in the line-of-sight towards the O
star through material of the O-star wind and, superimposed, in the
line-of-sight towards the WC star through much denser WC wind material
(recall that the O-star wind is confined to a cone in the WC-star wind, see
Fig. 6). For about half of the orbit after periastron
(
,
see
Fig. 6), we observe in the line-of-sight towards the O
star through material of the O-star wind and, superimposed, in the
line-of-sight towards the WC star through much denser WC wind material
(recall that the O-star wind is confined to a cone in the WC-star wind, see
Fig. 6). For about half of the orbit after periastron
(
 ), the dense WC wind is in front of the O
star, dominating the absorption in the line-of-sight towards the O star.
Thus, only when the O star is in front of the WC star in the
line-of-sight (
), the dense WC wind is in front of the O
star, dominating the absorption in the line-of-sight towards the O star.
Thus, only when the O star is in front of the WC star in the
line-of-sight (
 ), does one observe uncontaminated
O-star material in the line-of-sight towards that component. Right after
periastron passage (
), does one observe uncontaminated
O-star material in the line-of-sight towards that component. Right after
periastron passage (
 ), the bulk of the dense WC
wind is in front of the O star in the line-of-sight, dominating the
circumstellar absorption.
), the bulk of the dense WC
wind is in front of the O star in the line-of-sight, dominating the
circumstellar absorption.
The observed asymmetric velocity increase/decrease is clearly caused by the
large eccentricity of the orbit (as concluded in Sect. 3.1),
both conjunctions are very close to periastron passage, occurring at
 (O star in front) and
 (O star behind),
and the aspect angle, affecting the sightlines towards both binary
components as a function of orbital phase.
(O star behind),
and the aspect angle, affecting the sightlines towards both binary
components as a function of orbital phase.
The increase at periastron in maximum blue velocity (to about
-3100 kms-1) cannot be solely due to absorption in the O star wind
(which has the larger wind velocity), because most of the absorption at
these orbital phases occurs through the much denser (but slower) WC wind.
We offer the following explanations:
(i) At the stronger-absorption/larger velocity phases
(0<
0.3), the sightline to the (brighter) O star passes
close to the WC star and through the densest part of its wind, where
anomalously broad emission lines are formed (corresponding to
 kms-1, Torres et al. 1986). The
manifestations of broadening may be caused by turbulence in the wind,
probably arising from the wind-wind collision region.
kms-1, Torres et al. 1986). The
manifestations of broadening may be caused by turbulence in the wind,
probably arising from the wind-wind collision region.
(ii) If the WR wind is not spherically symmetric but faster at latitudes
around the WR star's equator (likely to be aligned with the orbital plane),
then faster sightline absorption due to wind occultation, as observed at
,
would be a logical consequence.
(iii) As a hypothesis, because the luminosity of the O star is about
twice that of the WC star, the majority of the UV photons are emitted by
the O star. Both stellar winds are driven by radiation pressure; when the
separation between the two stars is smallest (the minimum separation is
 AU
AU
 ,
see Paper I) one could expect
that common-envelope acceleration by the combined WC and O stellar
radiation fields, which is always dominated by that of the O star, is most
effective, since this effect scales with the squared separation of the
binary components in their eccentric orbit. This, however, would have to
be proven through atmospheric modelling, which is beyond the scope of this
paper.
,
see Paper I) one could expect
that common-envelope acceleration by the combined WC and O stellar
radiation fields, which is always dominated by that of the O star, is most
effective, since this effect scales with the squared separation of the
binary components in their eccentric orbit. This, however, would have to
be proven through atmospheric modelling, which is beyond the scope of this
paper.
(iv) As a further hypothesis, recent investigations of Gayley
(2001) indicate that in massive close binaries enhanced
radiatively driven mass loss due to tidal stresses will be focused along
the orbiting line of centers. Koenigsberger et al. (2001)
explain the variability observed in HD5980 by this effect.
The literature provides data on some other WR colliding wind binaries that
show excess wind velocities as a function of orbital phase:
(a)
The long-period WC7pd+O9 binary WR137, with a period of P=13.1yr
(Williams et al. 2001), shows in its IUE- SW spectra
a behaviour similar to that of WR140, with an excess
 kms-1 at periastron.
(b)
The apparent wind variability phenomena in the IUE spectra of WR140
(and WR137) discussed above are reminiscent of those found by St-Louis et
al. (1993) in Copernicus and IUE UV spectra of the
WC8+O7.5III-V binary  Velorum (WR11, P=0.22yr,
 ). They argued that the pattern of variability in
the UV spectra of Vel can be understood in terms of selected
eclipses of the O star light when passing through the WC8 stellar wind, as
proposed by Willis & Wilson (1976), combined with an asymmetric
wind density due to colliding wind effects. The same IUE data of
WR11 had been interpreted earlier by Brandi et al. (1989), who
suggested that the variable
components observed in the Si
IV, C IV and N V resonance line profiles of WR11 are
caused by a jet-stream of gas moving away from the system with a velocity
of
). They argued that the pattern of variability in
the UV spectra of Vel can be understood in terms of selected
eclipses of the O star light when passing through the WC8 stellar wind, as
proposed by Willis & Wilson (1976), combined with an asymmetric
wind density due to colliding wind effects. The same IUE data of
WR11 had been interpreted earlier by Brandi et al. (1989), who
suggested that the variable
components observed in the Si
IV, C IV and N V resonance line profiles of WR11 are
caused by a jet-stream of gas moving away from the system with a velocity
of
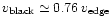
 kms-1. Applying the correction factor of 0.76 of
Prinja et al. (1990), this scales down to a jet outstream
velocity of about -500 kms-1. A similar apparent outstream
velocity variability in WR11 has been observed in monitoring observations
of the optical C III4650 (non-resonance) emission
line by Schweickhardt et al. (1999), who found that the
variable component shows a maximum outstream velocity of about
-700 kms-1.
kms-1. Applying the correction factor of 0.76 of
Prinja et al. (1990), this scales down to a jet outstream
velocity of about -500 kms-1. A similar apparent outstream
velocity variability in WR11 has been observed in monitoring observations
of the optical C III4650 (non-resonance) emission
line by Schweickhardt et al. (1999), who found that the
variable component shows a maximum outstream velocity of about
-700 kms-1.
(c)
Variable excess emission components have also been observed in the
C III5696 emission lines of the short-period
WC7+O binaries WR42 (P=7.9d) and WR79 (P=8.9d) by Hill
et al. (2000), as a function of orbital phase. They assume,
following Lührs' (1997) earlier study of that emission line in
WR79, that the excess emission arises in the colliding wind regions of
the respective WC7+O binaries. In the analytical Lührs model it is
assumed that the O star and its wind are embedded in the wind of the WR
star, and that the boundary surface is cone-like and rotationally symmetric
with respect to the line connecting the two stars. Model fitting of the
observed excess emission profiles as a function of phase, allows one to
obtain the streaming velocity
 of material in the cone, among
other cone parameters. For WR42 Hill et al. (2000) find that
of material in the cone, among
other cone parameters. For WR42 Hill et al. (2000) find that
 ,
while its
=1500 kms-1 (Eenens & Williams 1994); for
WR79 they find that
,
while its
=1500 kms-1 (Eenens & Williams 1994); for
WR79 they find that
 kms-1, while
its
kms-1, while
its
 kms-1 (Prinja et al. 1990).
Apparently their streaming velocities are of the order of magnitude of the
terminal wind velocities.
kms-1 (Prinja et al. 1990).
Apparently their streaming velocities are of the order of magnitude of the
terminal wind velocities.
(d)
IUE spectra of the short-period (P=4.2d) WN5+O6III-V close
and eclipsing binary V444Cyg show an excess terminal velocity of
 kms-1 (from about -1700 to
-2900 kms-1, but contrary to the three WC cases, only when the
O-type star is in front of the WN star (Shore & Brown
1988, their wind velocities scaled down by a factor of 0.76
following Prinja et al. 1990).
kms-1 (from about -1700 to
-2900 kms-1, but contrary to the three WC cases, only when the
O-type star is in front of the WN star (Shore & Brown
1988, their wind velocities scaled down by a factor of 0.76
following Prinja et al. 1990).
(e)
The extremely variable medium-period (P=19.3d, e=0.31,
i=88 )
LBV/WR eclipsing binary HD5980 in the SMC shows only
when star B (the WN4 star) is in front of star A (the LBV-type
eruptor in the system), i.e., at the time of eclipse of star A, a sudden
increase of the C IV P-Cygni absorption edge velocity from
-2500 kms-1 to -3300 kms-1 (Koenigsberger et al.
2000).
)
LBV/WR eclipsing binary HD5980 in the SMC shows only
when star B (the WN4 star) is in front of star A (the LBV-type
eruptor in the system), i.e., at the time of eclipse of star A, a sudden
increase of the C IV P-Cygni absorption edge velocity from
-2500 kms-1 to -3300 kms-1 (Koenigsberger et al.
2000).
Indications of enhanced, focused winds at periastron have also been found
in OB binaries, e.g. in the medium-period (P=29.1d, e=0.764)
O9III+B1III binary  Ori (Gies et al. 1996).
The case of WR140 has also corresponding aspects with the massive binary
Car (P=5.52 yr, e=0.90) according to Corcoran et al.
(2001), who argue for a phase-dependent mass loss from
Car near periastron, on the basis of its X-ray light curve.
In Table 4 we summarize the observed velocities from
IUE studies of WR11, WR137, WR139 and WR140. We conclude for
all cases, that the observed excess velocities in the spectra of these WR+O
binaries are caused by variable absorption in the sightlines to the O stars
when passing through their respective turbulent wind-wind collision
regions. For the binaries with very eccentric orbits the excess velocities
could be enhanced by variable common envelope radiative acceleration.
5 Conclusions
From a study of a 35 high-resolution IUE- SW spectra of WR140
(WC7pd+O4-5), we have derived a radial velocity solution, and we have shown
the occurrence of substantial resonance line variations in this system. We
draw the following conclusions:
1. The large eccentricity of the 7.94yr orbit is confirmed at
e=0.87.
2. The O4-5 component is a main sequence star.
3. Significant changes in the shape of the UV line profiles and
strengths are confined to resonance lines of ions expected to be
chemically abundant in the WC7 and O4-5 stellar winds.
4. The detailed phase-dependent nature of the line profile changes is
found to be consistent with the concept of selective line eclipses
of the O4-5 star light by the WC7 stellar wind, affected strongly by
the orbital geometry which determines the lines-of-sight to the
individual binary components as a function of orbital phase.
5. While it appears clear that line-eclipsing effects are the main
cause of the observed UV spectral variability, the detailed line
profile changes show that at least some of the eclipsing material is
not distributed in a spherically symmetric way around the WC7 star.
This is considered to be due to a combination of:
(i) interaction effects involving the collision of the two
stellar winds, i.e., turbulence with a large velocity dispersion in
the wind-wind collision zone;
(ii) the possibility of an orbital-plane enhanced WC7 stellar
wind velocity;
(iii) possible common-envelope acceleration by the combined WC
and O stellar radiation fields; and/or
(iv) possible enhanced radiatively driven mass loss due to tidal
stresses, focused along the orbiting line of centers.
Acknowledgements
Our thanks go to Wilhelm Seggewiss for his constructive and helpful
referee report.
We thank Michael Corcoran, Marten van Kerkwijk, Bob Koch, Gloria
Koenigsberger, Andy Pollock and Ian Stevens for valuable critical comments
on an earlier version of the manuscript. DYASG gratefully acknowledges
financial support from The Rotary Foundation, the University of Utrecht,
and the Leids Kerkhoven-Bosscha Fonds. LK is supported by a fellowship of
the Royal Academy of Sciences of the Netherlands.
-
Annuk, K. 1995,
in Wolf-Rayet Stars: Binaries, Colliding Winds, Evolution, ed. K. A. van der Hucht, & P. M. Williams (Dordrecht: Kluwer), Proc. IAU Symp., 163, 231
In the text
-
Arnal, E. M. 2001, AJ, 121, 413
In the text
NASA ADS
-
Auer, L. H., & Koenigsberger, G. 1994, ApJ, 436, 859
NASA ADS
-
Barker, P. K. 1984, AJ, 89, 899
In the text
NASA ADS
-
Bianchi, L., & Bohlin, R. C. 1984, A&A, 134, 31
In the text
NASA ADS
-
Brandi, E., Ferrer, O. E., & Sahade, J. 1989, ApJ, 340, 1091; Erratum: ApJ,
347, 561
In the text
NASA ADS
-
Cantó, J., Raga, A. C., & Wilkin, F. P. 1996, ApJ, 469, 729
In the text
NASA ADS
-
Cassatella, A., Altamore, A., González-Riestra, R., et al. 2000, A&AS, 141, 331
In the text
NASA ADS
-
Cherepashchuk, A. M. 1976, Pis'ma Astron. Zh. 2, 356 (= Sov. Astron. Lett.
2, 138)
In the text
NASA ADS
-
Conti, P. S. 1971, in
Wolf-Rayet and High-Temperature Stars, ed. M. K. V. Bappu, & J. Sahade
(Dordrecht: Reidel), Proc. IAU Symp., 49, 225
In the text
-
Conti, P. S., Roussel-Dupré, D., Massey, P., & Rensing, M. 1984, ApJ, 282, 693
In the text
NASA ADS
-
Conti, P. S., & Massey, P. 1989, ApJ, 337, 251
In the text
NASA ADS
-
Corcoran, M. F., Ishibashi, K., Swank, J. H., & Petre, R. 2001, ApJ, 547, 1034
In the text
NASA ADS
-
Eenens, P. R. J., & Williams, P. M. 1994, MNRAS, 269, 1082
In the text
NASA ADS
-
Eichler, D., & Usov, V. 1993, ApJ, 402, 271
In the text
NASA ADS
-
Fitzpatrick, E. L., Savage, B. D., & Sitko, M. L. 1982, ApJ, 256, 578
In the text
NASA ADS
-
Fleming, W. P. 1889, Astron. Nachr., 122, 159
In the text
-
Florkowski, D. R., & Gottesman, S. T. 1977, MNRAS, 179, 105
In the text
NASA ADS
-
Fullerton, A. W., Gies, D. R., & Bolton, C. T. 1996, ApJS, 103, 475
In the text
NASA ADS
-
Gayley, K. G. 2001,
in Interacting Winds from Massive
Stars, ed. A. F. J. Moffat, & N. St-Louis, Proc. Int. Workshop, Les Îles-de-la-Madeleine (Québec, Canada), 10-14 July 2000, ASP-CS, in press
In the text
-
Gies, D. R., Barry, D. J., Bagnuolo, W. G., Sowers, J., & Thaller, M. L. 1996,
ApJ, 469, 884
In the text
NASA ADS
-
Hackwell, J. A., Gehrz, R. D., Smith, J. R., & Strecker, D. W. 1976, ApJ, 210, 137
In the text
NASA ADS
-
Henrichs, H. F., Kaper, L., & Nichols, J. S. 1994, A&A, 285, 565
NASA ADS
-
Hill, G. M., Moffat, A. F. J., St. Louis, N., & Bartzakos, P. 2000, MNRAS, 318, 402
In the text
NASA ADS
-
Howarth, I. D., Murray, J., Mills, D., & Berry, D. S. 1996, Starlink User Note 50.21
In the text
-
van der Hucht, K. A., Conti, P. S., Lundström, I., & Stenholm, B. 1981, SSR, 28, 227
In the text
-
van der Hucht, K. A. 1992, A&A, 4, 123
In the text
-
van der Hucht, K. A. 2001, New Astron. Rev., 45, 135
In the text
NASA ADS
-
Kaper, L., Henrichs, H. F., Nichols, J. S., et al. 1996, A&AS, 116, 257
In the text
NASA ADS
-
Koenigsberger, G., & Auer, L. H. 1985, ApJ, 297, 255
In the text
NASA ADS
-
Koenigsberger, G., Georgiev, L., Barbá, R., et al. 2000, ApJ, 542, 428
In the text
NASA ADS
-
Koenigsberger, G., Moreno, E., & Cervantes, F. 2001,
in Interacting Winds from Massive
Stars, ed. A. F. J. Moffat, & N. St-Louis, Proc. Int. Workshop, Les Îles-de-la-Madeleine (Québec, Canada) 10-14 July 2000, ASP-CS, in press
In the text
-
Lamontagne, R., Moffat, A. F. J., & Seggewiss, W. 1984, ApJ, 277, 258
In the text
NASA ADS
-
Lührs, S. 1997, PASP, 109, 504
In the text
NASA ADS
-
McDonald, J. K. 1947, Pub. Dom. Ap. Obs. Victoria, 7, 311
In the text
NASA ADS
-
Moffat, A. F. J., & Shara, M. M. 1986, AJ, 92, 952
In the text
NASA ADS
-
Panov, K. P., Altmann, M., & Seggewiss, W. 2000, A&A, 355, 607
In the text
NASA ADS
-
Pollock, A. M. T. 1987, A&A, 171, 135
NASA ADS
-
Prinja, R. K., Barlow, M. J., & Howarth, I. D. 1990, ApJ, 361, 607;
Erratum: 1991, ApJ, 383, 466
In the text
-
Prinja, R. K. 1994, A&A, 289, 221
NASA ADS
-
Rees, P., Giddings, J. R., & Clayton, M. 1996a, STARLINK Miscellaneous
User Document 45.1
In the text
-
Rees, P., Giddings, J. R., Mills, D., & Clayton, M. 1996b, STARLINK Guide
3.5
In the text
-
Schumann, J. D., & Seggewiss, W. 1975,
in Variable Stars and Stellar Evolution,
ed. V. E. Sherwood, & L. Plaut (Dordrecht: Reidel), Proc. IAU Symp., 67, 299
In the text
-
Schweickhardt, J., Schmutz, W., Kaufer, A., Stahl, O., & Wolf, B. 1999,
in Wolf-Rayet Phenomena in Massive Stars and Starburst Galaxies,
ed. K.A. van der Hucht, G. Koenigsberger, & P. R. J. Eenens (San Francisco: ASP), Proc. IAU Symp., 193, 98
In the text
-
Setia Gunawan, D. Y. A., van der Hucht, K. A., Williams, P. M., et al. 1995a,
in Wolf-Rayet Stars: Binaries, Colliding Winds, Evolution,
ed. K. A. van der Hucht, & P. M. Williams (Dordrecht: Kluwer), Proc. IAU Symp., 163, 466
In the text
-
Setia Gunawan, D. Y. A., van der Hucht, K. A., Stickland, D. J.,
et al. 1995b,
in Wolf-Rayet Stars: Binaries, Colliding Winds, Evolution,
ed. K. A. van der Hucht, & P. M. Williams (Dordrecht: Kluwer), Proc. IAU Symp., 163, 508
In the text
-
Shore, S. N., & Brown, D. N. 1988, ApJ, 334, 1021
In the text
NASA ADS
-
Smith, L. F., Shara, M. M., & Moffat, A. F. J. 1990, ApJ, 358, 229
In the text
NASA ADS
-
Stickland, D. J., & Lloyd, C. 1990, Observatory, 110, 1
In the text
NASA ADS
-
St-Louis, N., Willis, A. J., & Stevens, I. R. 1993, ApJ, 415, 298
In the text
NASA ADS
-
Torres, A. V., Conti, P. S., & Massey, P. 1986, ApJ, 300, 379
In the text
NASA ADS
-
Vacca, W. D., Garmany, C. D., & Shull, M. J. 1996, ApJ, 460, 914
In the text
NASA ADS
-
Veen, P. M., van Genderen, A. M., van der Hucht, K. A., et al. 1998, A&A, 329, 199
In the text
NASA ADS
-
Walborn, N. R., Nichols-Bohlin, J., & Panek, R. J. 1985, NASA RP-1155
In the text
-
White, R. L., & Becker, R. H. 1995, ApJ, 451, 352
In the text
NASA ADS
-
Williams, P. M., van der Hucht, K. A., van der Woerd, H.,
et al. 1987,
in Instabilities in Luminous Early Type Stars,
ed. H. Lamers, & C. W. H. de Loore, Proc. Symp. in honour of C. de Jager (Dordrecht: Reidel), 221
In the text
-
Williams, P. M., van der Hucht, K. A., Pollock, A. M. T., et al. 1990, MNRAS, 243, 662 (Paper I)
In the text
NASA ADS
-
Williams, P. M., van der Hucht, K. A., & Spoelstra, T. A. Th. 1994,
A&A, 291, 805 (Paper II)
In the text
NASA ADS
-
Williams, P. M. 1995,
in Wolf-Rayet Stars: Binaries, Colliding Winds, Evolution,
ed. K. A. van der Hucht, & P. M. Williams (Dordrecht: Kluwer), Proc. IAU Symp., 163, 335
In the text
-
Williams, P. M. 2001,
in Interacting Winds from Massive
Stars, ed. A. F. J. Moffat, & N. St-Louis, Proc. Int. Workshop, Les Îles-de-la-Madeleine (Québec,
Canada) 10-14 July 2000, ASP-CS, in press
In the text
-
Williams, P. M., Kidger, M. R., van der Hucht, K. A., et al. 2001, MNRAS, 324, 156
In the text
NASA ADS
-
Willis, A. J., & Wilson, R. 1976, A&A, 47, 429
In the text
NASA ADS
-
Willis, A. J., van der Hucht, K. A., Conti, P. S., & Garmany, C. D. 1986, A&AS, 63, 417
In the text
NASA ADS
-
Zhekov, S. A., & Skinner, S. L. 2000, ApJ, 538, 808
In the text
NASA ADS
Copyright ESO 2001
![\begin{figure}
\par\includegraphics[angle=90,width=8.5cm,clip]{140fig01.ps}
\end{figure}](/articles/aa/full/2001/35/aah2722/img36.gif)
![\begin{figure}
\par\includegraphics[width=8.4cm,clip]{140fig02.ps}
\end{figure}](/articles/aa/full/2001/35/aah2722/img37.gif)
![\begin{figure}
\par\includegraphics[angle=90,width=7.9cm,clip]{140fig03.ps}
\end{figure}](/articles/aa/full/2001/35/aah2722/img63.gif)
![\begin{displaymath}\begin{footnotesize}
\begin{tabular}{l l l \vert r@{$\,\pm\,$...
...0.5 & 0.4 \\ [1mm]
\hline\hline
\end{tabular}\end{footnotesize}\end{displaymath}](/articles/aa/full/2001/35/aah2722/img69.gif)
![\begin{figure}
\par\includegraphics[width=8.8cm,clip]{140fig04.ps}
\end{figure}](/articles/aa/full/2001/35/aah2722/img77.gif)
![\begin{figure}
\par\includegraphics[width=8.5cm,clip]{140fig05.ps} %\end{figure}](/articles/aa/full/2001/35/aah2722/img78.gif)
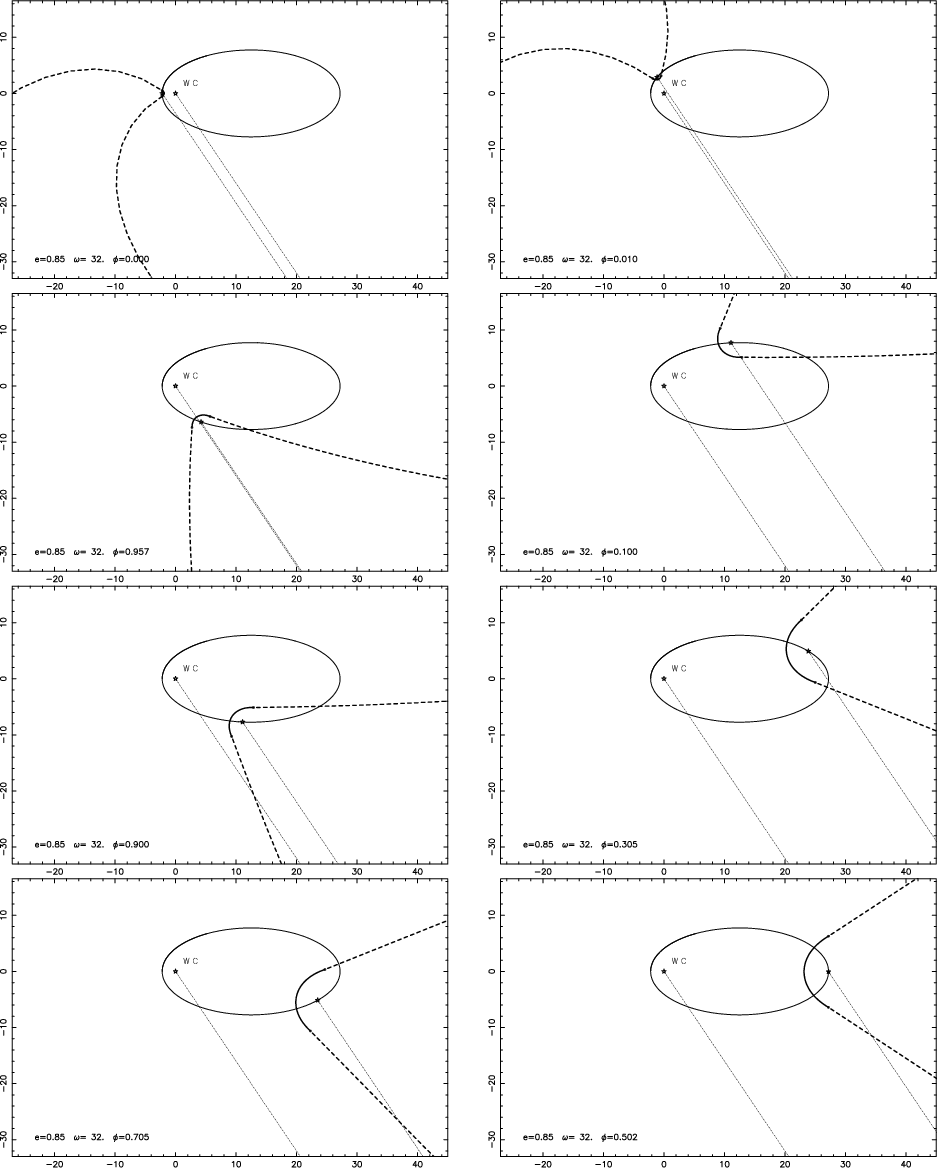
![\begin{figure}
\par\includegraphics[angle=90,width=7cm,clip]{140fig07.ps}
\end{figure}](/articles/aa/full/2001/35/aah2722/img96.gif)
![\begin{figure}
\par\includegraphics[width=7cm,clip]{140fig08r.eps}
\end{figure}](/articles/aa/full/2001/35/aah2722/img100.gif)
![\begin{figure}
\par\includegraphics[width=7cm,clip]{140fig09r.eps}
\end{figure}](/articles/aa/full/2001/35/aah2722/img101.gif)
![\begin{figure}
\par\includegraphics[width=7cm,clip]{140fig10r.eps}
\end{figure}](/articles/aa/full/2001/35/aah2722/img102.gif)