

Optical spectroscopic observations were made with the 1.9 m telescope at
the South African Astronomical Observatory (SAAO) on 1997 June 23, the
1.3 m telescope at Mount Skinakas (Crete, Greece) on 1999 July 27 and
2000 July 20-22 and the ESO 1.52-m telescope at La Silla Observatory, Chile on
2000 September 13.
The spectrum at SAAO was taken with the ITS spectrograph +
SITe CCD + 1200 lines mm-1 (grating No 4) + 250  m slit. With this
set-up the dispersion was
m slit. With this
set-up the dispersion was
 Å/pixel and the wavelength coverage
4100-4900 Å. The f/7.7 Ritchey-Chretien telescope at Skinakas
observatory was equipped with a
Å/pixel and the wavelength coverage
4100-4900 Å. The f/7.7 Ritchey-Chretien telescope at Skinakas
observatory was equipped with a
 ISA SITe CCD + 1302 lines
mm-1 grating, giving a dispersion of
ISA SITe CCD + 1302 lines
mm-1 grating, giving a dispersion of  Å/pixel. In the 1999 July
spectrum the slit width was 320 m, whereas in the 2000 July
spectra it was 80 m. Finally the 1.52 m La Silla Observatory telescope was
equipped with the Boller and Chivens
spectrograph + #33 holographic grating and
the Loral 38 camera. This configuration gives a dispersion of
Å/pixel. In the 1999 July
spectrum the slit width was 320 m, whereas in the 2000 July
spectra it was 80 m. Finally the 1.52 m La Silla Observatory telescope was
equipped with the Boller and Chivens
spectrograph + #33 holographic grating and
the Loral 38 camera. This configuration gives a dispersion of
 Å/pixel (resolution of
 Å at
Å at
 Å).
Å).
Near-IR observations of LS 5039 were made with the United Kingdom Infrared
Telescope (UKIRT) on 1999 July 22-24, using the Cooled Grating Spectrometer
(CGS4). Observations between 1.5-2.2 microns were made
using the long focal length camera
plus the 150 line/mm grating, giving a velocity resolution of  km s-1.
Note that at this resolution the wavelength range of a single spectrum is
km s-1.
Note that at this resolution the wavelength range of a single spectrum is
 m - hence breaks in the spectra presented in Fig. 3
are due to slight missmatches in wavelength coverage between individual
spectra. Initial data reduction was carried out at the telescope using the
CGS4DR software (Puxley et al. 1992).
This removes bad pixels, debiases, flat-fields, linearity
corrects and interleaves oversampled
scan positions. The subsequent stages of data reduction,
comprising of sky subtraction, extraction, derippling and wavelength
calibration using observations of a CuAr lamp, were carried out using
the Starlink-supported package FIGARO. Removal of telluric
features was accomplished via the procedure described by Clark & Steele
(2000).
m - hence breaks in the spectra presented in Fig. 3
are due to slight missmatches in wavelength coverage between individual
spectra. Initial data reduction was carried out at the telescope using the
CGS4DR software (Puxley et al. 1992).
This removes bad pixels, debiases, flat-fields, linearity
corrects and interleaves oversampled
scan positions. The subsequent stages of data reduction,
comprising of sky subtraction, extraction, derippling and wavelength
calibration using observations of a CuAr lamp, were carried out using
the Starlink-supported package FIGARO. Removal of telluric
features was accomplished via the procedure described by Clark & Steele
(2000).
![\begin{figure}
\par\includegraphics[width=9cm,clip]{MS1418f1.eps}\end{figure}](/articles/aa/full/2001/35/aa1418/img15.gif) |
Figure 1: Blue end (4050-4950 Å) spectra of LS 5039 with line identifications indicated (Diffuse Interstellar bands=DIB). The comparison stars are the O6V((f)) and O7V((f)) standards from the digital atlas of Walborn & Fitzpatrick (1990; HD 101190 and 15 Mon respectively). |
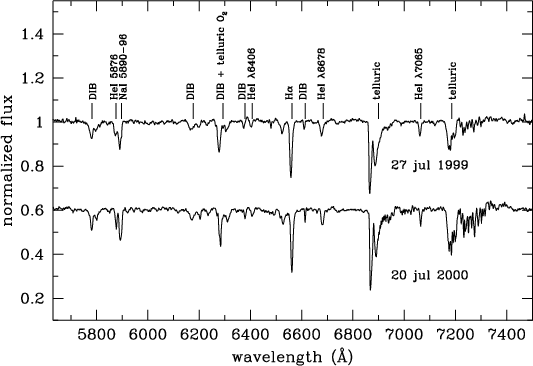 |
Figure 2: Red end (5650-7500 Å) spectrum of LS 5039. |
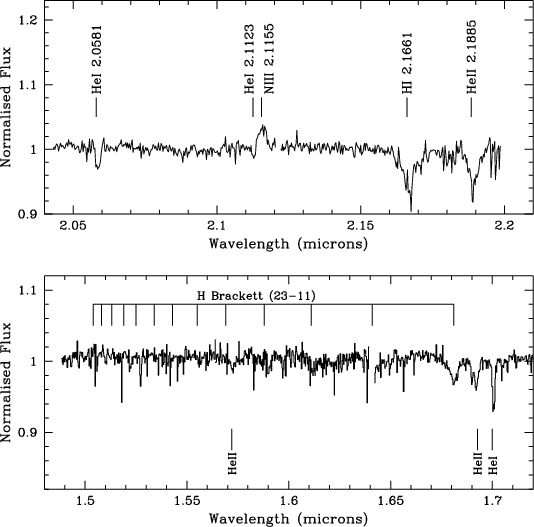 |
Figure 3:
Composite K band (2.05-2.20 m) and H band (1.49-1.72 m) spectra
of LS 5039; wavelength given in m. Note the break between the 2 spectra at 2.125 m in the K band
and at 1.64 m in the H band; unfortunately the latter break obscures the H I (12-4) 1.6412 m transition. |
The optical Balmer lines are in absorption, indicating the absence of a
dense circumstellar envelope around the star, and precluding an Oe/Be
classification. The red-end spectrum is characterised by the presence of
numerous interstellar lines (we derive reddening estimates from
these in Sect. 4) and neutral helium lines in absorption
( 5876, 6406, 6679 and 7065). The blue-end of the
optical spectrum is dominated by the hydrogen Balmer series and by strong
He II lines.
The ratio between He II 4541 and He I 4471
corresponds to a spectral type O6.5, according to the relations of Mathys
(1988). The fact that He II 4686 is strongly in absorption identifies
the star as main-sequence. This can be checked by direct comparison with MK
standards. As seen in Fig. 1, the strength of the He I and He II lines in
LS 5039 falls between those of the O6V((f)) and O7V((f)) standards.
Very weak N III 4634-40-42 emission is present. The
combination of strong He II absorption and weak N III
emission is represented by ((f)) - suggesting an O6.5V((f)) classification
- slightly earlier than the classification of M97,
made with a single low resolution 3800-4600 spectrum.
5876, 6406, 6679 and 7065). The blue-end of the
optical spectrum is dominated by the hydrogen Balmer series and by strong
He II lines.
The ratio between He II 4541 and He I 4471
corresponds to a spectral type O6.5, according to the relations of Mathys
(1988). The fact that He II 4686 is strongly in absorption identifies
the star as main-sequence. This can be checked by direct comparison with MK
standards. As seen in Fig. 1, the strength of the He I and He II lines in
LS 5039 falls between those of the O6V((f)) and O7V((f)) standards.
Very weak N III 4634-40-42 emission is present. The
combination of strong He II absorption and weak N III
emission is represented by ((f)) - suggesting an O6.5V((f)) classification
- slightly earlier than the classification of M97,
made with a single low resolution 3800-4600 spectrum.
| Line | EW (Å) | ||
| 1997 | 1999 | 2000 | |
H |
2.3 | 2.2 | |
| HeII 4200 |
0.50 | 0.55 | |
H |
2.4 | 2.4 | |
| HeI 4471 |
0.50 | 0.50 | |
| HeII 4541 |
0.92 | 0.90 | |
| HeII 4686 |
0.95 | 1.0 | |
H |
2.4 | 2.5 | |
| HeI 6406 |
0.24 | 0.26 | |
H |
3.6 | 3.9 | |
| HeI 6678 |
0.90 | 0.85 | |
| HeI 7065 |
0.50 | 0.55 | |
The spectral classification of hot, luminous stars via
near-IR spectroscopy alone is far less precise than via conventional optical
classification. Nevertheless, it provides an independent test of the
optical classification. The comprehensive spectral atlas of
Hanson et al. (1997) was used for classification of
the K band spectrum
of LS 5039. The strength of H I 2.166 m and He II
2.1885 m lines (Table 2) restrict the spectral type to later than O6,
and earlier than O8, while the He I
2.113 m absorption feature further constrains the spectral type to
earlier than O7.5. Finally,
the N III emission line is absent in normal Main Sequence O6-O8
spectra and confirms the O((f)) classification, fully consistent with the
optical classification.
Unfortunately, no such comprehensive reference work exists for the
classification of OB stars via the H band; we use the preliminary work
of Blum et al. (1997) and the more extensive work of Hanson et al.
(1998),
noting that this atlas is restricted to a narrow waveband (1.66-1.72 m)
and complete only for spectral types between O7-B9.
Comparison of the strengths of the H I brackett series to
the spectra presented by Blum et al. (1997) confirm an O star
classification, while the strength of the He II transition is
consistent with a spectral type of O8 or earlier (Hanson et al. 1998).
Direct comparison to the spectrum of the similar
O7V((f)) star HD 47839 presented in Hanson et al. (1998) shows the He II feature to be stronger for LS 5039,
while the H I Brackett 11 line is somewhat weaker.
However He I absorption is of comparable strength in both spectra.
In conclusion we find that both H and K band spectra are consistent
with the optical classification of LS 5039 as O6.5V((f)),
with the K band spectrum providing the
more rigorous constraints to spectral type (i.e. no earlier than O6.5 and no
later than O7) We note that we find no evidence for a
luminous stellar companion for LS 5039 in any of the spectra, nor any
additional emission features that might be attributed to emission from a jet
or accretion disc.
| Wavelength | Feature | EW |
| (microns) | (microns) | (Å) |
| 1.573 | He II 1.572 |
0.5 |
| 1.612 | H I 1.611 |
0.8 |
| 1.681 | H I 1.681 |
1.6 |
| 1.690 | ? | Blend |
| 1.692 | He II 1.693 |
1.4 |
| 1.701 | He I 1.701 |
1.1 |
| 2.059 | He I 2.058 |
0.5 |
| 2.113 | He I 2.113 |
0.1 |
| 2.116 | N III 2.116 |
-1.1 |
| 2.167 | H I 2.166 |
2.6 |
| 2.189 | He II 2.189 |
2.0 |
Copyright ESO 2001