

The Sr II resonance line  4215 and the subordinate line
4161 are used in this study to determine stellar Sr abundances. Both of
them are blended. Solar profiles of these lines are fitted to improve atomic
parameters of blending lines. Another kind of important atomic data is the
efficiency of hydrogen collisions in the Sr II kinetic equilibrium
calculations which is represented by a scaling factor
4215 and the subordinate line
4161 are used in this study to determine stellar Sr abundances. Both of
them are blended. Solar profiles of these lines are fitted to improve atomic
parameters of blending lines. Another kind of important atomic data is the
efficiency of hydrogen collisions in the Sr II kinetic equilibrium
calculations which is represented by a scaling factor  applied to Steenbock
& Holweger's (1984) version of Drawin's (1968, 1969) formula
for the computation of H atom collisional rates. As mentioned above, the lines
10327 and 10914 reveal strong NLTE effects, and they are
therefore most suitable to estimate this scaling factor from solar line profile
fitting.
applied to Steenbock
& Holweger's (1984) version of Drawin's (1968, 1969) formula
for the computation of H atom collisional rates. As mentioned above, the lines
10327 and 10914 reveal strong NLTE effects, and they are
therefore most suitable to estimate this scaling factor from solar line profile
fitting.
We use solar flux observations taken from the Kitt Peak Solar Atlas (Kurucz et al. 1984). Our synthetic flux profiles are convolved with a profile that
combines a rotational broadening of 1.8 kms-1 and broadening by macroturbulence
with a radial-tangential profile of
 kms-1 for the infrared lines,
 kms-1 for 4215 and
 kms-1 for 4161.
For the solar Sr abundance we accept the meteoritic value
kms-1 for 4161.
For the solar Sr abundance we accept the meteoritic value
 from
Grevesse et al. (1996). A depth-independent microturbulence of
0.8 kms-1 is adopted. For a calculation of van der Waals damping constants C6 we have
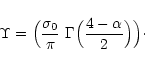
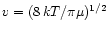
derived a formula based on Anstee & O'Mara's (1995) calculations,
where
from
Grevesse et al. (1996). A depth-independent microturbulence of
0.8 kms-1 is adopted. For a calculation of van der Waals damping constants C6 we have
derived a formula based on Anstee & O'Mara's (1995) calculations,
where

 and
and
 is the reduced mass;
  is a line-broadening cross-section and
 is a velocity parameter. The values of
and
are
tabulated in the papers of Anstee & O'Mara (1995), Barklem & O'Mara
(1997,2000), and Barklem et al. (1998). The C6-value
depends only slightly on temperature as
is a velocity parameter. The values of
and
are
tabulated in the papers of Anstee & O'Mara (1995), Barklem & O'Mara
(1997,2000), and Barklem et al. (1998). The C6-value
depends only slightly on temperature as
 .
At typical
values of
(between 0.2 and 0.4)
.
At typical
values of
(between 0.2 and 0.4)  changes by 0.04 at maximum
as one goes from T = 4000 K to T = 6000 K. Therefore the small variation of C6
across line formation layers can be neglected in calculations of line profiles,
and we use in this study depth-independent C6-values computed at T = 6000 K.
changes by 0.04 at maximum
as one goes from T = 4000 K to T = 6000 K. Therefore the small variation of C6
across line formation layers can be neglected in calculations of line profiles,
and we use in this study depth-independent C6-values computed at T = 6000 K.
 10327 and
10914. We use
10327 and
10914. We use  (10327) = -0.35 and
(10914) = -0.64 according to
Wiese & Martin (1980). The recent results of Guet & Johnson (1991)
and Brage et al. (1998) give similar values:
(10327)
= -0.30 and -0.34, respectively, and
(10914) = -0.59 and
-0.62. The C6-values for these lines (Table 3) have been computed
with
and
taken from Barklem & O'Mara (2000).
(10327) = -0.35 and
(10914) = -0.64 according to
Wiese & Martin (1980). The recent results of Guet & Johnson (1991)
and Brage et al. (1998) give similar values:
(10327)
= -0.30 and -0.34, respectively, and
(10914) = -0.59 and
-0.62. The C6-values for these lines (Table 3) have been computed
with
and
taken from Barklem & O'Mara (2000).
We compared different atomic models excluding and including H atom collisions
with cross-sections calculated according to Steenbock & Holweger (1984)
and scaled by various factors .
If hydrogen collisions are neglected we
obtain for both lines broader and deeper theoretical profiles compared with the
observed ones. Inclusion of these processes with = 0.1 makes the NLTE
profile shallower and narrower than the observed one. The best fits of both
lines are obtained at = 0.01. In Fig. 5 (bottom panel) we show one
of these lines, 10327. For comparison the LTE profile corresponding to
the same fitting parameters is presented, too. It is obvious that assuming LTE
we cannot fit the 10327 line profile with reasonable values of
 and
and
 ;
even the line wings are affected by NLTE effects.
;
even the line wings are affected by NLTE effects.
4215. The Sr II resonance lines are affected by
hyperfine structure (HFS). Strontium is represented by four stable isotopes. For
solar system matter the ratio of the even Sr isotopes to the odd ones
(
 +
+
 +
+
 ):
):
 is 93:7 according to
Cameron (1982). Isotopic shifts are very small (
is 93:7 according to
Cameron (1982). Isotopic shifts are very small (
 )
but the odd
isotopes have hyperfine splitting of their levels resulting in several HFS
components for a spectral line. We use the data on wavelengths and relative
intensities of HFS components given by McWilliam et al. (1995).
Oscillator strengths of separate components (Table 3) have been
calculated using solar Sr isotopic abundances and
)
but the odd
isotopes have hyperfine splitting of their levels resulting in several HFS
components for a spectral line. We use the data on wavelengths and relative
intensities of HFS components given by McWilliam et al. (1995).
Oscillator strengths of separate components (Table 3) have been
calculated using solar Sr isotopic abundances and
 from Wiese & Martin (1980). The most recent value
 of Brage et al. (1998) coincides with that
adopted in our study.
of Brage et al. (1998) coincides with that
adopted in our study.
![\begin{table}
\par
\includegraphics[width=14cm,clip]{tab.eps}\end{table}](/articles/aa/full/2001/34/aa1288/img128.gif) |
The Sr II 4215.539 Å line is blended by the strong Fe I 4215.426 Å line and by a
few CN molecular lines in the
far blue and red line wings. We treat Fe I 4215 with the fixed
values of
 and
and
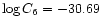 .
The last value was
calculated using the above formula. For the Sun
.
The last value was
calculated using the above formula. For the Sun
 = 7.51 was adopted.
Oscillator strengths of the CN molecular lines were fitted to reproduce the
observed blend profile.
= 7.51 was adopted.
Oscillator strengths of the CN molecular lines were fitted to reproduce the
observed blend profile.
Sr II 4215 is strongly affected by van der Waals damping. The
classical Unsöld (1955) formula gives
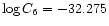 while the
formula above leads to
while the
formula above leads to
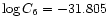 with
and
from
Barklem & O'Mara (2000). Varying
by only 0.1 has a
significant effect on the total energy absorbed in this line. A careful
analysis of the solar line profile makes possible a separation of collisional
broadening and blending effects. The best fit obtained with
with
and
from
Barklem & O'Mara (2000). Varying
by only 0.1 has a
significant effect on the total energy absorbed in this line. A careful
analysis of the solar line profile makes possible a separation of collisional
broadening and blending effects. The best fit obtained with
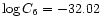 is presented in Fig. 5 (top panel). For comparison we give also the
pure Sr II 4215 NLTE profile calculated with the same
parameters.
is presented in Fig. 5 (top panel). For comparison we give also the
pure Sr II 4215 NLTE profile calculated with the same
parameters.
We did not succeed fitting the 4215 line core (Fig. 5)
because it is formed in the uppermost atmospheric layers above
 ,
and it is most probably influenced by a non-thermal and depth-dependent
chromospheric velocity field that is not part of our solar model.
,
and it is most probably influenced by a non-thermal and depth-dependent
chromospheric velocity field that is not part of our solar model.
4161. This line is located in the far red wing of two
strong blends, Fe I 4161.488 Å and Ti II
4161.534 Å. In addition, absorption in a few CN and SiH molecular
lines near 4161.8 Å lowers the continuum flux by about 5%. We have found
that
 given by Wiese & Martin (1980) does not allow to
reproduce the solar Sr II 4161 line with a fixed value of
= 2.92 and reasonable values of
.
The best fit
(Fig. 5, middle panel) is obtained with
given by Wiese & Martin (1980) does not allow to
reproduce the solar Sr II 4161 line with a fixed value of
= 2.92 and reasonable values of
.
The best fit
(Fig. 5, middle panel) is obtained with
 and
and
 .
The last value is larger by 0.1 compared with the classical
Unsöld (1955) constant.
.
The last value is larger by 0.1 compared with the classical
Unsöld (1955) constant.
As mentioned above both Sr II lines of interest are blended. To obtain a
good line profile fitting of the stellar spectra and, thus, to reduce Sr
abundances errors we use only the spectra observed at
 in 1998
to 2000. An exception refers to the four stars, HD45282, HD194598,
HD201891 and BD
in 1998
to 2000. An exception refers to the four stars, HD45282, HD194598,
HD201891 and BD 268, particularly important for our study. In
total, Sr abundances have been determined for 49 stars and for 36 of them from
both Sr II lines. The weaker 4161 line disappears at [Fe/H] <
-1. As an example, we give in Fig. 6 the Sr II
4215 line profiles for the three metal-poor stars and the Sr II
4161 line profile for one of them. The contribution of the Fe I
4215.426 Å line blend reduces rapidly with decreasing [Fe/H] because
the electron number density affects line strengths of minor species such as
Fe I much more than those of dominant ionization stages such as
Sr II. It can be seen in Fig. 6 (right column, bottom panel)
that for HD84937 the contribution of the Fe I 4215 line is
negligible. This holds also for the other 3 stars of our sample with [Fe/H] <
-1.9 and
268, particularly important for our study. In
total, Sr abundances have been determined for 49 stars and for 36 of them from
both Sr II lines. The weaker 4161 line disappears at [Fe/H] <
-1. As an example, we give in Fig. 6 the Sr II
4215 line profiles for the three metal-poor stars and the Sr II
4161 line profile for one of them. The contribution of the Fe I
4215.426 Å line blend reduces rapidly with decreasing [Fe/H] because
the electron number density affects line strengths of minor species such as
Fe I much more than those of dominant ionization stages such as
Sr II. It can be seen in Fig. 6 (right column, bottom panel)
that for HD84937 the contribution of the Fe I 4215 line is
negligible. This holds also for the other 3 stars of our sample with [Fe/H] <
-1.9 and
 6000 K.
NLTE effects for the Sr II lines are small for all the stars of our
sample: NLTE abundance corrections
 are negative for
4215 and positive for 4161 and do not exceed 0.07 dex and 0.05
dex, respectively, by absolute value. For 36 stars with both Sr II lines
investigated a difference of NLTE abundances derived from 4215 and
4161 is mainly within 0.08 dex with the mean value of 0.00
are negative for
4215 and positive for 4161 and do not exceed 0.07 dex and 0.05
dex, respectively, by absolute value. For 36 stars with both Sr II lines
investigated a difference of NLTE abundances derived from 4215 and
4161 is mainly within 0.08 dex with the mean value of 0.00  0.06
dex while the mean difference of LTE abundances is 0.05
0.06 dex.
0.06
dex while the mean difference of LTE abundances is 0.05
0.06 dex.
![\begin{figure}
\par\includegraphics[width=8.8cm,clip]{ms1288.f7}\end{figure}](/articles/aa/full/2001/34/aa1288/img140.gif) |
Figure 7: The run of [Sr/Fe] with [Fe/H]. Symbols are the same as in Fig. 1. |
In general, Sr abundances derived from the resonance line depend on the
even-to-odd Sr isotope ratio adopted in calculations. We concluded in Paper I
that Ba and Eu in halo and thick disk stars were mainly produced by r-process in
high-mass stars. Sr might be produced not only in the r-process but also in a
weak s-process that is related to high mass stars, too. According to Arlandini
et al. (1999) the r-process contributes only to the
isotope;
the consequence of a dominating r-process is therefore the disappearance of HFS
components in the Sr II lines. On the other hand the separation of HFS
components of the 4215 line is not large (35 mÅ at maximum, see
Table 3); Sr abundances derived from 4215 with and without
HFS thus differ by 0.07 dex at [Fe/H]  .
According to Beer et al.
(1992) the weak s-process produces much more even Sr isotopes than odd
ones: (
+
):
= 93:7, similarly to the
main s-process which defines the solar system even-to-odd Sr isotope ratio. The
ratio of the weak s- to r-process is estimated as 3:2 (Arlandini et al.
1999). Consequently, the use of a solar even-to-odd Sr isotope
ratio leads to an uncertainty of Sr abundances in halo and thick disk stars of
not more than 0.02-0.03 dex. We neglect such a small value and use the solar
even-to-odd Sr isotope ratio for all stars of our sample.
.
According to Beer et al.
(1992) the weak s-process produces much more even Sr isotopes than odd
ones: (
+
):
= 93:7, similarly to the
main s-process which defines the solar system even-to-odd Sr isotope ratio. The
ratio of the weak s- to r-process is estimated as 3:2 (Arlandini et al.
1999). Consequently, the use of a solar even-to-odd Sr isotope
ratio leads to an uncertainty of Sr abundances in halo and thick disk stars of
not more than 0.02-0.03 dex. We neglect such a small value and use the solar
even-to-odd Sr isotope ratio for all stars of our sample.
The final [Sr/Fe] are presented in Table 1 and Fig. 7.
Whenever both Sr II lines were available the average value was
calculated. It can be concluded from Fig. 7 that the general behaviour
of the [Sr/Fe] abundance ratios with respect to metallicity is similar to that
of [Ba/Fe] (Fig. 1, top panel). For the thin disk stars there is a
spread in [Sr/Fe] up to 0.3. Similarly to [Ba/Fe] this points to a correlation
of [Sr/Fe] with stellar age: for 12 stars older than 5 Gyr the mean value
![$\overline{\rm [Sr/Fe]} = -0.10$](/articles/aa/full/2001/34/aa1288/img142.gif) while for 7 stars younger than 5 Gyr
while for 7 stars younger than 5 Gyr
![$\overline{\rm [Sr/Fe]} = 0.04$](/articles/aa/full/2001/34/aa1288/img143.gif) .
The thick disk stars show a decline of [Sr/Fe]
with [Fe/H] increasing, so, that in "late'' thick disk stars ([Fe/H] > -0.5)
strontium is underabundant relative to iron by 0.1 dex, and this value coincides
with the Ba underabundance reported in Sect. 3 for the thick disk stars.
Underabundances of Sr relative to iron are typical for the halo stars which are
close together with a mean value of [Sr/Fe] = -0.10
0.02. The discrepant
result for BD
.
The thick disk stars show a decline of [Sr/Fe]
with [Fe/H] increasing, so, that in "late'' thick disk stars ([Fe/H] > -0.5)
strontium is underabundant relative to iron by 0.1 dex, and this value coincides
with the Ba underabundance reported in Sect. 3 for the thick disk stars.
Underabundances of Sr relative to iron are typical for the halo stars which are
close together with a mean value of [Sr/Fe] = -0.10
0.02. The discrepant
result for BD 2476 was dropped (see Sect. 6 for further discussion of
this star).
2476 was dropped (see Sect. 6 for further discussion of
this star).
The thick disk star, BD 2245 ([Fe/H] = -1.13), reveals a Sr
overabundance relative to iron similar to that found for Ba (Sect. 3). There is
no HIPPARCOS parallax for this star and the uncertainty of stellar
parameters could explain apparent peculiar abundances of Sr and Ba. Another
explanation would be that this star was the secondary component of a binary,
and that we observe accreted s-process products formed in the evolved primary
component.
2245 ([Fe/H] = -1.13), reveals a Sr
overabundance relative to iron similar to that found for Ba (Sect. 3). There is
no HIPPARCOS parallax for this star and the uncertainty of stellar
parameters could explain apparent peculiar abundances of Sr and Ba. Another
explanation would be that this star was the secondary component of a binary,
and that we observe accreted s-process products formed in the evolved primary
component.
There are only a few Sr abundance studies of cool stars in the literature.
For the sample of 16 stars including dwarfs, giants and supergiants Gratton &
Sneden (1994) have found small Sr excess in the metallicity
range from -0.9 down to -2.8 with the mean value [Sr/Fe] = 0.07
0.11 (10 stars) and
slight underabundance of Sr relative to Fe up to 0.15 dex for 6 stars with
[Fe/H] > -0.6. These data are based on the examination of equivalent widths of
the Sr II 4161 line, and the authors note that the [Sr/Fe]
ratios given by the Sr II resonance line at 4215 Å are smaller by 0.21
0.04 dex. The mean ratio [Sr/Fe] = -0.14 deduced from 4215 line
for the halo stars is in agreement with that found in the present study. At
[Fe/H] < -1 the Sr II subordinate line is rather weak, and in our
opinion Sr abundances based on the Sr II 4215 line are more
reliable than those derived from Sr II 4161. Using equivalent
widths of Sr II 4077 and 4215 for a sample of cool
dwarfs in the metallicity range similar to ours, Hartmann & Gehren (1988)
have obtained [Sr/Fe] abundance ratios close to solar, independent of the
general metal abundance. However, the large scatter of up to 0.5 dex masks any
features in the run [Sr/Fe] vs. [Fe/H]. Based on the Sr I 4607
line Jehin et al. (1999) have obtained [Sr/Fe] abundance ratios between
0 and -0.4 for a sample of 21 mildly metal-poor stars in the narrow metallicity
range from -0.8 down to -1.3. We note that using the LTE assumption may
result in an underestimate of element abundances derived from spectral lines of
minor species such as Sr I. Magain (1989) has studied only
metal-poor stars with [Fe/H] < -1.4 and obtained a Sr excess of about 0.4 dex
at [Fe/H] between -1.5 and -2.5 and a decline of the [Sr/Fe] abundance ratios
at lower metallicities, however, he notes that results for Sr should be
considered as preliminary due to the strength of the available lines
(Sr II 4077 and 4215) and the uncertainties affecting
the gf-values as well as the damping constants. In the range of overlapping
metallicities his data are different from ours. For extremely metal-poor stars
with [Fe/H] < -2.4 McWilliam et al. (1995) and Ryan et al.
(1996) have found a decline of the [Sr/Fe] abundance ratios with
decreasing metallicity and a spread in these ratios up to 2.5 dex. Elemental
abundances were determined from the Sr II 4077 and 4215
lines with the LTE assumption. It was noted in Sect. 4 that for extremely
metal-poor stars NLTE effects for the Sr II lines depend strongly on
stellar parameters. We give one example. For two stars of Ryan et al. sample,
BS16968-061 (
 = 6000 K,
  = 4, [Fe/H] = -3.08) and CS22186-005
(
= 6000 K, = 2, [Fe/H] = -2.77), we have computed NLTE
abundance corrections
= 0.25 dex and 0.60 dex, respectively.
Based on NLTE Sr abundances we obtain for these stars new values [Sr/Fe] =
-0.25 and -0.63 instead of -0.50 and -1.23 as determined by Ryan et al.
Therefore, the large spread in [Sr/Fe] ratios published by McWilliam et al.
(1995) and Ryan et al. (1996) may be at least in part due to
neglecting NLTE effects for the Sr II lines.
= 4, [Fe/H] = -3.08) and CS22186-005
(
= 6000 K, = 2, [Fe/H] = -2.77), we have computed NLTE
abundance corrections
= 0.25 dex and 0.60 dex, respectively.
Based on NLTE Sr abundances we obtain for these stars new values [Sr/Fe] =
-0.25 and -0.63 instead of -0.50 and -1.23 as determined by Ryan et al.
Therefore, the large spread in [Sr/Fe] ratios published by McWilliam et al.
(1995) and Ryan et al. (1996) may be at least in part due to
neglecting NLTE effects for the Sr II lines.
![\begin{figure}
\par\includegraphics[width=8.7cm,clip]{ms1288.f81}\par\includegra...
...lip]{ms1288.f82}\par\includegraphics[width=8.7cm,clip]{ms1288.f83}
\end{figure}](/articles/aa/full/2001/34/aa1288/img144.gif) |
Figure 8: Variation of element abundance ratios with [Fe/H]. Symbols are the same as in Fig. 1. Dotted lines in the top panel limit the range of the [Eu/Ba]r ratio uncertainty. |
Copyright ESO 2001
![\begin{figure}
\par\mbox{
\includegraphics[width=8.8cm,clip]{ms1288.f61}\include...
...]{ms1288.f63}\includegraphics[width=8.8cm,clip]{ms1288.f64} }
\par\end{figure}](/articles/aa/full/2001/34/aa1288/img132.gif)