![[*]](/icons/foot_motif.gif)
L. Mashonkina 1,2,3 - T. Gehren 2
1 - Department of Astronomy, Kazan State University, Kremlevskaya 18, Kazan 8,
420008, Russia
2 - Institut für Astronomie und Astrophysik der Universität
München, Scheinerstr. 1, 81679 München, Germany
3 - Max-Planck-Institut
für Astrophysik, Karl-Schwarzschild-Straße 1,
85740 Garching, Germany
Received 16 March 2001 / Accepted 4 July 2001
Abstract
We present revised strontium, barium and europium abundances for 63 cool stars
with metallicities [Fe/H] ranging from -2.20 to 0.25. The stellar sample has
been extracted from Fuhrmann's lists (1998, 2001). It is
confined to main-sequence and turnoff stars. The results are based on NLTE line
formation obtained in differential model atmosphere analyses of spectra that
have a typical S/N of 200 and a resolution of 40000 to 60000. The element
abundance ratios reveal a distinct chemical history of the halo and thick disk
compared with that of the thin disk. Europium is overabundant relative to iron
and barium in halo and thick disk stars suggesting that during the formation of
these galactic populations high-mass stars exploding as SNe II dominated
nucleosynthesis on a short time scale of the order of 1 Gyr. We note the
importance of [Eu/Mg] determinations for halo stars. Our analysis leads to the
preliminary conclusion that Eu/Mg ratios found in halo stars do not support
current theoretical models of the r-process based on low-mass SNe; instead they
seem to point at a halo formation time much shorter than 1 Gyr. A steep decline
of [Eu/Fe] and a slight decline of [Eu/Ba] with increasing metallicity have been
first obtained for thick disk stars. This indicates the start of nucleosynthesis
in the lower mass stars, in SN I and AGB stars, which enriched the interstellar
gas with iron and the most abundant s-process elements. From a decrease of the
Eu/Ba ratio by 
 dex the time interval corresponding to
the thick disk formation phase can be estimated. The step-like change of element
abundance ratios at the thick to thin disk transition found in our previous
analysis (Mashonkina & Gehren 2000) is confirmed in this study: [Eu/Ba]
and [Eu/Fe] are reduced by 0.25 dex and 0.15 dex, respectively;
[Ba/Fe] increases by 0.1 dex. This is indicative of an intermediate phase
before the early stage of the thin disk developed, during which only evolved
middle and low mass (<
dex the time interval corresponding to
the thick disk formation phase can be estimated. The step-like change of element
abundance ratios at the thick to thin disk transition found in our previous
analysis (Mashonkina & Gehren 2000) is confirmed in this study: [Eu/Ba]
and [Eu/Fe] are reduced by 0.25 dex and 0.15 dex, respectively;
[Ba/Fe] increases by 0.1 dex. This is indicative of an intermediate phase
before the early stage of the thin disk developed, during which only evolved
middle and low mass (< )
stars contributed to nucleosynthesis. Our
data provide an independent method to calculate the duration of this phase. The
main s-process becomes dominant in the production of heavy elements beyond the
iron group during the thin disk evolution. We find that in the thin disk stars
Ba/Fe ratios increase with time from
)
stars contributed to nucleosynthesis. Our
data provide an independent method to calculate the duration of this phase. The
main s-process becomes dominant in the production of heavy elements beyond the
iron group during the thin disk evolution. We find that in the thin disk stars
Ba/Fe ratios increase with time from
![$\rm [Ba/Fe] = -0.06$](/articles/aa/full/2001/34/aa1288/img8.gif) in stars older than 8 Gyr
to
in stars older than 8 Gyr
to
![$\rm [Ba/Fe] = 0.06$](/articles/aa/full/2001/34/aa1288/img9.gif) in stars that are between 2 and 4 Gyr old.
in stars that are between 2 and 4 Gyr old.
Key words: line: formation - nuclear reactions, nucleosynthesis, abundances - stars: abundances - stars: late-type - Galaxy: evolution
Observations of heavy elements beyond the iron group in cool dwarf stars give
useful information about nucleosynthesis in the Galaxy and also for some
important parameters of the evolution of the Galaxy: initial mass function
(IMF), star formation rate (SFR), and a timescale for the formation of Galactic
stellar populations. Abundances of these elements in the solar system have
contributions in differing proportions from two processes, the s- and r-process
of neutron capture. In turn, the overall s-process abundance pattern is best
fitted by a combination of two s-process components: the main s-process
which occurs during the thermally pulsing asymptotic giant branch (AGB) phase of
low-mass stars (
 ), and which dominates the s-process contribution
to Rb and heavier elements; and the weak s-process which is thought to run
in the cores of massive stars,
), and which dominates the s-process contribution
to Rb and heavier elements; and the weak s-process which is thought to run
in the cores of massive stars,
 ,
and which corresponds to
the lighter elements with
,
and which corresponds to
the lighter elements with  (Käppeler et al. 1989). The
r-process is associated with explosive conditions in SNe II. Progenitors of
SN II have much shorter lifetimes compared with those of AGB stars, and there
must be a delay in the onset of the main s-process nucleosynthesis compared with
the production of r-nuclei. The europium to barium abundance ratio is
particularly sensitive to whether nucleosynthesis of the heavy elements occured
in the s- or r-process. For the solar system matter
(Käppeler et al. 1989). The
r-process is associated with explosive conditions in SNe II. Progenitors of
SN II have much shorter lifetimes compared with those of AGB stars, and there
must be a delay in the onset of the main s-process nucleosynthesis compared with
the production of r-nuclei. The europium to barium abundance ratio is
particularly sensitive to whether nucleosynthesis of the heavy elements occured
in the s- or r-process. For the solar system matter
 (Grevesse et al. 1996). The contributions of the
s- and r-process to the solar Ba abundance consist of 81% and 19% according to
the most recent data of Arlandini et al. (1999), whereas 94% of the
solar europium originated from the r-process. Thus, the solar abundance ratio of
Eu to Ba contributed by the r-process relative to the total abundances,
[Eu/Ba]r equals 0.70. The oldest stars of the Galaxy are expected to carry
a significant Eu overabundance of about 0.7 dex relative to barium, provided
that the r-process in early Galaxy was similar to solar one. A clear break in
the run of [Eu/Ba] ratios with overall metallicity should signal the onset of
the contribution to barium by AGB stars, and the location of this break provides
an independent estimate for the timescale of star formation during the early
stages of Galactic evolution.
(Grevesse et al. 1996). The contributions of the
s- and r-process to the solar Ba abundance consist of 81% and 19% according to
the most recent data of Arlandini et al. (1999), whereas 94% of the
solar europium originated from the r-process. Thus, the solar abundance ratio of
Eu to Ba contributed by the r-process relative to the total abundances,
[Eu/Ba]r equals 0.70. The oldest stars of the Galaxy are expected to carry
a significant Eu overabundance of about 0.7 dex relative to barium, provided
that the r-process in early Galaxy was similar to solar one. A clear break in
the run of [Eu/Ba] ratios with overall metallicity should signal the onset of
the contribution to barium by AGB stars, and the location of this break provides
an independent estimate for the timescale of star formation during the early
stages of Galactic evolution.
In our previous analysis (Mashonkina & Gehren 2000, thereafter Paper I)
we have already presented Ba and Eu abundances in cool dwarf stars. An important
advantage of that study was provided by taking into account the membership of
individual stars in particular stellar populations of the Galaxy. The existence
of the dynamically hot and metal-poor halo stellar population and the
dynamically cool and metal-rich disk population was outlined by Eggen et
al. (1962) on the base of dynamical and chemical data. This conclusion
was supported by many of the later observational results. Gilmore & Reid
(1983) offered the first evidence for the existence of another
Galactic stellar population, the thick disk. The properties of the thick
disk place it between those of the halo and the thin disk, and the key question
is whether it is related to either of them in terms of the Galaxy's chemical and
dynamical evolution. Gratton et al. (1996) were the first to
directly compare the [Fe/O] abundance ratios of 15 thick disk stars with halo
and thin disk populations. Their results reveal a nearly constant ratio in both
halo and thick disk, and an increase of [Fe/O] by 0.2 dex during the
transition from the thick to the thin disk population, indicating a sudden
decrease in star formation in the solar neighbourhood at that epoch. New,
clear evidence of chemical distinction of the thick from thin disk was given in
the study of Fuhrmann (1998). For a sample of 50 stars he found a clear
separation of the [Mg/Fe] ratios between the two stellar populations and
inferred an intermediate phase of low or even ceased star formation before the
earliest stars of the thin disk were formed 9 Gyr ago.
Last year several studies appeared (Gratton et al. 2000;
Prochaska et al. 2000; Mashonkina & Gehren 2000; Bernkopf et al.
2001) which presented strong additional evidence for a distinct chemical
history of the thick and thin disk. From the [Fe/O] and [Fe/Mg]
ratios for the sample of about 300 stars Gratton et al. (2000) argue
that the halo and thick disk formation occured on a short timescale and that
there was a sudden decrease in star formation between the thick and thin disk
phases. The new study of the Munich astrophysicists (Bernkopf et al. 2001) for
an extended sample of (100) stars improves the statistical significance
of the earlier conclusions of Fuhrmann (1998). For a sample of 10 thick
disk stars Prochaska et al. (2000)
have determined abundances of several  elements, O, Mg, Si and Ca, light
elements, Na and Al, iron peak elements and heavy elements, Y, Ba and Eu. From
comparison of their results with abundance studies of the halo, bulge, and thin
disk taken from the literature they conclude that in the majority of cases the
thick disk stars exhibit X/Fe ratios distinct from the thin disk. To derive Eu
abundances they used the very weak Eu II subordinate line
elements, O, Mg, Si and Ca, light
elements, Na and Al, iron peak elements and heavy elements, Y, Ba and Eu. From
comparison of their results with abundance studies of the halo, bulge, and thin
disk taken from the literature they conclude that in the majority of cases the
thick disk stars exhibit X/Fe ratios distinct from the thin disk. To derive Eu
abundances they used the very weak Eu II subordinate line  6645
and obtained results only for 4 stars. For these stars they found an
overabundance of Eu relative to Ba indicating a dominance of the r-process in
heavy element production.
6645
and obtained results only for 4 stars. For these stars they found an
overabundance of Eu relative to Ba indicating a dominance of the r-process in
heavy element production.
In Paper I we have determined the [Eu/Ba] abundance ratios for a larger sample (15) of stars on the base of non-local thermodynamical equilibrium (NLTE) line formation for Ba II and Eu II and it was shown that
![$\rm [Eu/Ba] = 0.64$](/articles/aa/full/2001/34/aa1288/img15.gif) and 0.49,
respectively;
and 0.49,
respectively;
 ,
because halo and thick disk stars reveal an insignificant
contribution of the s-process to barium synthesis;
,
because halo and thick disk stars reveal an insignificant
contribution of the s-process to barium synthesis;
 ;
;
 - and r-process occur in a common site. What are the
progenitor masses of SNe II in which the r-process runs with the highest
efficiency? And what about similar values for -process? Our data on the
[Eu/Mg] abundance ratios in the two halo stars point to different sites of
r-process and -process nucleosynthesis.
- and r-process occur in a common site. What are the
progenitor masses of SNe II in which the r-process runs with the highest
efficiency? And what about similar values for -process? Our data on the
[Eu/Mg] abundance ratios in the two halo stars point to different sites of
r-process and -process nucleosynthesis.
Our work was, however, restricted to a rather small sample of only 15 stars with
Eu abundances and 29 stars with Ba abundances obtained. To improve the
significance of our earlier conclusions, we extend our analysis in this study to
a total of 63 stars. As in Paper I the stars are selected from Fuhrmann's
(1998,2001) lists. Fuhrmann's sample of cool nearby stars with
metallicities [Fe/H] from -2 to 0.25 includes only main sequence stars (MS)
or stars close to the MS with carefully derived stellar parameters
 ,
,
 ,
[Fe/H] and microturbulence
,
[Fe/H] and microturbulence
 and, thus, provides a reliable base
for element abundance determinations and the study of Galactic chemical
evolution. For all the stars added to our new sample, high-resolution spectra
observed at
and, thus, provides a reliable base
for element abundance determinations and the study of Galactic chemical
evolution. For all the stars added to our new sample, high-resolution spectra
observed at
 are used. We will show in the present analysis that
the basic results of Paper I are still valid and some new observational findings
constraining the models of Galaxy evolution become apparent. The most important
of them is a slight decline of the [Eu/Ba] abundance ratios with increasing
metallicity for the thick disk stars, which can be used to calculate the
duration of star formation in the thick disk stellar population.
are used. We will show in the present analysis that
the basic results of Paper I are still valid and some new observational findings
constraining the models of Galaxy evolution become apparent. The most important
of them is a slight decline of the [Eu/Ba] abundance ratios with increasing
metallicity for the thick disk stars, which can be used to calculate the
duration of star formation in the thick disk stellar population.
In addition to barium and europium, strontium abundances are determined in this
study. The most abundant Sr isotopes,
 ,
,
 and
and
 ,
have masses that lie on the boundary between nuclei produced by
the weak and main s-process. Based on calculations of stellar models
for 1.5 and 3
AGB stars Arlandini et al. (1999) have found
an 85% contribution of the main s-process to solar strontium. The contribution of
the weak component can only be estimated: using a classical approach Arlandini
et al. obtain 6%, and for the main component 90%; the remaining 4%
correspond to residuals of the r-process. In fact, the uncertainty of r-process
and weak s-process contributions may be a factor of 2 or even larger. Keeping in
mind that s-nuclei of Ba are produced only by the main s-process which is
described much better compared with the weak component we can use the
strontium-to-barium abundance ratio as a useful diagnostic of the type of
s-process that formed Sr. Strontium is more abundant than barium and the
Sr II resonance lines 4077 Å and 4215 Å can be
detected even in extremely metal-poor stars. However, both lines are strongly
blended and element abundances must be derived using synthetic spectra. The
study of Gratton & Sneden (1994) is based on synthetic spectra of
only the Sr II 4215 line, but in most investigations (Hartmann
& Gehren 1988; Magain 1989; McWilliam et al. 1995; Ryan et
al. 1996) Sr abundances are based on equivalent widths (
,
have masses that lie on the boundary between nuclei produced by
the weak and main s-process. Based on calculations of stellar models
for 1.5 and 3
AGB stars Arlandini et al. (1999) have found
an 85% contribution of the main s-process to solar strontium. The contribution of
the weak component can only be estimated: using a classical approach Arlandini
et al. obtain 6%, and for the main component 90%; the remaining 4%
correspond to residuals of the r-process. In fact, the uncertainty of r-process
and weak s-process contributions may be a factor of 2 or even larger. Keeping in
mind that s-nuclei of Ba are produced only by the main s-process which is
described much better compared with the weak component we can use the
strontium-to-barium abundance ratio as a useful diagnostic of the type of
s-process that formed Sr. Strontium is more abundant than barium and the
Sr II resonance lines 4077 Å and 4215 Å can be
detected even in extremely metal-poor stars. However, both lines are strongly
blended and element abundances must be derived using synthetic spectra. The
study of Gratton & Sneden (1994) is based on synthetic spectra of
only the Sr II 4215 line, but in most investigations (Hartmann
& Gehren 1988; Magain 1989; McWilliam et al. 1995; Ryan et
al. 1996) Sr abundances are based on equivalent widths ( )
of
the Sr II lines. Other investigations use the weaker Sr I
resonance line 4607 (Gratton & Sneden 1994; Jehin et al.
1999). However, in the case of minor species such as Sr I some
uncertainties of elemental abundances are expected due to using the LTE
assumption. Therefore the observational situation with Sr abundances in cool
stars is not clear. In this study we obtain strontium abundances from the
Sr II lines on the basis of NLTE line formation using synthetic spectra.
NLTE effects for Sr II in cool metal-poor stars are considered for the
first time. We use in this study the method of NLTE calculations for
Sr II developed by Belyakova & Mashonkina (1997).
)
of
the Sr II lines. Other investigations use the weaker Sr I
resonance line 4607 (Gratton & Sneden 1994; Jehin et al.
1999). However, in the case of minor species such as Sr I some
uncertainties of elemental abundances are expected due to using the LTE
assumption. Therefore the observational situation with Sr abundances in cool
stars is not clear. In this study we obtain strontium abundances from the
Sr II lines on the basis of NLTE line formation using synthetic spectra.
NLTE effects for Sr II in cool metal-poor stars are considered for the
first time. We use in this study the method of NLTE calculations for
Sr II developed by Belyakova & Mashonkina (1997).
The remaining paper is organized as follows. Observations and stellar parameters are described in Sect. 2. NLTE barium and europium abundances obtained using the methods described in Paper I are discussed in Sect. 3. In Sect. 4 we describe the Sr II model atom and NLTE effects for Sr II. In the next section solar Sr II line profiles are fitted to empirically improve three types of atomic parameters important for further analyses of stellar spectra: the efficiency of collisions with hydrogen atoms in Sr II kinetic equilibrium, van der Waals damping constants of the Sr II lines and oscillator strengths of line blends. Stellar strontium NLTE abundances are presented at the end of this section. In the final section we discuss the element abundance ratios and implications for nucleosynthesis and the evolution of the Galaxy.
Our results are based on spectra observed mostly by Klaus Fuhrmann and in part
by Andreas Korn and the late Michael Pfeiffer using the fiber optic Cassegrain
échelle spectrograph FOCES fed by the 2.2 m telescope at the Calar Alto
observatory during 10 observing runs in 1995-2000. The data cover an
approximate spectral range of 4000-7000 Å. In total, our sample now includes
63 stars: 27 stars from our previous work (Paper I), 24 stars newly observed in
January and May 2000, and 12 thin disk stars observed earlier and added to cover
as best as possible the metallicity range of the thin disk. Table 1
lists all the new stars plus 19 stars from Paper I for which Sr abundances were
determined. Almost all of the stars were observed at least twice. For the 1995
spectra (11 stars of our old sample) the resolving power was  and
the later spectra of 52 stars were observed at
and
the later spectra of 52 stars were observed at
 .
The signal-to-noise ratio is 200 in the spectral range where the
Ba II
.
The signal-to-noise ratio is 200 in the spectral range where the
Ba II
 ,
,
 and
and
 lines are located
and 100 in the range of the Eu II 4129 and Sr II
4161, 4215 lines.
lines are located
and 100 in the range of the Eu II 4129 and Sr II
4161, 4215 lines.
We use spectra reduced according to the description given in Pfeiffer et al.
(1998). Stellar element abundances are derived from line profile fitting
and the instrumental profile is found from comparison of FOCES Moon spectra with
the Kitt Peak Solar Flux Atlas (Kurucz et al. 1984). Observations are
well fitted by a Gaussian of different values for different observing runs (i.e.
from 3.2 kms-1 to 5 kms-1).
| HD/BD |
|
|
|
[Fe/H] | [Ba/Fe] | [Eu/Fe] | [Sr/Fe] |
| 3795 | 5370 | 3.82 | 1.0 | -0.64 | 0.02 | 0.56 | 0.04 |
| 4614 | 5940 | 4.33 | 1.0 | -0.30 | 0.03 | 0.11 | 0.00 |
| 10519 | 5710 | 4.00 | 1.1 | -0.64 | -0.05 | 0.38 | 0.06 |
| 10697 | 5610 | 3.96 | 1.0 | 0.10 | -0.01 | -0.08 | -0.17 |
| 18757 | 5710 | 4.34 | 1.0 | -0.28 | -0.11 | 0.25 | -0.12 |
| 19445 | 6060 | 4.44 | 1.4 | -1.99 | -0.13 | - | -0.13 |
| 22879 | 5870 | 4.27 | 1.2 | -0.86 | -0.02 | 0.42 | 0.07 |
| 30649 | 5820 | 4.28 | 1.2 | -0.47 | -0.10 | 0.32 | -0.10 |
| 30743 | 6300 | 4.03 | 1.6 | -0.45 | -0.02 | 0.13 | - |
| 37124 | 5610 | 4.44 | 0.9 | -0.44 | -0.12 | 0.30 | -0.11 |
| 43042 | 6440 | 4.23 | 1.5 | 0.04 | 0.00 | -0.02 | 0.10 |
| 45282 | 5280 | 3.12 | 1.4 | -1.52 | -0.07 | 0.60 | -0.08 |
| 52711 | 5890 | 4.31 | 1.0 | -0.16 | 0.01 | 0.05 | -0.02 |
| 55575 | 5890 | 4.25 | 1.0 | -0.36 | -0.05 | 0.20 | -0.10 |
| 58855 | 6310 | 4.16 | 1.4 | -0.32 | 0.08 | - | - |
| 61421 | 6470 | 4.00 | 1.9 | -0.01 | -0.17 | 0.01 | 0.09 |
| 62301 | 5940 | 4.18 | 1.2 | -0.69 | -0.06 | 0.36 | -0.02 |
| 64606 | 5320 | 4.54 | 1.0 | -0.89 | -0.09 | 0.47 | -0.04 |
| 65583 | 5320 | 4.55 | 0.8 | -0.73 | -0.05 | 0.46 | 0.02 |
| 67228 | 5850 | 3.93 | 1.2 | 0.12 | -0.06 | -0.13 | -0.06 |
| 68017 | 5630 | 4.45 | 0.9 | -0.40 | -0.12 | 0.28 | -0.11 |
| 69611 | 5820 | 4.18 | 1.2 | -0.60 | -0.11 | 0.36 | 0.05 |
| 84937 | 6350 | 4.03 | 1.7 | -2.07 | 0.00 | - | -0.12 |
| 90508 | 5800 | 4.35 | 1.0 | -0.33 | -0.03 | 0.26 | -0.12 |
| 102158 | 5760 | 4.24 | 1.1 | -0.46 | -0.13 | 0.34 | -0.01 |
| 103095 | 5110 | 4.66 | 0.8 | -1.35 | 0.00 | 0.55 | -0.11 |
| 109358 | 5860 | 4.36 | 1.1 | -0.21 | -0.07 | - | - |
| 112758 | 5240 | 4.62 | 0.7 | -0.43 | -0.13 | 0.28 | -0.12 |
| 114710 | 6000 | 4.30 | 1.1 | -0.03 | 0.07 | 0.01 | 0.05 |
| 117176 | 5480 | 3.83 | 1.0 | -0.11 | -0.04 | 0.04 | -0.14 |
| 121560 | 6140 | 4.27 | 1.2 | -0.43 | 0.06 | 0.14 | 0.08 |
| 126053 | 5690 | 4.45 | 1.0 | -0.35 | -0.11 | 0.14 | -0.10 |
| 130322 | 5390 | 4.55 | 0.8 | 0.04 | 0.03 | -0.04 | - |
| 132142 | 5240 | 4.58 | 0.7 | -0.39 | -0.09 | 0.26 | - |
| 134987 | 5740 | 4.25 | 1.0 | 0.25 | -0.12 | -0.17 | -0.10 |
| 142373 | 5840 | 3.84 | 1.2 | -0.57 | -0.06 | 0.23 | -0.06 |
| 144579 | 5330 | 4.59 | 0.8 | -0.69 | -0.08 | 0.46 | -0.04 |
| 157214 | 5735 | 4.24 | 1.0 | -0.34 | -0.13 | 0.34 | -0.08 |
| 168009 | 5785 | 4.23 | 1.0 | -0.03 | -0.08 | -0.08 | -0.09 |
| 176377 | 5860 | 4.43 | 0.9 | -0.27 | 0.14 | - | - |
| 179957 | 5740 | 4.38 | 0.9 | -0.01 | -0.06 | 0.03 | -0.14 |
| 179958 | 5760 | 4.32 | 0.9 | 0.02 | -0.04 | 0.00 | -0.12 |
| 187923 | 5730 | 4.01 | 1.1 | -0.17 | -0.05 | 0.13 | -0.10 |
| 188512 | 5110 | 3.60 | 0.9 | -0.17 | 0.09 | 0.03 | -0.10 |
| 194598 | 6060 | 4.27 | 1.4 | -1.12 | -0.03 | 0.58 | -0.11 |
| 195019 | 5800 | 4.16 | 1.0 | 0.04 | -0.03 | 0.00 | -0.12 |
| 198149 | 4990 | 3.40 | 1.0 | -0.14 | 0.04 | 0.01 | - |
| 201891 | 5940 | 4.24 | 1.2 | -1.05 | -0.05 | 0.42 | -0.02 |
| 207978 | 6310 | 3.94 | 1.6 | -0.52 | 0.00 | - | - |
| 209458 | 6080 | 4.33 | 1.1 | -0.06 | 0.10 | 0.10 | 0.11 |
| 222794 | 5620 | 3.94 | 1.2 | -0.69 | -0.10 | 0.38 | 0.05 |
 3375 3375 |
6200 | 4.31 | 1.4 | -2.15 | -0.18 | - | -0.06 |
| HD/BD |
|
|
|
[Fe/H] | [Ba/Fe] | [Eu/Fe] | [Sr/Fe] |
 2245 2245 |
5630 | 3.85 | 1.2 | -1.13 | 0.19 | - | 0.22 |
 2476 2476 |
6330 | 4.03 | 1.8 | -1.96 | 0.13 | - | -0.21 |
 268 268 |
5340 | 4.60 | 0.9 | -2.20 | 0.07 | - | -0.11 |
As in Paper I we use stellar parameters determined mostly by Fuhrmann
(1998,2001) spectroscopically: effective
temperatures
from Balmer line profile fitting, surface gravities
from line wings of the Mg Ib triplet, metallicities [Fe/H] and
microturbulence values
from the Fe II line profile fitting.
For three stars, HD19445, BD2 3375 and BD342476,
we adopt the stellar parameters determined by Andreas Korn (2000)
obtained with the same methods. All parameters are given in Table 1. The identification of the stellar population for all stars of our sample is from
Fuhrmann (1998) and Bernkopf et al. (2001), based on the star's
kinematics, -element enhancement and age.
3375 and BD342476,
we adopt the stellar parameters determined by Andreas Korn (2000)
obtained with the same methods. All parameters are given in Table 1. The identification of the stellar population for all stars of our sample is from
Fuhrmann (1998) and Bernkopf et al. (2001), based on the star's
kinematics, -element enhancement and age.
For each star a line-blanketed LTE model atmosphere has been generated at given
values of
,
,
[Fe/H] and [/Fe], where [/Fe] is
the relative abundance of the most abundant -process elements O, Mg and
Si, which in cool stellar atmospheres contribute in significant amounts to the
electron pressure. We assume that oxygen and silicon abundances follow magnesium
and adopt [/Fe] = [Mg/Fe]. The [Mg/Fe] abundance ratios are taken from
Fuhrmann (1998) and Bernkopf et al. (2001) analyses. Three aspects
concerning model atmosphere calculations are worth mentioning
 was adopted to be 0.5;
 to the improved meteoritic value
 ,
which
we believe to be the best representation of the solar mixture. We refer to
abundances on the usual scale where
,
which
we believe to be the best representation of the solar mixture. We refer to
abundances on the usual scale where
 ;
-elements O, Mg and Si were scaled by the stellar Mg/Fe
ratio. We note that the additional electron pressure in -enhanced models
results in a measurable weakening of spectral lines of dominant ionization
stages such as Sr II, Ba II, Eu II. The effect increases
with decreasing temperature. For example, an increase of -element
abundances by 0.4 dex in a model atmosphere leads to Ba abundances obtained from
stellar spectra increasing by about 0.1 dex.
;
-elements O, Mg and Si were scaled by the stellar Mg/Fe
ratio. We note that the additional electron pressure in -enhanced models
results in a measurable weakening of spectral lines of dominant ionization
stages such as Sr II, Ba II, Eu II. The effect increases
with decreasing temperature. For example, an increase of -element
abundances by 0.4 dex in a model atmosphere leads to Ba abundances obtained from
stellar spectra increasing by about 0.1 dex.
 ,
model atmospheres were interpolated
from a grid of -enhanced models with [
,
model atmospheres were interpolated
from a grid of -enhanced models with [
![$\rm\alpha/Fe] = 0.4$](/articles/aa/full/2001/34/aa1288/img42.gif) ,
whereas those
for thin disk stars referred to a grid of model atmospheres without any
-enhancement. However, the observed [Mg/Fe] ratio can differ from 0.4
dex in metal-poor stars (for example, HD103095:
,
whereas those
for thin disk stars referred to a grid of model atmospheres without any
-enhancement. However, the observed [Mg/Fe] ratio can differ from 0.4
dex in metal-poor stars (for example, HD103095:
![$\rm [Mg/Fe] = 0.28$](/articles/aa/full/2001/34/aa1288/img43.gif) )
and from 0 in
thin disk stars (for example, HD117176:
)
and from 0 in
thin disk stars (for example, HD117176:
![$\rm [Mg/Fe] = 0.08$](/articles/aa/full/2001/34/aa1288/img44.gif) ). For this reason Ba
abundances obtained in our present study may deviate by up to 0.04 dex from the
corresponding values calculated in Paper I.
). For this reason Ba
abundances obtained in our present study may deviate by up to 0.04 dex from the
corresponding values calculated in Paper I.
We use the same method as in Paper I to derive Ba and Eu abundances for the
stars. The synthetic line profiles are computed using the departure coefficients
of the Ba II and Eu II levels from the code NONLTE3 (Sakhibullin
1983) and the LTE assumption for other atoms. The line list is extracted
from Kurucz' (1994) compilation, and it includes all the relevant atomic
and molecular lines. A differential analysis with respect to the Sun is
performed. Solar barium and europium abundances,
 and
and
 ,
and van der Waals damping constants C6 for the
Ba II and Eu II lines were determined in Paper I from solar line
profile fitting. The methods of NLTE calculations for Ba II and
Eu II were developed earlier (Mashonkina & Bikmaev 1996;
Mashonkina et al. 1999; Mashonkina 2000; Paper I). Some examples
of the Ba II and Eu II stellar line profile fitting were given in
Paper I.
Barium abundances have now been determined for the 63 stars most of which
are listed in Table 1; for 62 of them abundances are obtained both
from the subordinate Ba II lines,
and
,
and
from the resonance line
.
As discussed earlier the Ba II
resonance line is strongly affected by hyperfine structure (HFS) and, as a
result, Ba abundances derived from this line depend on the even-to-odd Ba
isotope abundance ratio adopted in calculations. A difference between Ba
abundances obtained at solar ratio 82:18 (Cameron 1982) and the pure
r-process ratio 56:44 (Arlandini et al. 1999) can reach to 0.2 dex
(HD45282) and it is minimum (0.08 dex) for the most metal-poor stars of our
sample. That is why we prefer to use Ba abundances from the subordinate lines
free of HFS effect. However, for the three most metal-poor stars with [Fe/H] <
-2 the only subordinate line available,
,
is very weak, and the Ba
abundance is determined with an uncertainty of about 0.1 dex. For these stars
the resonance line profile leads to a much better fit, and the Ba abundance
obtained is more reliable, provided that a realistic even-to-odd Ba isotopic
ratio is used. We have shown in Paper I that barium seen in halo stars must have
been mainly produced by the r-process. Assuming a pure r-process we have found
Ba abundances from the
line and compared them with the abundances
from the
line:
,
and van der Waals damping constants C6 for the
Ba II and Eu II lines were determined in Paper I from solar line
profile fitting. The methods of NLTE calculations for Ba II and
Eu II were developed earlier (Mashonkina & Bikmaev 1996;
Mashonkina et al. 1999; Mashonkina 2000; Paper I). Some examples
of the Ba II and Eu II stellar line profile fitting were given in
Paper I.
Barium abundances have now been determined for the 63 stars most of which
are listed in Table 1; for 62 of them abundances are obtained both
from the subordinate Ba II lines,
and
,
and
from the resonance line
.
As discussed earlier the Ba II
resonance line is strongly affected by hyperfine structure (HFS) and, as a
result, Ba abundances derived from this line depend on the even-to-odd Ba
isotope abundance ratio adopted in calculations. A difference between Ba
abundances obtained at solar ratio 82:18 (Cameron 1982) and the pure
r-process ratio 56:44 (Arlandini et al. 1999) can reach to 0.2 dex
(HD45282) and it is minimum (0.08 dex) for the most metal-poor stars of our
sample. That is why we prefer to use Ba abundances from the subordinate lines
free of HFS effect. However, for the three most metal-poor stars with [Fe/H] <
-2 the only subordinate line available,
,
is very weak, and the Ba
abundance is determined with an uncertainty of about 0.1 dex. For these stars
the resonance line profile leads to a much better fit, and the Ba abundance
obtained is more reliable, provided that a realistic even-to-odd Ba isotopic
ratio is used. We have shown in Paper I that barium seen in halo stars must have
been mainly produced by the r-process. Assuming a pure r-process we have found
Ba abundances from the
line and compared them with the abundances
from the
line:
[Ba
 /Fe] /Fe] |
[Ba
 /Fe] /Fe] |
|
| HD84937 | -0.02 | 0.00 |
BD
 |
-0.11 | -0.18 |
BD
 |
0.01 | 0.07. |
For each star the difference
 is
within the Ba abundance errors, and keeping in mind that the abundance from the
resonance line is more reliable we adopt it as the final Ba abundance. Thus, for
these three stars and for BD
is
within the Ba abundance errors, and keeping in mind that the abundance from the
resonance line is more reliable we adopt it as the final Ba abundance. Thus, for
these three stars and for BD
 ,
with only the resonance line
available, Ba abundances have been obtained from the resonance line under the
assumption of a pure r-process even-to-odd Ba isotope ratio. For the remaining
59 stars we have obtained Ba abundances from the subordinate lines. If both of
them were available the average value was calculated.
,
with only the resonance line
available, Ba abundances have been obtained from the resonance line under the
assumption of a pure r-process even-to-odd Ba isotope ratio. For the remaining
59 stars we have obtained Ba abundances from the subordinate lines. If both of
them were available the average value was calculated.
![\begin{figure}
\par\includegraphics[width=8.7cm,clip]{ms1288.f1}
\end{figure}](/articles/aa/full/2001/34/aa1288/img53.gif) |
Figure 1: The runs of [Ba/Fe] and [Ba/H] with [Fe/H]. Symbols correspond to the thin disk (open circles), the thick disk (filled circles), and the halo stars (asterisks). The two stars indicated by a cross in an open circle are transition stars according to Fuhrmann (1998). Error bars are indicated at the lower left. |
| Open with DEXTER | |
![\begin{figure}
\par\includegraphics[width=8.8cm,clip]{ms1288.f2}\end{figure}](/articles/aa/full/2001/34/aa1288/img54.gif) |
Figure 2: Variation of [Eu/Fe] (top panel) and [Eu/H] (bottom panel) with [Fe/H]. Symbols are the same as in Fig. 1. |
| Open with DEXTER | |
NLTE effects for Ba II in cool stars were described in detail earlier
(Mashonkina et al. 1999). Here we just note that the kinetic
equilibrium of Ba II is strongly affected by radiative processes in b-b
transitions because this is the dominant ionization stage. As a consequence NLTE
effects for Ba II depend on the Ba abundance which correlates with the
general metallicity of the model atmosphere. Thus, NLTE leads to a strengthening
of the Ba II lines compared with the LTE case at [M/H] > -1.9 and to
the opposite effect at lower metallicities. NLTE effects are small for the
weakest line
.
NLTE abundance corrections
 do not exceed 0.1 dex by absolute value. Significant NLTE
effects have been found for the second subordinate line
:
do not exceed 0.1 dex by absolute value. Significant NLTE
effects have been found for the second subordinate line
:
 is -0.2 dex on average in the metallicity range -1 <
[Fe/H] < 0.25; it reduces by absolute value to 0.10-0.15 dex at
metallicities between -1.5 and -1, and it becomes positive up to 0.15 dex at
even lower [Fe/H].
is positive also for the resonance line
in the four halo stars with Ba abundances derived from this line. Its value is
at maximum for the hottest star, HD84937:
is -0.2 dex on average in the metallicity range -1 <
[Fe/H] < 0.25; it reduces by absolute value to 0.10-0.15 dex at
metallicities between -1.5 and -1, and it becomes positive up to 0.15 dex at
even lower [Fe/H].
is positive also for the resonance line
in the four halo stars with Ba abundances derived from this line. Its value is
at maximum for the hottest star, HD84937:
 dex and
smaller for the coolest star, BD
:
= 0.08 dex.
For 52 stars with both subordinate lines available the mean value of the
difference between NLTE abundances derived from
and
equals 0.00
dex and
smaller for the coolest star, BD
:
= 0.08 dex.
For 52 stars with both subordinate lines available the mean value of the
difference between NLTE abundances derived from
and
equals 0.00  0.03 dex, while under the LTE assumption Ba abundances from
the first line are systematically overestimated relative to
0.03 dex, while under the LTE assumption Ba abundances from
the first line are systematically overestimated relative to
 with the mean difference of 0.11
0.04. This gives
reason to believe that the uncertainty of our NLTE line formation treatment
leads to Ba abundance errors not greater than 0.03 dex.
with the mean difference of 0.11
0.04. This gives
reason to believe that the uncertainty of our NLTE line formation treatment
leads to Ba abundance errors not greater than 0.03 dex.
The final [Ba/Fe] abundance ratios are presented in Table 1 and
Fig. 1. In addition, in the bottom panel of Fig. 1 we give
[Ba/H]. As the reference solar abundance
 adopted by
Fuhrmann (1998,2001) is used in stellar metallicity determinations. As
discussed in Paper I, uncertainties of stellar parameters cause abundance errors
up to
adopted by
Fuhrmann (1998,2001) is used in stellar metallicity determinations. As
discussed in Paper I, uncertainties of stellar parameters cause abundance errors
up to
 dex.
dex.
Europium abundances have been derived from the Eu II
 line for 51 stars of our sample. Even at spectral resolving power
 this line can not be extracted from noise in spectra of the hot
halo stars HD19445, HD84937, BD
and BD
.
For
the cool star BD66
this line can not be extracted from noise in spectra of the hot
halo stars HD19445, HD84937, BD
and BD
.
For
the cool star BD66 ,
with the lowest metallicity,
,
with the lowest metallicity,
![$\rm [Fe/H] = -2.20$](/articles/aa/full/2001/34/aa1288/img65.gif) ,
only a spectrum observed at
,
only a spectrum observed at
 is available, and though the
Eu II
line is detected its profile cannot be satisfactorily
fitted. In addition, Eu abundances could not be determined for all the stars
observed in May 1997 and September 1996 because no spectra were reduced
shortward of 4300 Å.
is available, and though the
Eu II
line is detected its profile cannot be satisfactorily
fitted. In addition, Eu abundances could not be determined for all the stars
observed in May 1997 and September 1996 because no spectra were reduced
shortward of 4300 Å.
| Age [Gyr] | Number of stars |
![$\overline {\rm [Ba/Fe]}$](/articles/aa/full/2001/34/aa1288/img2.gif) |
| >8 | 7 |
 |
| 6-8 | 7 |
 |
| 4-6 | 8 |
 |
| 2-4 | 5 |
 |
 2 2 |
3 | ? |
As discussed in Paper I NLTE effects weaken the Eu II
line
compared with the LTE case and NLTE abundance corrections are positive. For our
stars
ranges from 0.03 dex to 0.07 dex. The final [Eu/Fe]
ratios are presented in Table 1 and Fig. 2, where the
run of [Eu/H] with metallicity is shown, too. Uncertainties of stellar
parameters cause abundance errors up to
 dex (Paper I).
The Eu II
line is located in a crowded spectral range and
this can lead to additional errors. To find a continuum level we fitted observed
spectra in the spectral range from 4123 Å to 4135 Å. The difference of Eu
abundances derived from two spectra of a star is usually within 0.05 dex. We
estimate a total Eu abundance error of 0.1 dex.
dex (Paper I).
The Eu II
line is located in a crowded spectral range and
this can lead to additional errors. To find a continuum level we fitted observed
spectra in the spectral range from 4123 Å to 4135 Å. The difference of Eu
abundances derived from two spectra of a star is usually within 0.05 dex. We
estimate a total Eu abundance error of 0.1 dex.
Figures 1 and 2 confirm the results obtained in Paper I and show new features that have become apparent due to the extension of the stellar sample. We summarize them as follows
,
where barium is evidently overabundant relative
to iron: [Ba/Fe] = 0.13. The three halo stars with Eu abundances available show
[Eu/Fe] ratios that are close together with a mean value of 0.58;
0.04 (except for BD
 with [Ba/Fe] =
0.19; we will return to this star below when discussing other element abundance
ratios). A slight decline of the [Ba/Fe] abundance ratios with increasing
metallicity should be noted. In contrast to Ba, europium is overabundant
relative to iron in thick disk stars with a clear decline of the [Eu/Fe]
abundance ratios from about 0.5 at [Fe/H] = -0.9 to 0.25 at [Fe/H] = -0.28;
with [Ba/Fe] =
0.19; we will return to this star below when discussing other element abundance
ratios). A slight decline of the [Ba/Fe] abundance ratios with increasing
metallicity should be noted. In contrast to Ba, europium is overabundant
relative to iron in thick disk stars with a clear decline of the [Eu/Fe]
abundance ratios from about 0.5 at [Fe/H] = -0.9 to 0.25 at [Fe/H] = -0.28;
![$\overline{\rm [Ba/Fe]} = -0.01 \pm 0.06$](/articles/aa/full/2001/34/aa1288/img74.gif) and a decline of the
[Eu/Fe] abundance ratios with increasing metallicity. There is a rather large
spread in [Ba/Fe] up to 0.3 dex that exceeds Ba abundance errors. At the same
time, a spread in [Eu/Fe] is within abundance errors;
and a decline of the
[Eu/Fe] abundance ratios with increasing metallicity. There is a rather large
spread in [Ba/Fe] up to 0.3 dex that exceeds Ba abundance errors. At the same
time, a spread in [Eu/Fe] is within abundance errors;
 we have determined the elemental abundances:
[Ba/Fe] = 0.02 and 0.01 from the Ba II 5853 and 6496,
[Eu/Fe] = 0.56 and 0.61 from the Eu II 4129 and 6645.
The ratios [Ba/Fe], [Eu/Fe] and [Eu/Mg] in this star are higher by 0.12-0.17 dex compared with the corresponding values in other thick disk stars.
![\begin{figure}
\par\includegraphics[width=8.7cm,clip]{ms1288.f3}
\end{figure}](/articles/aa/full/2001/34/aa1288/img76.gif) |
Figure 3: The Sr model atom. Linearized transitions are shown as solid lines. |
| Open with DEXTER | |
We have tried to find the reason for the large spread of [Ba/Fe] among the thin
disk stars and noted a marginal correlation between the [Ba/Fe] abundance ratio
and star's age. Stellar ages have been estimated by Bernkopf et al. (2001)
using evolutionary tracks of VandenBerg et al. (2000) and
recent own calculations. Allowing for an
uncertainty of 1 Gyr for the stellar age estimates we combined the stars into
separate age groups and calculated for each group the mean value
(Table 2). We do not give
for
stars younger than 2 Gyr because the three stars available do not represent this
group in a statistically reliable way; for two of them, HD43042 and
HD130322,
![$\rm [Ba/Fe] = 0.00$](/articles/aa/full/2001/34/aa1288/img77.gif) and 0.03, respectively, and we note a surprisingly
low [Ba/Fe] abundance ratio (-0.17) for Procyon (HD61421). It is evident
from Table 2 that during thin disk evolution the Ba abundance in
interstellar matter increased relative to the iron abundance by about 0.12 dex.
So, at least part of the observed spread in [Ba/Fe] may not be random. At the
same time, Edvardsson et al. (1993) first noted, and Fuhrmann
(2001) confirmed later, that the metallicity of thin disk stars
correlates only weakly with the stellar age. For this reason we do not see any
regular behaviour of the [Ba/Fe] ratios plotted against [Fe/H] of thin disk
stars (Fig. 1).
and 0.03, respectively, and we note a surprisingly
low [Ba/Fe] abundance ratio (-0.17) for Procyon (HD61421). It is evident
from Table 2 that during thin disk evolution the Ba abundance in
interstellar matter increased relative to the iron abundance by about 0.12 dex.
So, at least part of the observed spread in [Ba/Fe] may not be random. At the
same time, Edvardsson et al. (1993) first noted, and Fuhrmann
(2001) confirmed later, that the metallicity of thin disk stars
correlates only weakly with the stellar age. For this reason we do not see any
regular behaviour of the [Ba/Fe] ratios plotted against [Fe/H] of thin disk
stars (Fig. 1).
The NLTE problem for Sr II was first treated on the base of a realistic model atom by Belyakova & Mashonkina (1997). Here we describe briefly the atomic data and new results.
The Sr II model atom contains all levels with  and
and  .
Doublet fine structure is neglected except for the 4d2D and
5p2P
splitting. Thus, 40 bound levels of Sr II and the
ground state of Sr III are included in the model atom. The corresponding
Grotrian diagram is shown in Fig. 3. The Sr I levels are taken
into account only for number conservation because in all stellar atmospheres
considered the ratio n(Sr I)/n(Sr II) is smaller than
10-4 due to the low ionization energy of Sr I:
.
Doublet fine structure is neglected except for the 4d2D and
5p2P
splitting. Thus, 40 bound levels of Sr II and the
ground state of Sr III are included in the model atom. The corresponding
Grotrian diagram is shown in Fig. 3. The Sr I levels are taken
into account only for number conservation because in all stellar atmospheres
considered the ratio n(Sr I)/n(Sr II) is smaller than
10-4 due to the low ionization energy of Sr I:
 eV.
eV.
![\begin{figure}
\par\includegraphics[width=8.7cm,clip]{ms1288.f4}\par\par\end{figure}](/articles/aa/full/2001/34/aa1288/img82.gif) |
Figure 4:
Departure coefficients bi for some levels of Sr II in the
model atmosphere of the Sun. Tick marks indicate the locations of line center
optical depth unity for the Sr II lines. The resonance line core forms
above
 . . |
| Open with DEXTER | |
The energy levels are from Moore (1952) and Lindgard & Nielsen (1977). Sr II transition probabilities from Wiese & Martin (1980) are believed to be the best. If they are not available the data of Kurucz (1994) or Lindgard & Nielsen (1977) are taken giving preference to the first of the two sources. Photoionization cross-sections for ns, np and nd levels have been calculated by the quantum defect method using Peach's (1967) tables. For the remaining levels hydrogenic cross-sections are computed. For electron impact excitation we use the formula of van Regemorter (1962) for allowed transitions and that of Allen (1973) for forbidden ones. Electron impact ionization cross-sections are computed according to Drawin (1961). For hydrogen collisions, we use the formula of Steenbock & Holweger (1984). Since this formula provides only an order of magnitude estimate, the cross-sections were multiplied by appropriate scaling factors in order to produce the best fit to the solar Sr II line profiles.
The Sr II kinetic equilibrium is calculated using the code NONLTE3 (Sakhibullin 1983), which is based on the complete linearization method as described by Auer & Heasley (1976). The advanced method of calculations has been described in detail in our previous work (Mashonkina et al. 1999).
The Sr II term structure is similar to that of Ba II, and the same
mechanisms of departures from LTE are responsible for both ions. NLTE effects
for Ba II were described in detail earlier (Mashonkina et al.
1999). In Fig. 4 the departure coefficients, bi, are shown
for the solar atmosphere as a function of continuum optical depth
 at
at
 Å. In the first place, we are interested in the behaviour
of the levels contributing to the subsequent line profile synthesis. These are
the
Å. In the first place, we are interested in the behaviour
of the levels contributing to the subsequent line profile synthesis. These are
the  ,
,
 ,
,
 and
and  levels.
As Sr II is the dominant ionization stage, no process affects the ground
state population, and
keeps its thermodynamic equilibrium value. The
metastable level
is separated by 1.8 eV from the ground state and by
1.14 eV from ,
and therefore collisional and radiative transitions
 have
stronger effects on the
level population compared with collisional coupling
of this level to the ground state. The departure coefficients of
and
begin to deviate from 1 at the depths around
have
stronger effects on the
level population compared with collisional coupling
of this level to the ground state. The departure coefficients of
and
begin to deviate from 1 at the depths around
 = -1 where
photon losses in the weakest line 10036 of the multiplet
start to become important. The
overpopulation and
underpopulation are
amplified in the upper layers which are transparent with respect to the
radiation of the two strong lines of that multiplet. The overpopulation outside
= -1 where
photon losses in the weakest line 10036 of the multiplet
start to become important. The
overpopulation and
underpopulation are
amplified in the upper layers which are transparent with respect to the
radiation of the two strong lines of that multiplet. The overpopulation outside
 of all levels above
is due to line pumping. Inside
of all levels above
is due to line pumping. Inside
 the -level follows the ground state due to
strong radiative and collisional coupling. Several transitions such as
the -level follows the ground state due to
strong radiative and collisional coupling. Several transitions such as
 ,
,
 ,
,
 are pumped by
 excess radiation in the layers where the line wing optical depth
drops below 1.
excess radiation in the layers where the line wing optical depth
drops below 1.
From this behaviour of departure coefficients we expect that the Sr II
resonance lines 4077, 4215, and the lines 10036,
10327, 10914 of multiplet
are amplified, whereas
4161 arising from
is weakened compared with the LTE case. In line
formation layers the departure coefficients of the lower levels of
 and
and
 transitions equal 1, and NLTE effects for the resonance line and
4161 are caused by a deviation of the source function
transitions equal 1, and NLTE effects for the resonance line and
4161 are caused by a deviation of the source function
 from
from
 :
:
 for the
resonance lines and
for the
resonance lines and
 for
4161. For the infrared triplet lines both
for
4161. For the infrared triplet lines both
 and
and
 are valid in line formation layers resulting in much larger NLTE effects
compared with the resonance lines and 4161: for the Sun the NLTE
abundance correction
is between -0.03 and -0.01 dex for
are valid in line formation layers resulting in much larger NLTE effects
compared with the resonance lines and 4161: for the Sun the NLTE
abundance correction
is between -0.03 and -0.01 dex for
 and between 0.02 and 0.03 dex for
 depending on the
efficiency of H atom collisions while
ranges from -0.18 to
-0.35 dex for
depending on the
efficiency of H atom collisions while
ranges from -0.18 to
-0.35 dex for
 .
.
![\begin{figure}
\par\includegraphics[width=8.7cm,clip]{ms1288.f51}\par\includegra...
...{ms1288.f52}\par\includegraphics[width=8.7cm,clip]{ms1288.f53}\par
\end{figure}](/articles/aa/full/2001/34/aa1288/img108.gif) |
Figure 5:
Synthetic NLTE (continuous line) flux profiles of the Sr II
lines compared with the observed spectrum of the Kurucz et al. (1984) solar flux
atlas (bold dots). The pure Sr II 4215 and 4161 NLTE
profiles (dotted line) are shown for comparison. For the Sr II
10327 the LTE profile is given as dashed line. See text for discussion
of the fitting parameters. |
| Open with DEXTER | |
A similar behaviour of the departure coefficients resulting in an amplification
of the
line and a weakening of 4161 has been found for
all the stars of our sample. The first NLTE calculations for Sr II
(Belyakova & Mashonkina 1997) have shown that in very metal-poor
atmospheres the Sr II resonance lines are not strengthened but weakened
compared with the LTE case. The same phenomenon was found for the Ba II
lines, too (see Sect. 3). For the Ba II lines
changes
its sign at [Fe/H] between -1.5 and -1.9 depending on
while for the
Sr II lines such a transition range is shifted to lower metallicities
between -2.1 and -3.0. At [Fe/H] = -2.5 NLTE effects for the Sr II
resonance lines depend strongly on
,
and [Fe/H], and neglecting
NLTE effects can lead to strontium abundance errors up to 1 dex (Belyakova &
Mashonkina 1997).
The Sr II resonance line 4215 and the subordinate line
4161 are used in this study to determine stellar Sr abundances. Both of
them are blended. Solar profiles of these lines are fitted to improve atomic
parameters of blending lines. Another kind of important atomic data is the
efficiency of hydrogen collisions in the Sr II kinetic equilibrium
calculations which is represented by a scaling factor  applied to Steenbock
& Holweger's (1984) version of Drawin's (1968, 1969) formula
for the computation of H atom collisional rates. As mentioned above, the lines
10327 and 10914 reveal strong NLTE effects, and they are
therefore most suitable to estimate this scaling factor from solar line profile
fitting.
applied to Steenbock
& Holweger's (1984) version of Drawin's (1968, 1969) formula
for the computation of H atom collisional rates. As mentioned above, the lines
10327 and 10914 reveal strong NLTE effects, and they are
therefore most suitable to estimate this scaling factor from solar line profile
fitting.
We use solar flux observations taken from the Kitt Peak Solar Atlas (Kurucz et al. 1984). Our synthetic flux profiles are convolved with a profile that
combines a rotational broadening of 1.8 kms-1 and broadening by macroturbulence
with a radial-tangential profile of
 kms-1 for the infrared lines,
 kms-1 for 4215 and
 kms-1 for 4161.
For the solar Sr abundance we accept the meteoritic value
kms-1 for 4161.
For the solar Sr abundance we accept the meteoritic value
 from
Grevesse et al. (1996). A depth-independent microturbulence of
0.8 kms-1 is adopted. For a calculation of van der Waals damping constants C6 we have
derived a formula based on Anstee & O'Mara's (1995) calculations,
where
from
Grevesse et al. (1996). A depth-independent microturbulence of
0.8 kms-1 is adopted. For a calculation of van der Waals damping constants C6 we have
derived a formula based on Anstee & O'Mara's (1995) calculations,
where

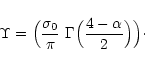
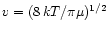 and
and
 is the reduced mass;
  is a line-broadening cross-section and
is a velocity parameter. The values of
and
are
tabulated in the papers of Anstee & O'Mara (1995), Barklem & O'Mara
(1997,2000), and Barklem et al. (1998). The C6-value
depends only slightly on temperature as
is a line-broadening cross-section and
is a velocity parameter. The values of
and
are
tabulated in the papers of Anstee & O'Mara (1995), Barklem & O'Mara
(1997,2000), and Barklem et al. (1998). The C6-value
depends only slightly on temperature as
 .
At typical
values of
(between 0.2 and 0.4)
.
At typical
values of
(between 0.2 and 0.4)  changes by 0.04 at maximum
as one goes from T = 4000 K to T = 6000 K. Therefore the small variation of C6
across line formation layers can be neglected in calculations of line profiles,
and we use in this study depth-independent C6-values computed at T = 6000 K.
changes by 0.04 at maximum
as one goes from T = 4000 K to T = 6000 K. Therefore the small variation of C6
across line formation layers can be neglected in calculations of line profiles,
and we use in this study depth-independent C6-values computed at T = 6000 K.
 10327 and
10914. We use
10327 and
10914. We use  (10327) = -0.35 and
(10914) = -0.64 according to
Wiese & Martin (1980). The recent results of Guet & Johnson (1991)
and Brage et al. (1998) give similar values:
(10327)
= -0.30 and -0.34, respectively, and
(10914) = -0.59 and
-0.62. The C6-values for these lines (Table 3) have been computed
with
and
taken from Barklem & O'Mara (2000).
(10327) = -0.35 and
(10914) = -0.64 according to
Wiese & Martin (1980). The recent results of Guet & Johnson (1991)
and Brage et al. (1998) give similar values:
(10327)
= -0.30 and -0.34, respectively, and
(10914) = -0.59 and
-0.62. The C6-values for these lines (Table 3) have been computed
with
and
taken from Barklem & O'Mara (2000).
We compared different atomic models excluding and including H atom collisions
with cross-sections calculated according to Steenbock & Holweger (1984)
and scaled by various factors .
If hydrogen collisions are neglected we
obtain for both lines broader and deeper theoretical profiles compared with the
observed ones. Inclusion of these processes with = 0.1 makes the NLTE
profile shallower and narrower than the observed one. The best fits of both
lines are obtained at = 0.01. In Fig. 5 (bottom panel) we show one
of these lines, 10327. For comparison the LTE profile corresponding to
the same fitting parameters is presented, too. It is obvious that assuming LTE
we cannot fit the 10327 line profile with reasonable values of
 and
;
even the line wings are affected by NLTE effects.
and
;
even the line wings are affected by NLTE effects.
4215. The Sr II resonance lines are affected by
hyperfine structure (HFS). Strontium is represented by four stable isotopes. For
solar system matter the ratio of the even Sr isotopes to the odd ones
(
 +
+
):
is 93:7 according to
Cameron (1982). Isotopic shifts are very small (
+
+
):
is 93:7 according to
Cameron (1982). Isotopic shifts are very small (
 )
but the odd
isotopes have hyperfine splitting of their levels resulting in several HFS
components for a spectral line. We use the data on wavelengths and relative
intensities of HFS components given by McWilliam et al. (1995).
Oscillator strengths of separate components (Table 3) have been
calculated using solar Sr isotopic abundances and
)
but the odd
isotopes have hyperfine splitting of their levels resulting in several HFS
components for a spectral line. We use the data on wavelengths and relative
intensities of HFS components given by McWilliam et al. (1995).
Oscillator strengths of separate components (Table 3) have been
calculated using solar Sr isotopic abundances and
 from Wiese & Martin (1980). The most recent value
 of Brage et al. (1998) coincides with that
adopted in our study.
of Brage et al. (1998) coincides with that
adopted in our study.
![\begin{table}
\par
\includegraphics[width=14cm,clip]{tab.eps}\end{table}](/articles/aa/full/2001/34/aa1288/img128.gif) |
The Sr II 4215.539 Å line is blended by the strong Fe I 4215.426 Å line and by a
few CN molecular lines in the
far blue and red line wings. We treat Fe I 4215 with the fixed
values of
 and
and
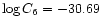 .
The last value was
calculated using the above formula. For the Sun
.
The last value was
calculated using the above formula. For the Sun
 = 7.51 was adopted.
Oscillator strengths of the CN molecular lines were fitted to reproduce the
observed blend profile.
= 7.51 was adopted.
Oscillator strengths of the CN molecular lines were fitted to reproduce the
observed blend profile.
![\begin{figure}
\par\mbox{
\includegraphics[width=8.8cm,clip]{ms1288.f61}\include...
...]{ms1288.f63}\includegraphics[width=8.8cm,clip]{ms1288.f64} }
\par\end{figure}](/articles/aa/full/2001/34/aa1288/img132.gif) |
Figure 6: NLTE synthetic (continuous line) and pure Sr II line profiles (dotted) compared with observed FOCES spectra (bold dots) of HD69611 ([Fe/H] = -0.60, top row), HD144579 ([Fe/H] = -0.69, bottom row, left panel) and HD84937 ([Fe/H] = -2.07, bottom row, right panel). |
| Open with DEXTER | |
Sr II 4215 is strongly affected by van der Waals damping. The
classical Unsöld (1955) formula gives
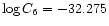 while the
formula above leads to
while the
formula above leads to
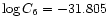 with
and
from
Barklem & O'Mara (2000). Varying
by only 0.1 has a
significant effect on the total energy absorbed in this line. A careful
analysis of the solar line profile makes possible a separation of collisional
broadening and blending effects. The best fit obtained with
with
and
from
Barklem & O'Mara (2000). Varying
by only 0.1 has a
significant effect on the total energy absorbed in this line. A careful
analysis of the solar line profile makes possible a separation of collisional
broadening and blending effects. The best fit obtained with
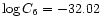 is presented in Fig. 5 (top panel). For comparison we give also the
pure Sr II 4215 NLTE profile calculated with the same
parameters.
is presented in Fig. 5 (top panel). For comparison we give also the
pure Sr II 4215 NLTE profile calculated with the same
parameters.
We did not succeed fitting the 4215 line core (Fig. 5)
because it is formed in the uppermost atmospheric layers above
,
and it is most probably influenced by a non-thermal and depth-dependent
chromospheric velocity field that is not part of our solar model.
4161. This line is located in the far red wing of two
strong blends, Fe I 4161.488 Å and Ti II
4161.534 Å. In addition, absorption in a few CN and SiH molecular
lines near 4161.8 Å lowers the continuum flux by about 5%. We have found
that
 given by Wiese & Martin (1980) does not allow to
reproduce the solar Sr II 4161 line with a fixed value of
= 2.92 and reasonable values of
.
The best fit
(Fig. 5, middle panel) is obtained with
given by Wiese & Martin (1980) does not allow to
reproduce the solar Sr II 4161 line with a fixed value of
= 2.92 and reasonable values of
.
The best fit
(Fig. 5, middle panel) is obtained with
 and
and
 .
The last value is larger by 0.1 compared with the classical
Unsöld (1955) constant.
.
The last value is larger by 0.1 compared with the classical
Unsöld (1955) constant.
As mentioned above both Sr II lines of interest are blended. To obtain a
good line profile fitting of the stellar spectra and, thus, to reduce Sr
abundances errors we use only the spectra observed at
in 1998
to 2000. An exception refers to the four stars, HD45282, HD194598,
HD201891 and BD268, particularly important for our study. In
total, Sr abundances have been determined for 49 stars and for 36 of them from
both Sr II lines. The weaker 4161 line disappears at [Fe/H] <
-1. As an example, we give in Fig. 6 the Sr II
4215 line profiles for the three metal-poor stars and the Sr II
4161 line profile for one of them. The contribution of the Fe I
4215.426 Å line blend reduces rapidly with decreasing [Fe/H] because
the electron number density affects line strengths of minor species such as
Fe I much more than those of dominant ionization stages such as
Sr II. It can be seen in Fig. 6 (right column, bottom panel)
that for HD84937 the contribution of the Fe I 4215 line is
negligible. This holds also for the other 3 stars of our sample with [Fe/H] <
-1.9 and
 6000 K.
NLTE effects for the Sr II lines are small for all the stars of our
sample: NLTE abundance corrections
are negative for
4215 and positive for 4161 and do not exceed 0.07 dex and 0.05
dex, respectively, by absolute value. For 36 stars with both Sr II lines
investigated a difference of NLTE abundances derived from 4215 and
4161 is mainly within 0.08 dex with the mean value of 0.00
0.06
dex while the mean difference of LTE abundances is 0.05
0.06 dex.
![\begin{figure}
\par\includegraphics[width=8.8cm,clip]{ms1288.f7}\end{figure}](/articles/aa/full/2001/34/aa1288/img140.gif) |
Figure 7: The run of [Sr/Fe] with [Fe/H]. Symbols are the same as in Fig. 1. |
| Open with DEXTER | |
In general, Sr abundances derived from the resonance line depend on the
even-to-odd Sr isotope ratio adopted in calculations. We concluded in Paper I
that Ba and Eu in halo and thick disk stars were mainly produced by r-process in
high-mass stars. Sr might be produced not only in the r-process but also in a
weak s-process that is related to high mass stars, too. According to Arlandini
et al. (1999) the r-process contributes only to the
isotope;
the consequence of a dominating r-process is therefore the disappearance of HFS
components in the Sr II lines. On the other hand the separation of HFS
components of the 4215 line is not large (35 mÅ at maximum, see
Table 3); Sr abundances derived from 4215 with and without
HFS thus differ by 0.07 dex at [Fe/H]  .
According to Beer et al.
(1992) the weak s-process produces much more even Sr isotopes than odd
ones: (
+
):
= 93:7, similarly to the
main s-process which defines the solar system even-to-odd Sr isotope ratio. The
ratio of the weak s- to r-process is estimated as 3:2 (Arlandini et al.
1999). Consequently, the use of a solar even-to-odd Sr isotope
ratio leads to an uncertainty of Sr abundances in halo and thick disk stars of
not more than 0.02-0.03 dex. We neglect such a small value and use the solar
even-to-odd Sr isotope ratio for all stars of our sample.
.
According to Beer et al.
(1992) the weak s-process produces much more even Sr isotopes than odd
ones: (
+
):
= 93:7, similarly to the
main s-process which defines the solar system even-to-odd Sr isotope ratio. The
ratio of the weak s- to r-process is estimated as 3:2 (Arlandini et al.
1999). Consequently, the use of a solar even-to-odd Sr isotope
ratio leads to an uncertainty of Sr abundances in halo and thick disk stars of
not more than 0.02-0.03 dex. We neglect such a small value and use the solar
even-to-odd Sr isotope ratio for all stars of our sample.
The final [Sr/Fe] are presented in Table 1 and Fig. 7.
Whenever both Sr II lines were available the average value was
calculated. It can be concluded from Fig. 7 that the general behaviour
of the [Sr/Fe] abundance ratios with respect to metallicity is similar to that
of [Ba/Fe] (Fig. 1, top panel). For the thin disk stars there is a
spread in [Sr/Fe] up to 0.3. Similarly to [Ba/Fe] this points to a correlation
of [Sr/Fe] with stellar age: for 12 stars older than 5 Gyr the mean value
![$\overline{\rm [Sr/Fe]} = -0.10$](/articles/aa/full/2001/34/aa1288/img142.gif) while for 7 stars younger than 5 Gyr
while for 7 stars younger than 5 Gyr
![$\overline{\rm [Sr/Fe]} = 0.04$](/articles/aa/full/2001/34/aa1288/img143.gif) .
The thick disk stars show a decline of [Sr/Fe]
with [Fe/H] increasing, so, that in "late'' thick disk stars ([Fe/H] > -0.5)
strontium is underabundant relative to iron by 0.1 dex, and this value coincides
with the Ba underabundance reported in Sect. 3 for the thick disk stars.
Underabundances of Sr relative to iron are typical for the halo stars which are
close together with a mean value of [Sr/Fe] = -0.10
0.02. The discrepant
result for BD2476 was dropped (see Sect. 6 for further discussion of
this star).
.
The thick disk stars show a decline of [Sr/Fe]
with [Fe/H] increasing, so, that in "late'' thick disk stars ([Fe/H] > -0.5)
strontium is underabundant relative to iron by 0.1 dex, and this value coincides
with the Ba underabundance reported in Sect. 3 for the thick disk stars.
Underabundances of Sr relative to iron are typical for the halo stars which are
close together with a mean value of [Sr/Fe] = -0.10
0.02. The discrepant
result for BD2476 was dropped (see Sect. 6 for further discussion of
this star).
The thick disk star, BD2245 ([Fe/H] = -1.13), reveals a Sr
overabundance relative to iron similar to that found for Ba (Sect. 3). There is
no HIPPARCOS parallax for this star and the uncertainty of stellar
parameters could explain apparent peculiar abundances of Sr and Ba. Another
explanation would be that this star was the secondary component of a binary,
and that we observe accreted s-process products formed in the evolved primary
component.
There are only a few Sr abundance studies of cool stars in the literature.
For the sample of 16 stars including dwarfs, giants and supergiants Gratton &
Sneden (1994) have found small Sr excess in the metallicity
range from -0.9 down to -2.8 with the mean value [Sr/Fe] = 0.07
0.11 (10 stars) and
slight underabundance of Sr relative to Fe up to 0.15 dex for 6 stars with
[Fe/H] > -0.6. These data are based on the examination of equivalent widths of
the Sr II 4161 line, and the authors note that the [Sr/Fe]
ratios given by the Sr II resonance line at 4215 Å are smaller by 0.21
0.04 dex. The mean ratio [Sr/Fe] = -0.14 deduced from 4215 line
for the halo stars is in agreement with that found in the present study. At
[Fe/H] < -1 the Sr II subordinate line is rather weak, and in our
opinion Sr abundances based on the Sr II 4215 line are more
reliable than those derived from Sr II 4161. Using equivalent
widths of Sr II 4077 and 4215 for a sample of cool
dwarfs in the metallicity range similar to ours, Hartmann & Gehren (1988)
have obtained [Sr/Fe] abundance ratios close to solar, independent of the
general metal abundance. However, the large scatter of up to 0.5 dex masks any
features in the run [Sr/Fe] vs. [Fe/H]. Based on the Sr I 4607
line Jehin et al. (1999) have obtained [Sr/Fe] abundance ratios between
0 and -0.4 for a sample of 21 mildly metal-poor stars in the narrow metallicity
range from -0.8 down to -1.3. We note that using the LTE assumption may
result in an underestimate of element abundances derived from spectral lines of
minor species such as Sr I. Magain (1989) has studied only
metal-poor stars with [Fe/H] < -1.4 and obtained a Sr excess of about 0.4 dex
at [Fe/H] between -1.5 and -2.5 and a decline of the [Sr/Fe] abundance ratios
at lower metallicities, however, he notes that results for Sr should be
considered as preliminary due to the strength of the available lines
(Sr II 4077 and 4215) and the uncertainties affecting
the gf-values as well as the damping constants. In the range of overlapping
metallicities his data are different from ours. For extremely metal-poor stars
with [Fe/H] < -2.4 McWilliam et al. (1995) and Ryan et al.
(1996) have found a decline of the [Sr/Fe] abundance ratios with
decreasing metallicity and a spread in these ratios up to 2.5 dex. Elemental
abundances were determined from the Sr II 4077 and 4215
lines with the LTE assumption. It was noted in Sect. 4 that for extremely
metal-poor stars NLTE effects for the Sr II lines depend strongly on
stellar parameters. We give one example. For two stars of Ryan et al. sample,
BS16968-061 (
= 6000 K, = 4, [Fe/H] = -3.08) and CS22186-005
(
= 6000 K, = 2, [Fe/H] = -2.77), we have computed NLTE
abundance corrections
= 0.25 dex and 0.60 dex, respectively.
Based on NLTE Sr abundances we obtain for these stars new values [Sr/Fe] =
-0.25 and -0.63 instead of -0.50 and -1.23 as determined by Ryan et al.
Therefore, the large spread in [Sr/Fe] ratios published by McWilliam et al.
(1995) and Ryan et al. (1996) may be at least in part due to
neglecting NLTE effects for the Sr II lines.
![\begin{figure}
\par\includegraphics[width=8.7cm,clip]{ms1288.f81}\par\includegra...
...lip]{ms1288.f82}\par\includegraphics[width=8.7cm,clip]{ms1288.f83}
\end{figure}](/articles/aa/full/2001/34/aa1288/img144.gif) |
Figure 8: Variation of element abundance ratios with [Fe/H]. Symbols are the same as in Fig. 1. Dotted lines in the top panel limit the range of the [Eu/Ba]r ratio uncertainty. |
| Open with DEXTER | |
-process,
weak and main s-process, r-process) in the chemical enrichment of the
interstellar gas and thus give important information about dominant sites of
nucleosynthesis at different epochs of Galactic evolution.
There is strong evidence that the relative elemental (at least, with Z < 70)
r-process abundances have
not changed over the history of the Galaxy. Sneden et al. (1996) have
found the elemental abundances in the extremely metal-poor star CS22892-052
([Fe/H]
 )
consistent with the solar r-process distribution for the
elements
)
consistent with the solar r-process distribution for the
elements  .
Similar results have been obtained for another three halo
stars ([Fe/H] = -2.7 and -1.7) by Cowan et al. (1999) and for the
three stars in the globular cluster M 15 ([Fe/H] = -2.2) by Sneden et al.
(2000). Hill et al. (2001) studied element abundances in the
range Z = 38 to Z = 92 in the halo star CS31082-001 with [Fe/H] = -2.9 and
concluded that the
56 < Z < 70 elements are very well reproduced by a solar
r-process.
In Fig. 8 (top panel) we include a line indicating
the solar abundance ratio of Eu to Ba contributed by the r-process (Arlandini et
al. 1999) relative to the total abundances, [Eu/Ba]r = 0.70. This
value is uncertain within 0.1 dex mainly due to an uncertainty of the r-process
contribution to
.
Similar results have been obtained for another three halo
stars ([Fe/H] = -2.7 and -1.7) by Cowan et al. (1999) and for the
three stars in the globular cluster M 15 ([Fe/H] = -2.2) by Sneden et al.
(2000). Hill et al. (2001) studied element abundances in the
range Z = 38 to Z = 92 in the halo star CS31082-001 with [Fe/H] = -2.9 and
concluded that the
56 < Z < 70 elements are very well reproduced by a solar
r-process.
In Fig. 8 (top panel) we include a line indicating
the solar abundance ratio of Eu to Ba contributed by the r-process (Arlandini et
al. 1999) relative to the total abundances, [Eu/Ba]r = 0.70. This
value is uncertain within 0.1 dex mainly due to an uncertainty of the r-process
contribution to
 estimated by Arlandini et al. (1999) as
58%. To obtain the pure r-process [Sr/Ba]r abundance ratio the contributions
of the main and weak s-process to solar Sr have to be evaluated. The main
s-process contributes 85% according to Arlandini et al. (1999). Up to
now there is no realistic model of the weak s-process and Arlandini et al.
estimate the ratio between the weak s-process and r-process contributions to
solar Sr as 3:2 using the schematic approach of Beer et al. (1992). This
gives [Sr/Ba]
r = -0.50, while the solar ratio of Sr contributed altogether by
the r- and weak s-process to Ba contributed by the r-process,
[Srw+r/Bar], equals -0.10. The last value is determined with less
uncertainty of about 0.1 dex compared with 0.2 dex or even more for the
[Sr/Ba]r ratio.
estimated by Arlandini et al. (1999) as
58%. To obtain the pure r-process [Sr/Ba]r abundance ratio the contributions
of the main and weak s-process to solar Sr have to be evaluated. The main
s-process contributes 85% according to Arlandini et al. (1999). Up to
now there is no realistic model of the weak s-process and Arlandini et al.
estimate the ratio between the weak s-process and r-process contributions to
solar Sr as 3:2 using the schematic approach of Beer et al. (1992). This
gives [Sr/Ba]
r = -0.50, while the solar ratio of Sr contributed altogether by
the r- and weak s-process to Ba contributed by the r-process,
[Srw+r/Bar], equals -0.10. The last value is determined with less
uncertainty of about 0.1 dex compared with 0.2 dex or even more for the
[Sr/Ba]r ratio.
Our results, apparent from Fig. 8, confirm in general and improve the conclusions drawn in Paper I; they also provide the fundaments of new conclusions.
Europium is overabundant relative to barium in halo stars with a mean
value [Eu/Ba] = 0.61. We have analyzed only three halo stars and this limits us
in drawing reliable conclusions concerning the halo. However, these stars
complement from the side of a moderate metal-deficiency the sample of 14
extremely metal-poor stars with [Fe/H]  studied by McWilliam
(1998). Using the LTE assumption he has obtained a mean value
studied by McWilliam
(1998). Using the LTE assumption he has obtained a mean value
![$\rm [Eu/Ba] = 0.69$](/articles/aa/full/2001/34/aa1288/img149.gif) .
At stellar parameters typical for his sample our NLTE calculations for
Ba II and Eu II show positive NLTE abundance corrections for both
elements but their values are larger for barium. So, the mean value
found by McWilliam might be smaller by about 0.05-0.1 dex, and our data
for the moderately metal-deficient halo stars show the same [Eu/Ba] ratio. Thus,
the observed [Eu/Ba] ratios, close to
.
At stellar parameters typical for his sample our NLTE calculations for
Ba II and Eu II show positive NLTE abundance corrections for both
elements but their values are larger for barium. So, the mean value
found by McWilliam might be smaller by about 0.05-0.1 dex, and our data
for the moderately metal-deficient halo stars show the same [Eu/Ba] ratio. Thus,
the observed [Eu/Ba] ratios, close to
![${\rm [Eu/Ba]}_r = 0.70$](/articles/aa/full/2001/34/aa1288/img150.gif) independent of
metallicity, favour the dominance of the r-process heavy element synthesis
during the formation of the halo population. If the upper mass limit of AGB
stars' progenitors, responsible for Ba synthesis in the s-process, lies
between 3
(Raiteri et al. 1999) and 4
(Travaglio et al.
1999) s-nuclei of Ba appear after about 0.3-0.6 Gyr from the beginning
of the protogalactic collapse. From the insignificant contribution of the
s-process to Ba production we conclude that the halo population has formed
rapidly during an interval of 0.3-0.6 Gyr.
independent of
metallicity, favour the dominance of the r-process heavy element synthesis
during the formation of the halo population. If the upper mass limit of AGB
stars' progenitors, responsible for Ba synthesis in the s-process, lies
between 3
(Raiteri et al. 1999) and 4
(Travaglio et al.
1999) s-nuclei of Ba appear after about 0.3-0.6 Gyr from the beginning
of the protogalactic collapse. From the insignificant contribution of the
s-process to Ba production we conclude that the halo population has formed
rapidly during an interval of 0.3-0.6 Gyr.
Strontium is slightly underabundant relative to barium in halo stars with a mean
value of [Sr/Ba] = -0.05
0.06 (except for BD2476). For most
stars of his sample McWilliam (1998) has obtained positive or close to 0
[Sr/Ba] abundance ratios. Thus, [Sr/Ba] in halo stars is much higher compared
with [Sr/Ba]
r = -0.50, and a secondary source of Sr must have occurred. Could
the weak s-process be that source? Similarly to the r-process it runs in
high-mass stars with an evolution time consistent with the short timescale for
the halo. On the other hand, the amount of Sr produced by the weak s-process is
expected to be very low in metal-poor stars simply due to the secondary nature
of the weak s-process. We note that halo stars reveal [Sr/Ba] abundance ratios
close to [Srw+r/Bar] = -0.10. Is this similarity accidental? Or is it
because the efficiency of the weak s-process becomes more significant at [Fe/H]
 ? An alternative possibility would be that the second Sr source is the
-rich freeze-out, as detailed by Woosley & Hoffman (1992);
this mechanism is predicted to synthesize elements up to the Sr region, and as a
primary process should not be extinguished at low metallicity. More theoretical
work will be required to answer these questions.
? An alternative possibility would be that the second Sr source is the
-rich freeze-out, as detailed by Woosley & Hoffman (1992);
this mechanism is predicted to synthesize elements up to the Sr region, and as a
primary process should not be extinguished at low metallicity. More theoretical
work will be required to answer these questions.
Only one halo star, BD2476, reveals a clear Sr underabundance
relative to Ba with [Sr/Ba] = -0.34. The two CH subgiants from McWilliam's
(1998) sample show [Sr/Ba] < -0.4. Does it mean these stars formed far
from the weak s-process sites?
Europium is overabundant relative to barium in thick disk stars with
[Eu/Ba] abundance ratios between 0.56 and 0.35. We first note a slight decline
of this ratio with increasing metallicity: [Eu/Ba] reduces by about 0.1-0.15 dex as [Fe/H] grows from -1 to -0.3.
This means that the r-process
remained dominant in heavy element production during thick disk evolution. At
the same time, evolved low mass stars started to enrich the interstellar
gas by s-nuclei of Ba. The decrease of the [Eu/Ba] ratio by 0.1-0.15 dex
constitutes a constraint to the duration of that phase. From the small
contribution of the s-process to Ba production we conclude that, similar to the
halo, the thick disk population formed in the early Galaxy, when high mass
stars were the main sites of nucleosynthesis. Keeping in mind the evolution time
of AGB star progenitors we suppose that the duration of halo and thick
disk formation was not much longer than 1 Gyr. This conclusion is in good
agreement with ages of the three thick disk subgiants of our sample obtained by
Bernkopf et al. (2001) on the base of recently improved stellar
interior calculations. Bernkopf et al. (2001) give 13.8
1.3 Gyr,
13.5
1.3 Gyr and 12.5
1.1 Gyr for the thick disk subgiants HD3795,
HD10519 and HD222794, respectively. It is also compatible with age estimates
for halo stars based on the detection of the Th II 4019 line in
spectra of very metal-poor stars of Sneden et al. (1996) and Cowan et al.
(1999) who have obtained an average age of 15.6
4.6 Gyr for the
two stars CS22892-052 ([Fe/H]
)
and HD115444 ([Fe/H]
 ); Sneden et al. (2000) also have determined an age of 14
3 Gyr for the stars in M 15. Recently Cayrel et al. (2001) have
detected the U II 3859.57 line in the very metal-poor star
CS31082-0018, and using uranium abundance as a cosmochronometer have estimated
an age of this star as 12.5
3 Gyr. As Spite (2001) kindly informed
us, the gf-value of the U II line has been revised since the publication
of Cayrel et al. (2001) result and the age is now 13.2
2 Gyr.
Thus, within error bars the thick disk stellar
population is as old as the halo. We note further that the halo and thick disk
stars' ages agree well with the recent cosmological age estimates, based on
high-redshift supernovae, of 14.9
1.5 Gyr (Perlmutter et al.
1999) and 14.2
1.7 Gyr (Riess et al. 1998).
); Sneden et al. (2000) also have determined an age of 14
3 Gyr for the stars in M 15. Recently Cayrel et al. (2001) have
detected the U II 3859.57 line in the very metal-poor star
CS31082-0018, and using uranium abundance as a cosmochronometer have estimated
an age of this star as 12.5
3 Gyr. As Spite (2001) kindly informed
us, the gf-value of the U II line has been revised since the publication
of Cayrel et al. (2001) result and the age is now 13.2
2 Gyr.
Thus, within error bars the thick disk stellar
population is as old as the halo. We note further that the halo and thick disk
stars' ages agree well with the recent cosmological age estimates, based on
high-redshift supernovae, of 14.9
1.5 Gyr (Perlmutter et al.
1999) and 14.2
1.7 Gyr (Riess et al. 1998).
Strontium is slightly overabundant relative to barium in the thick disk stars
with the mean value [Sr/Ba] = 0.05
0.05. This could be due to a
strengthening of the weak s-process with increasing overall metallicity.
Theoretical studies of the weak s-process are required to test this idea.
This study confirms the step-like decrease of the [Eu/Ba] abundance ratio
at the thick-to-thin disk transition found in our previous analysis (Paper I).
In the region of overlapping metallicities the [Eu/Ba] ratios in the thin disk
stars are lower on average by 0.25 dex compared with the thick disk stars. This finding is indicative of a phase of ceased star formation before the onset
of the thin disk formation during which r-process element production stopped
but s-process nuclei of Ba were synthesized in evolved low mass stars. The
duration of this intermediate phase can be evaluated from calculations of the
s-process nucleosynthesis in AGB stars, and our [Ba/Fe] (Fig. 1) and
[Eu/Ba] (Fig. 8) ratios provide observational constraints. Such a
hiatus in star formation was suggested by Gratton et al. (1996) and
Fuhrmann (1998) on the base of the [/Fe] abundance ratio
analyses. Direct evidence of a star formation gap between thick and thin disk of
no less than 3 Gyr is given by Bernkopf et al. (2001). They have
obtained stellar ages between 6.8 and 8.1 Gyr for the three thin disk subgiants
and between 12.5 and 13.8 Gyr for the thick disk subgiants mentioned above.
Thus, from the point of view of their chemical history and age the thick disk
stellar population is much closer to the halo than to the thin disk stellar
population.
The thin disk stars show a steep decline of the [Eu/Ba] abundance ratios with
increasing metallicity: [Eu/Ba] is reduced by about 0.35 dex as one goes from
![$\rm [Fe/H] = -0.5$](/articles/aa/full/2001/34/aa1288/img153.gif) to 0.25. These data indicate that evolved low mass stars now
produce larger masses of s-process elements as compared with the return of
r-elements from high mass stars, well in agreement with the thin disk IMF and
the long timescale of about 9 Gyr. Sr nearly follows Ba in the thin disk stars
and this confirms again that the main s-process now becomes dominant in the
production of these elements.
to 0.25. These data indicate that evolved low mass stars now
produce larger masses of s-process elements as compared with the return of
r-elements from high mass stars, well in agreement with the thin disk IMF and
the long timescale of about 9 Gyr. Sr nearly follows Ba in the thin disk stars
and this confirms again that the main s-process now becomes dominant in the
production of these elements.
In Paper I we have first reported an overabundance of Eu relative to Mg in two
halo stars. One halo star added in this study, HD103095, shows the same
overabundance with [Eu/Mg] = 0.27. Moreover, there is a marginal tendency
towards a higher [Eu/Mg] ratio in the "early'' thick disk stars (the mean value
[Eu/Mg] = 0.04
0.05 at [Fe/H] < -0.65) compared with the "late'' thick
disk stars (the mean value [Eu/Mg] = -0.05
0.04 at the near solar Mg
abundances, except for HD3795 with [Eu/Mg] = 0.17).
The knowledge of the [Eu/Mg] abundance ratio in the oldest stars of the Galaxy
is of great importance for an estimate of the timescale for early Galaxy
formation. Theoretical predictions of SN II element yields show that
[/Fe] increases with increasing progenitor mass (Arnett 1991).
Most theoretical models of r-process nucleosynthesis
are based on low mass (8-12 )
supernovae (Mathews & Cowan
1990; Tsujimoto & Shigeyama 1998; Travaglio et al.
1999). Ishimaru & Wanajo (1999) constrain the mass range of
SNe for the r-process site by either 8-10
or
 .
If the production of Eu is related to low mass SNe while Mg is produced in
larger amounts in high-mass SNe we should expect an underabundance and,
certainly, not an overabundance of Eu relative to Mg in the oldest stars of the
Galaxy. We have inspected europium and magnesium abundances available in the
literature. For a sample of 12 halo stars with [Fe/H] from -2.66 to -1.48 from
Magain's (1989) work the [Eu/Mg] abundance ratios vary from -0.01 to 0.51
with the mean value [Eu/Mg] = 0.18. Only one star, HD140283, shows an
underabundance of Eu relative to Mg of 0.30 dex, however, for the same star Ryan
et al. (1996) give [Eu/Mg] = 0.33. A surprisingly large spread in [Eu/Mg]
can be found in the McWilliam et al. (1995) and Ryan et al.
(1996) data for very metal-poor stars. In the first paper the [Eu/Mg]
ratios vary from -0.52 to 1.95 for the sample of 14 stars and in the second one
from 0.15 to 1.86 for a sample of 12 stars with one star revealing [Eu/Mg] = -1.
At the same time, we note a large divergence of elemental abundances between
these two studies for stars in common. For example, for CS22952-015 ([Fe/H
.
If the production of Eu is related to low mass SNe while Mg is produced in
larger amounts in high-mass SNe we should expect an underabundance and,
certainly, not an overabundance of Eu relative to Mg in the oldest stars of the
Galaxy. We have inspected europium and magnesium abundances available in the
literature. For a sample of 12 halo stars with [Fe/H] from -2.66 to -1.48 from
Magain's (1989) work the [Eu/Mg] abundance ratios vary from -0.01 to 0.51
with the mean value [Eu/Mg] = 0.18. Only one star, HD140283, shows an
underabundance of Eu relative to Mg of 0.30 dex, however, for the same star Ryan
et al. (1996) give [Eu/Mg] = 0.33. A surprisingly large spread in [Eu/Mg]
can be found in the McWilliam et al. (1995) and Ryan et al.
(1996) data for very metal-poor stars. In the first paper the [Eu/Mg]
ratios vary from -0.52 to 1.95 for the sample of 14 stars and in the second one
from 0.15 to 1.86 for a sample of 12 stars with one star revealing [Eu/Mg] = -1.
At the same time, we note a large divergence of elemental abundances between
these two studies for stars in common. For example, for CS22952-015 ([Fe/H
 -3.4) McWilliam et al. and Ryan et al. obtain [Mg/Fe] = -0.18 and
0.38, respectively; for CS22968-014 ([Fe/H
-3.4) [Mg/Fe] = -0.06
and 0.64; for CS22885-096 ([Fe/H
-3.8) Ryan et al. find an
overabundance of Eu relative to Fe of 1 dex while McWilliam et al. cannot even
measure the Eu II lines. Thus, much more observational work will be
required to improve europium to magnesium abundance ratios in halo stars. A
large spread in [Eu/Mg] for very metal-poor stars, if it exists, indicates
different sites for Mg and Eu production and quite insufficient mixing of the
interstellar gas in the early Galaxy.
-3.4) McWilliam et al. and Ryan et al. obtain [Mg/Fe] = -0.18 and
0.38, respectively; for CS22968-014 ([Fe/H
-3.4) [Mg/Fe] = -0.06
and 0.64; for CS22885-096 ([Fe/H
-3.8) Ryan et al. find an
overabundance of Eu relative to Fe of 1 dex while McWilliam et al. cannot even
measure the Eu II lines. Thus, much more observational work will be
required to improve europium to magnesium abundance ratios in halo stars. A
large spread in [Eu/Mg] for very metal-poor stars, if it exists, indicates
different sites for Mg and Eu production and quite insufficient mixing of the
interstellar gas in the early Galaxy.
As our sample of halo stars is small (3 stars) we can draw only a preliminary
conclusion that our data on the [Eu/Mg] abundance ratios in the halo and "early''
thick disk stars complemented by the data available in the literature do
not support theoretical models of the r-process based on low mass SNe. Assume
that Eu is mostly produced in the higher mass SNe compared with Mg. In this case
a timescale for the galactic halo is defined by a time delay of SNe II producing
Mg and it cannot be larger than 20 million years which is the evolution time
of 8
mass star (Massevich & Tutukov 1988). Therefore the halo
formation phase may indeed be much shorter than the 0.3-0.6 Gyr deduced above
from the analysis of the [Eu/Ba] abundance ratios.
Summing up the above results we imagine the following scenario of the Galaxy
evolution. The first stellar population of the Galaxy consisted of very
high-mass stars and produced heavy elements with a higher efficiency for the
r-process elements compared with elements or iron. Thus the
interstellar gas, out of which the second stellar population (halo) formed, had
[Eu/Mg] > 0, [Eu/Fe] > 0 and [Mg/Fe] > 0. The halo stellar population
formed during a very short interval comparable to the evolution time of
progenitors of those SNe II responsible for Mg production. The question then is:
what are masses of these progenitors? The halo formation was characterized by a
very high star formation rate. During this phase r-, -elements and iron
were produced with nearly the same efficiency and, probably, in common sites, so
that the [Mg/Fe], [Eu/Fe] and [Eu/Mg] ratios kept their values. Until the onset
of thick disk formation the progenitors of SNe II, which are the major producers
of magnesium, have evolved and the [Eu/Mg] abundance ratio decreases in the
"early'' thick disk stars (Fig. 8, bottom panel).
As the evolution time of SNe II progenitors is not longer than 20 million
years
therefore the onset of the thick disk refers to the early Galaxy.
The timescale for the thick disk formation is probably of the order
of 1 Gyr.
During this phase iron starts to be produced in SNe I and its
production rate is higher than that for Eu resulting in a steep decline of
[Eu/Fe] with [Fe/H] (Fig. 2, top panel); the production rate of iron
is also higher than for Mg (there is evidence of a slight decline of the [Mg/Fe]
and [/Fe] abundance ratios with metallicity in the figures of Bernkopf et al.
2001; Prochaska et al. 2000). The heavy elements beyond the
iron group are mainly produced by the r-process in high mass SNe II, however,
the main s-process nuclei appear. The decrease of the [Eu/Ba] ratio by about
0.1-0.15 dex implies a constraint to the duration of the thick disk formation
phase. Then star formation in our Galaxy stopped for about 3 Gyr (according to
Bernkopf et al. 2001). Europium abundances [Eu/H] (Fig. 2,
bottom panel) and Mg abundances [Mg/H] (Bernkopf et al. 2001) remained constant
during this phase while iron and the main s-process elements such as Ba
continued to be produced in evolved lower-mass stars. The decrease by about 0.25
dex of the [Eu/Ba] ratio at the thick-to-thin disk transition provides an
independent method to estimate the duration of that intermediate phase. The thin
disk phase then was characterized by the higher iron production rate compared
with that for - (Fuhrmann 1998) and r-elements (Fig.
2, top panel). In turn, the main s-process elements were produced
during this phase with a larger efficiency compared with iron (Table 2).
The suggested scenario based on the chemical history of the Galaxy will be useful to develop a realistic model of the Galaxy evolution taking into consideration physical and dynamical parameters of the galactic stellar populations. One of the important and unsolved problems of the Galaxy's chemical evolution concerns the astrophysical site for the r-process; it requires further work in stellar evolution, nuclear physics and stellar spectroscopy. Yet it is somewhat surprising that 40 years after the trailblazing work of Eggen et al. (1962) we return to very much the same conclusions, however, with at least one more population than was known at that time.
Acknowledgements
M. L. acknowledges with gratitude the Max-Planck-Institut of Astrophysics for the partial support of this study and the Institute of Astronomy and Astrophysics of Munich University for warm hospitality during a productive stay in July-September 2000. M. L. thanks especially Rolf-Peter Kudritzki for his support. We thank Klaus Fuhrmann for providing reduced FOCES spectra and parameters for most of the stars investigated in this paper, for valuable help and useful discussions, and for comments on the manuscript of this paper. We are grateful to Andreas Korn for providing reduced FOCES spectra and parameters for the three stars and to Johannes Reetz for providing the SIU code for synthetic spectrum computations. We report with sorrow the death of Michael Pfeiffer who designed and built the échelle spectrograph FOCES, on which our present results are based. M. L. has been partially supported by the Russian Basic Researches Fund (grant 99-02-17488).