A&A 375, 805-813 (2001)
DOI: 10.1051/0004-6361:20010920
J.-M. Deharveng 1 - V. Buat1 - V. Le Brun1 - B. Milliard1 - D. Kunth2 - J. M. Shull3 - C. Gry1,4
1 - Laboratoire d'Astrophysique de Marseille,
Traverse du Siphon, Les Trois Lucs,
BP 8, 13376 Marseille Cedex 12, France
2 -
Institut d'Astrophysique de Paris,
98bis boulevard Arago, 75014 Paris, France
3 -
Center for Astrophysics and Space Astronomy, Department
of Astrophysical and Planetary Sciences,
University of Colorado,
Boulder, CO 80309, USA
4 -
ISO Data Center, ESA Astrophysics Division, PO Box 50727,
28080 Madrid, Spain
Received 16 March 2001 / Accepted 14 June 2001
Abstract
We present Far Ultraviolet Spectroscopic Explorer
observations of the star-forming galaxy Mrk 54 at
z = 0.0448. The
Lyman continuum radiation is not detected above the
H I absorption edge
in our Galaxy. An upper limit is evaluated by comparison with
the background
measured in regions of the detector adjacent to the observed
spectrum. A spectral window of 16 Å,
reasonably free of additional H I Lyman series line absorption,
is used. No correction is needed for molecular hydrogen
absorption in our Galaxy but a foreground extinction of 0.29 mag is
accounted for. An upper limit of
![]() ergcm-2s-1A-1 is obtained for the flux
at
ergcm-2s-1A-1 is obtained for the flux
at ![]() 900 Å in the rest frame of Mrk 54. By comparison with
the number of ionizing photons derived from the H
900 Å in the rest frame of Mrk 54. By comparison with
the number of ionizing photons derived from the H![]() flux, this limit translates into an upper limit of
flux, this limit translates into an upper limit of
![]() for the fraction of Lyman continuum
photons that escape the galaxy without being absorbed by
interstellar material. This limit compares with the limits
obtained in three other nearby galaxies and is
compatible with the escape fractions predicted by models.
The upper limits obtained in nearby galaxies contrasts with the detection
of Lyman continuum flux in the composite spectrum of Lyman-break
galaxies at
for the fraction of Lyman continuum
photons that escape the galaxy without being absorbed by
interstellar material. This limit compares with the limits
obtained in three other nearby galaxies and is
compatible with the escape fractions predicted by models.
The upper limits obtained in nearby galaxies contrasts with the detection
of Lyman continuum flux in the composite spectrum of Lyman-break
galaxies at
![]() .
The difficulties and implications
of a comparison are discussed.
.
The difficulties and implications
of a comparison are discussed.
Key words: galaxies: individual: Mrk 54 - intergalactic medium - galaxies: ISM - galaxies: starburst - ultraviolet: galaxies
It is not yet clear whether hot and massive stars forming in galaxies contribute significantly to the ionizing background radiation in the universe, and how this contribution evolves as a function of redshift (e.g. Bechtold et al. 1987; Miralda-Escudé & Ostriker 1990; Meiksin & Madau 1993; Madau & Shull 1996; Haardt & Madau 1996; Shull et al. 1999). Specifically, at redshifts z > 3, the early formation of galaxies is expected to compensate for the decline in the quasar contribution and to play a role in the re-ionization of the IGM (e.g. Madau et al. 1999).
Direct observations of galaxies below the Lyman break have been scarce
so far. With the Hopkins Ultraviolet Telescope
(HUT), Leitherer et al. (1995), Hurwitz et al. (1997)
obtained upper limits on the Lyman continuum (LyC) radiation
in four
nearby star-forming galaxies. By comparison
with the H![]() emission these data were
interpreted in terms of limits on the LyC escape fraction, a parameter
giving the fraction of hydrogen-ionizing photons effectively
released into the IGM.
Recently Steidel et al. (2001) reported the detection of the
LyC radiation in a composite spectrum of Lyman break galaxies
at
emission these data were
interpreted in terms of limits on the LyC escape fraction, a parameter
giving the fraction of hydrogen-ionizing photons effectively
released into the IGM.
Recently Steidel et al. (2001) reported the detection of the
LyC radiation in a composite spectrum of Lyman break galaxies
at
![]() that was
also interpreted in terms of LyC escape fraction but by comparison
with the (1500 Å) UV continuum. A preliminary account of
the Space Telescope Imaging Spectrograph
(STIS) observations of galaxies in the Hubble Deep Field (HDF),
with implications
for the LyC escape fraction, has been presented by Ferguson (2001)
while this paper was nearing completion.
that was
also interpreted in terms of LyC escape fraction but by comparison
with the (1500 Å) UV continuum. A preliminary account of
the Space Telescope Imaging Spectrograph
(STIS) observations of galaxies in the Hubble Deep Field (HDF),
with implications
for the LyC escape fraction, has been presented by Ferguson (2001)
while this paper was nearing completion.
In the absence of a large number of observations
that would directly provide the LyC luminosity function and
the LyC luminosity density of galaxies, the LyC escape fraction
is seen as a crucial parameter.
Combined with the H![]() or UV luminosity densities of galaxies
or with
the stellar ionizing radiation calculated from evolutionary
synthesis models (e.g. Bruzual
& Charlot 1993; Leitherer et al. 1999) or
from the rate of chemical enrichment in the universe (Cowie 1988;
Songaila et al. 1990; Madau & Shull 1996),
the LyC escape fraction provides
the amount of ionizing radiation
effectively released into the IGM by the galaxies.
As this parameter encapsulates a number
of complex and random factors it is probably highly variable from
galaxy to galaxy; its full understanding and sound utilisation
would also require a large number of observations.
or UV luminosity densities of galaxies
or with
the stellar ionizing radiation calculated from evolutionary
synthesis models (e.g. Bruzual
& Charlot 1993; Leitherer et al. 1999) or
from the rate of chemical enrichment in the universe (Cowie 1988;
Songaila et al. 1990; Madau & Shull 1996),
the LyC escape fraction provides
the amount of ionizing radiation
effectively released into the IGM by the galaxies.
As this parameter encapsulates a number
of complex and random factors it is probably highly variable from
galaxy to galaxy; its full understanding and sound utilisation
would also require a large number of observations.
The Far Ultraviolet Spectroscopic Explorer (FUSE)
has recently opened again an access into the far ultraviolet
down to 905 Å, allowing the possibility to observe
the LyC radiation of low redshift galaxies above the
912 Å Lyman limit of H I
photoelectric absorption in our Galaxy.
As shown by the re-analysis of
HUT data by Hurwitz et al. (1997), getting rid of
photoelectric absorption in our Galaxy above the Lyman edge is not enough
and gas-phase
absorption in our Galaxy, essentially from convergent H I
Lyman series
and the Lyman and Werner bands of
molecular hydrogen, has to be accounted for,
in addition to dust extinction.
It is an area where the high spectral resolution of
FUSE can help, even though the increased background contribution per
wavelength unit makes the detection of faint continua
more difficult than at low resolution.
In the following, we report the FUSE observations of a star-forming
galaxy Mrk 54, at a redshift
z = 0.0448 that places the Lyman break
at 952.5 Å
above the Galactic Ly![]() absorption feature, reasonably beyond
the convergent H I Lyman series.
absorption feature, reasonably beyond
the convergent H I Lyman series.
The observations of Mrk 54 (GI program
A052) were obtained on Feb. 19-20, 2000 in the time-tagged photon address mode with
the object in the large (30
![]()
![]() )
aperture. The observations were split into 15 exposures
between occultation periods and passages through
the South Atlantic Anomaly, and generally extended
over spacecraft night and day.
The total duration was 27502 s.
Details of the FUSE instrument and on-orbit performance
have been given by Moos et al. (2000) and Sahnow et al. (2000).
)
aperture. The observations were split into 15 exposures
between occultation periods and passages through
the South Atlantic Anomaly, and generally extended
over spacecraft night and day.
The total duration was 27502 s.
Details of the FUSE instrument and on-orbit performance
have been given by Moos et al. (2000) and Sahnow et al. (2000).
The summed and calibrated spectrum of Mrk 54
is consistent at long wavelength with the
IUE observations (Kinney et al. 1993) and reaches
a maximum flux of about
![]() ergcm-2s-1A-1 at
ergcm-2s-1A-1 at ![]() 1100 Å.
At wavelengths shorter than 1000 Å the flux
decreases rapidly and below 960 Å the signal, if any,
becomes extremely weak (Fig. 1); actually it drops to below zero
between the Lyman-series airglow lines with the
uniform background correction of 1 count
1100 Å.
At wavelengths shorter than 1000 Å the flux
decreases rapidly and below 960 Å the signal, if any,
becomes extremely weak (Fig. 1); actually it drops to below zero
between the Lyman-series airglow lines with the
uniform background correction of 1 count![]() cm-2s-1 applied by
the standard calibration pipeline. The faint level
between the redshifted Lyman break of the galaxy
911.7 (
1+0.0448) = 952.5 Å and about 960 Å is
probably due to the accumulation of Lyman series
absorption lines in the galaxy itself. These lines
are resolved from Ly
cm-2s-1 applied by
the standard calibration pipeline. The faint level
between the redshifted Lyman break of the galaxy
911.7 (
1+0.0448) = 952.5 Å and about 960 Å is
probably due to the accumulation of Lyman series
absorption lines in the galaxy itself. These lines
are resolved from Ly![]() to Ly7
(Ly
to Ly7
(Ly![]() and Ly
and Ly![]() are not shown in Fig. 1).
are not shown in Fig. 1).
![\begin{figure}
\par\includegraphics[width=8.4cm,clip]{ms1286f1.eps} \end{figure}](/articles/aa/full/2001/33/aa1286/img19.gif) |
Figure 1:
FUSE spectrum of Mrk 54 resulting from the co-addition
of 15 SiC2A spectra for a total exposure time of 27502 s and at 0.2 Å
linear rebinning. The Lyman series absorption
lines resolved in Mrk 54 are marked, except for Ly6 confused with
the Ly |
| Open with DEXTER | |
For the purpose of discussing the LyC radiation of the galaxy Mrk 54 we have concentrated our analysis on the SiC channels and specifically the SiC1B and SiC2A spectra. We have screened the raw time-tag data of segments 1B and 2A for the presence of so-called bursts, using for each of the 15 exposures both the images of the events and the time series of the total number of counts. The latter has shown some increase of the count rate at the end of a few exposures: as these features were not typical burst events we decided not to remove them from the time-tag data (even for the most significant in exposure 13). We made no attempt to isolate night-only data.
![\begin{figure}
\par\includegraphics[width=8.4cm,clip]{ms1286f2.eps}\end{figure}](/articles/aa/full/2001/33/aa1286/img20.gif) |
Figure 2: Details of the previous spectrum (rebinned at 0.1 Å), showing (dotted line) the three spectral windows (16 Å total) used for obtaining an upper limit to the LyC of Mrk 54. Tentative identifications of the airglow lines based on Feldman et al. (2000) are indicated. |
| Open with DEXTER | |
In the absence of any clear signal from the redshifted
LyC of the galaxy (shortward of 952.5 Å)
we have tried to place an upper limit to this flux. A first step
is to determine spectral windows
that are free from additional
absorption by
neutral hydrogen in our Galaxy (Hurwitz et al. 1997).
As discussed by these latter authors, it is a complex
issue given the lack of information regarding
low column density clouds at velocities departing
significantly from that of the bulk of the H I.
The examples given by Hurwitz et al. (1997) and
by Lockman & Savage (1995) as well as the examination of
the list of high-velocity clouds of Stark et al. (1992)
lead us to conclude that removing ![]() 200 kms-1 on either side of the Lyman series absorption lines
is probably safe enough. This selection removes the
H I nightglow lines located right at the
rest wavelengths of the potential absorption lines.
A comparison of our spectrum with
the reference airglow spectrum of Feldman et al. (2000)
shows that we
should also avoid a few O I lines close to H I lines and
discard a slightly larger wavelength domain
shortward of each Lyman series absorption line. This
corresponds to a velocity of
200 kms-1 on either side of the Lyman series absorption lines
is probably safe enough. This selection removes the
H I nightglow lines located right at the
rest wavelengths of the potential absorption lines.
A comparison of our spectrum with
the reference airglow spectrum of Feldman et al. (2000)
shows that we
should also avoid a few O I lines close to H I lines and
discard a slightly larger wavelength domain
shortward of each Lyman series absorption line. This
corresponds to a velocity of ![]() -500 kms-1,
making our previous limit even safer on the side of negative velocities.
With the constraints adopted, it is not possible
to extend our study shortward of Ly7 (926.2 Å).
We practically end up with
a window of 16 Å, total, split into three domains,
927-929 Å, 931.5-936 Å and 938.5-948 Å
by the Lyman series lines Ly6 930.7 Å, Ly
-500 kms-1,
making our previous limit even safer on the side of negative velocities.
With the constraints adopted, it is not possible
to extend our study shortward of Ly7 (926.2 Å).
We practically end up with
a window of 16 Å, total, split into three domains,
927-929 Å, 931.5-936 Å and 938.5-948 Å
by the Lyman series lines Ly6 930.7 Å, Ly![]() 937.8 Å and Ly
937.8 Å and Ly![]() 949.7 Å (Fig. 2).
We have calculated the total raw counts in this window
for each of the 15 SiC1B and 15 SiC2A extracted spectra.
949.7 Å (Fig. 2).
We have calculated the total raw counts in this window
for each of the 15 SiC1B and 15 SiC2A extracted spectra.
These raw counts can be compared with those obtained in reference zones, defined in the 15 images of segments 1B and 2A built from the corresponding raw ttag data (Fig. 3). These reference zones, supposed to represent the background at the time of observations, have been searched as close as possible to the detector areas where the sky observations are made. Our search was guided by the examination of profiles integrated over a large number of lines or columns of the co-added (15) images in order to avoid detector edge effects and airglow lines in the smaller apertures. We end up with three areas of respectively 542101, 1023701 and 737751 pixels in the 1B segment and 322361, 610151 and 443631 pixels in the 2A segment. In these zones the counts are found to follow Poisson statistics extremely well.
![\begin{figure}
\par\includegraphics[width=7cm,clip]{ms1286f3.eps} \end{figure}](/articles/aa/full/2001/33/aa1286/img23.gif) |
Figure 3:
Comparison of
the sky raw counts (open circle) in the 16 Å window
defined in the text with
the background counts
in three reference zones (solid dots). These zones are
displayed in the same relative order for each 15 exposures.
For the purpose of comparison all counts have been expressed
into units of counts cm-2s-1
using the respective exposure times,
the surface of the extracting windows for the sky counts,
the number of pixels and their linear
size (respectively
|
| Open with DEXTER | |
Three features stand out in Fig. 3. First, given their
(1![]() )
error bars the three background
measurements are neither significatively different in each exposures
nor show systematic variation pattern. This is taken as a good
indication that the background is reasonably uniform,
at least at the scale and in the zones we are using.
In contrast, there are significant variations of the background
measurements (departing from purely Poisson statistics) from exposure
to exposure that can be understood by differences in observing conditions.
Third, the target measurements follow the same trend as the background
from exposure to
exposure (except may be for exposure 7) and, given their larger
error bars, do not appear significantly different from the background
measurements.
)
error bars the three background
measurements are neither significatively different in each exposures
nor show systematic variation pattern. This is taken as a good
indication that the background is reasonably uniform,
at least at the scale and in the zones we are using.
In contrast, there are significant variations of the background
measurements (departing from purely Poisson statistics) from exposure
to exposure that can be understood by differences in observing conditions.
Third, the target measurements follow the same trend as the background
from exposure to
exposure (except may be for exposure 7) and, given their larger
error bars, do not appear significantly different from the background
measurements.
These findings justify the use of
our evaluation of the background in each image
to correct the sky measurement.
The error bars on the resulting net counts in each exposure
combine quadratically the error bar on the sky measurements and those
on the background scaled to the surface of the sky measurements;
they are dominated by the uncertainties on the sky measurements based
on a smaller number of pixels. The error bars of each 15 exposures
are then combined
quadratically and divided by the total exposure time to give the
dispersion on the net count rate.
We obtain a mean net count rate of
![]() count
count![]() s-1 with a 1
s-1 with a 1![]() dispersion of
dispersion of
![]() count
count![]() s-1and
s-1and
![]() count
count![]() s-1 with a 1
s-1 with a 1![]() dispersion of
dispersion of
![]() count
count![]() s-1 in the 16 Å
window of segments 1B and 2A respectively. The fact that the
mean count rates are smaller than the dispersion confirms quantitatively the
trends discussed above. Under these conditions the net count rate dispersion
can be used to set an upper limit on the flux of Mrk 54
at
s-1 in the 16 Å
window of segments 1B and 2A respectively. The fact that the
mean count rates are smaller than the dispersion confirms quantitatively the
trends discussed above. Under these conditions the net count rate dispersion
can be used to set an upper limit on the flux of Mrk 54
at ![]() 900 Å (rest-frame).
Combining the two segments and converting the counts into flux
(using an effective area of the order of 17 cm2
at
900 Å (rest-frame).
Combining the two segments and converting the counts into flux
(using an effective area of the order of 17 cm2
at ![]() 940 Å, according
to the on-orbit performance reported by Sahnow et al. 2000) we get a
3
940 Å, according
to the on-orbit performance reported by Sahnow et al. 2000) we get a
3![]() upper limit of
upper limit of
![]() ergcm-2s-1A-1.
We have carried out all these calculations in counts rather than calibrated
flux units in order to stay closer to basic count statistics.
This advantage offsets the slight inaccuracy of
converting counts into fluxes for the entire spectral window.
ergcm-2s-1A-1.
We have carried out all these calculations in counts rather than calibrated
flux units in order to stay closer to basic count statistics.
This advantage offsets the slight inaccuracy of
converting counts into fluxes for the entire spectral window.
We need first to correct our upper limit flux
from any absorption that would
not take place in the object but rather along its line of sight
in the intergalactic medium or in our Galaxy.
At the low redshift of Mrk 54 the intergalactic medium opacity can be
neglected. As to the gas-phase absorption in our Galaxy, we have seen that
the choice of our 16 Å spectral window makes significant
absorption by neutral hydrogen unlikely.
Most of the known interstellar metal lines,
especially O I, are also found to be avoided and the equivalent
width of the corresponding absorption is negligible with respect to the
width of the window. For the molecular hydrogen
that FUSE has shown to be present along most of the extragalactic
lines of sight (Shull et al. 2000) we have searched for the
presence of the most significant R(0) and R(1) lines
of the low-rotational levels of the
Lyman and Werner bands, following the identifications
in the line of sight of ESO 141-055 (Shull et al. 2000)
and the tables of
Barnstedt et al. (2000).
We found no clear identifications even in
the brightest parts of the spectrum. By comparison with the examples of
ESO 141-055 and Mrk 876 (Shull et al. 2000) we conclude that
![]() cm-2 in
the direction of Mrk 54.
A difficulty of this comparison comes from the fact that the spectra of
ESO 141-055 and Mrk 876 have better signal to noise ratio than Mrk 54
(the objects are approximately two times brighter and
the exposure times two times longer).
We have used the on-line spectral simulator
to explore how the detection is
affected by these differences and found
that a H2 column density of
cm-2 in
the direction of Mrk 54.
A difficulty of this comparison comes from the fact that the spectra of
ESO 141-055 and Mrk 876 have better signal to noise ratio than Mrk 54
(the objects are approximately two times brighter and
the exposure times two times longer).
We have used the on-line spectral simulator
to explore how the detection is
affected by these differences and found
that a H2 column density of
![]() cm-2 would still
have been detected in the conditions of
our Mrk 54 spectrum. If we give up any comparison
with observed spectra and use the simulator alone, a lower limit
of
cm-2 would still
have been detected in the conditions of
our Mrk 54 spectrum. If we give up any comparison
with observed spectra and use the simulator alone, a lower limit
of
![]() cm-2 is found.
We have then used the simulator to directly calculate the fraction of energy
that such H2 column densities would absorb into our specific window of
16 Å; we found a fraction of 0.015 for
cm-2 is found.
We have then used the simulator to directly calculate the fraction of energy
that such H2 column densities would absorb into our specific window of
16 Å; we found a fraction of 0.015 for
![]() cm-2
and 0.043 for the more conservative limit of
cm-2
and 0.043 for the more conservative limit of
![]() cm-2.
We have therefore applied no correction for H2 absorption
to our upper limit on the
LyC of Mrk 54. This case may well be a fortunate
circumstance given the galactic H2 column densities
currently reported for extragalactic lines of sight
(Shull et al. 2000; Vidal-Madjar et al.
2000).
In the absence of a control of
the amount of H2 along the line of sight, that FUSE now offers,
previous measurements may well have been affected by this problem.
If accounted for, the H2 contamination would have led
to even less restrictive limits on the LyC
escape fraction than established by Hurwitz et al. (1997).
cm-2.
We have therefore applied no correction for H2 absorption
to our upper limit on the
LyC of Mrk 54. This case may well be a fortunate
circumstance given the galactic H2 column densities
currently reported for extragalactic lines of sight
(Shull et al. 2000; Vidal-Madjar et al.
2000).
In the absence of a control of
the amount of H2 along the line of sight, that FUSE now offers,
previous measurements may well have been affected by this problem.
If accounted for, the H2 contamination would have led
to even less restrictive limits on the LyC
escape fraction than established by Hurwitz et al. (1997).
Lastly, the Galactic dust extinction is a more severe and more uncertain
factor. In contrast to the thinking for the past 17 years,
it is very likely that a residual extinction
is present at high Galactic latitudes, even in the directions
with the lowest H I column densities
(Schlegel et al. 1998). For
Mrk 54 we have adopted E(B-
V) = 0.015, as given by the NASA Extragalactic
Database on the basis of this reference. This color excess
is consistent with a low fraction of hydrogen in the molecular
state (Savage et al. 1977) and therefore with previous
limits placed on the H2 column density along
the line of sight to Mrk 54.
This results in a
foreground extinction of 0.29 mag in our far-UV window
(centered at ![]() 940 Å) using an
extrapolation of the parameterized extinction law of
Cardelli et al. (1989) shortward of 1000 Å.
Such an extrapolation is supported by the measurements of
Buss et al. (1994).
We therefore have to account for a factor of 1.306 absorption
that does not occur in Mrk 54;
our upper limit on the f(900) flux of Mrk 54 is
increased to
940 Å) using an
extrapolation of the parameterized extinction law of
Cardelli et al. (1989) shortward of 1000 Å.
Such an extrapolation is supported by the measurements of
Buss et al. (1994).
We therefore have to account for a factor of 1.306 absorption
that does not occur in Mrk 54;
our upper limit on the f(900) flux of Mrk 54 is
increased to
![]() erg
erg![]() cm-2s-1A-1.
cm-2s-1A-1.
We can now proceed with the calculation of an upper limit
on the LyC escape fraction
![]() defined as the
fraction of emitted 900 Å photons that escapes the galaxy
without being absorbed by interstellar material.
We need first to
have a relation between the f(900) flux and
the total number of LyC photons since it is this latter quantity
that can be physically constrained by
the observed H
defined as the
fraction of emitted 900 Å photons that escapes the galaxy
without being absorbed by interstellar material.
We need first to
have a relation between the f(900) flux and
the total number of LyC photons since it is this latter quantity
that can be physically constrained by
the observed H![]() flux.
Leitherer et al. (1995) have shown that there is a narrow relation,
relatively independent of star formation histories and initial mass
functions,
between the luminosity L(900) at about 900 Å and
the total number
flux.
Leitherer et al. (1995) have shown that there is a narrow relation,
relatively independent of star formation histories and initial mass
functions,
between the luminosity L(900) at about 900 Å and
the total number
![]() of LyC
photons of a burst population:
of LyC
photons of a burst population:
![]() (photons Å erg-1).
(photons Å erg-1).
Assuming 0.45 as the number of H![]() photons per recombination
(case B recombination at 104 K), we write
the number of LyC photons
photons per recombination
(case B recombination at 104 K), we write
the number of LyC photons
![]() ,
corrected by the
fraction of those escaping photoelectric absorption
(f1) or trapped by dust
before ionization (f2),
,
corrected by the
fraction of those escaping photoelectric absorption
(f1) or trapped by dust
before ionization (f2),
 |
(1) |
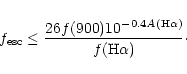 |
(2) |
This result
adds another significant limit
to three other cases with limits of 3.2%, 5.2% and 11% as obtained
with HUT and the re-analysis by Hurwitz et al. (1997) (Mrk 66 with a
limit of only 57% is left over from this comparison).
All the values obtained so far are fully compatible
with current estimates
in the range 2%-10% based either on theoretical
models (Dove & Shull 1994;
Dove et al. 2000) or the implications of
H![]() observations of the Magellanic Stream
(Bland-Hawthorn & Maloney 1999) or NGC 3067
(Tumlinson et al. 1999).
observations of the Magellanic Stream
(Bland-Hawthorn & Maloney 1999) or NGC 3067
(Tumlinson et al. 1999).
Neutral hydrogen is expected in galaxies
where active star formation is taking place
and its impact on the escape of ionizing photons
is thought to depend heavily on topology.
In Mrk 54 the neutral hydrogen is directly seen along the line of sight as
Lyman series absorption lines (down to Ly7) at the redshift of the
parent galaxy. These features are accompanied
by a number of metal absorption-lines
with different possible origins (interstellar gas,
stellar photospheres and stellar winds)
as currently found in starburst galaxies (e.g. Heckman et al.
1998 and references therein). Most of the analyses
so far have concentrated
on the features (including Ly![]() )
accessible with IUE or the spectrographs of the HST.
To the best of our knowledge, the
discussion of features blueward of Ly
)
accessible with IUE or the spectrographs of the HST.
To the best of our knowledge, the
discussion of features blueward of Ly![]() have been limited
to the O VI + Ly
have been limited
to the O VI + Ly![]() + C II profile
in the four starbursts observed with HUT (Gonzalez-Delgado et al.
1997, 1998).
+ C II profile
in the four starbursts observed with HUT (Gonzalez-Delgado et al.
1997, 1998).
Leaving a full discussion of absorption features in Mrk 54 to
another context, we have only tried to interpret
the H I Lyman series absorption profiles.
Within the uncertainties of background subtraction,
the lines appear almost black at their centers (this is less clear
with the Ly![]() and Ly
and Ly![]() lines than with the three lines displayed
in Fig. 1) and
indicate a large covering fraction of neutral hydrogen.
The determination of the neutral hydrogen column density implied
by the absorption profiles is however difficult because of the
low signal-to-noise ratio and
the possible blending with galactic interstellar lines
(not to speak of nightglow emission lines) resulting in very uncertain
continuum levels: the profile fitting allows
column densities of the order of 1021 cm-2 with
a low b Doppler parameter
as well as low column densities with b up to
lines than with the three lines displayed
in Fig. 1) and
indicate a large covering fraction of neutral hydrogen.
The determination of the neutral hydrogen column density implied
by the absorption profiles is however difficult because of the
low signal-to-noise ratio and
the possible blending with galactic interstellar lines
(not to speak of nightglow emission lines) resulting in very uncertain
continuum levels: the profile fitting allows
column densities of the order of 1021 cm-2 with
a low b Doppler parameter
as well as low column densities with b up to ![]() 300 kms-1. Large velocity spreads have already
been reported in nearby and high redshift starburst galaxies
(e.g. Gonzalez-Delgado et al. 1998;
Pettini et al. 2000).
This finally leads us to place the discussion in the context of
the large-scale outflows that have been revealed in the
interstellar media of starburst galaxies
(e.g. Heckman 2000 and references therein)
and play a role in the escape of Ly
300 kms-1. Large velocity spreads have already
been reported in nearby and high redshift starburst galaxies
(e.g. Gonzalez-Delgado et al. 1998;
Pettini et al. 2000).
This finally leads us to place the discussion in the context of
the large-scale outflows that have been revealed in the
interstellar media of starburst galaxies
(e.g. Heckman 2000 and references therein)
and play a role in the escape of Ly![]() emission
(e.g. Kunth et al. 1998). As the Ly
emission
(e.g. Kunth et al. 1998). As the Ly![]() emission often appears
redshifted with respect to absorption features,
the simplest interpretation is that
the only Ly
emission often appears
redshifted with respect to absorption features,
the simplest interpretation is that
the only Ly![]() photons that escape unabsorbed are those
backscattered from the far side of the outflow, whereas
the approaching part is seen in absorption
against the stellar continuum (Pettini et al. 2000). In
this picture, the LyC photons cannot escape in the same way as the
backscattered Ly
photons that escape unabsorbed are those
backscattered from the far side of the outflow, whereas
the approaching part is seen in absorption
against the stellar continuum (Pettini et al. 2000). In
this picture, the LyC photons cannot escape in the same way as the
backscattered Ly![]() photons but it is likely that the galactic winds
generate
holes in the H I distribution
through
which LyC photons
can also escape in different directions.
A more complete model,
including time evolution effects and accounting for the
variety of Ly
photons but it is likely that the galactic winds
generate
holes in the H I distribution
through
which LyC photons
can also escape in different directions.
A more complete model,
including time evolution effects and accounting for the
variety of Ly![]() absorption and emission profiles
observed by Kunth et al. (1998), has been developed by
Tenorio-Tagle et al. (1999); in the phase where the
conical H II region extends to the galaxy outer edge,
LyC and Ly
absorption and emission profiles
observed by Kunth et al. (1998), has been developed by
Tenorio-Tagle et al. (1999); in the phase where the
conical H II region extends to the galaxy outer edge,
LyC and Ly![]() photons should escape in the same
direction.
With only upper limits obtained so far,
and only five nearby galaxies,
it is difficult to constrain one particular model
by examining how the LyC escape fraction correlates with
the Ly
photons should escape in the same
direction.
With only upper limits obtained so far,
and only five nearby galaxies,
it is difficult to constrain one particular model
by examining how the LyC escape fraction correlates with
the Ly![]() escape and the blend of absorption and emission
at Ly
escape and the blend of absorption and emission
at Ly![]() ;
for instance the
two objects with the tightest LyC escape fraction upper limit
(Mrk 496 and IRAS 08339) both have Ly
;
for instance the
two objects with the tightest LyC escape fraction upper limit
(Mrk 496 and IRAS 08339) both have Ly![]() in emission. The only
sure conclusion of this discussion is the role of anisotropies that
act to increase the randomness of the LyC escape fraction for the
observer.
in emission. The only
sure conclusion of this discussion is the role of anisotropies that
act to increase the randomness of the LyC escape fraction for the
observer.
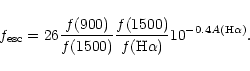
The upper limits (<10%) obtained at
![]() are in stark contrast with
a LyC escape fraction larger than 50% reported by Steidel et al.
(2001) from the detection of the
LyC radiation in a composite spectrum of Lyman break galaxies
at z = 3.4. In Steidel et al.
the LyC escape fraction is normalized
by the fraction
of 1500 Å photons that escapes. The surprisingly large value (>50%)
results from the fact that the
f(1500)/f(900) flux ratio
is, after the necessary correction for the intergalactic medium
opacity at high redshifts, close to that
predicted from spectral synthesis models without any LyC
self-absorption from neutral hydrogen in the galaxy.
The escape
fractions used at low and high redshifts are therefore
different both in reference wavelength
(the escape fraction for nearby galaxies refers to H
are in stark contrast with
a LyC escape fraction larger than 50% reported by Steidel et al.
(2001) from the detection of the
LyC radiation in a composite spectrum of Lyman break galaxies
at z = 3.4. In Steidel et al.
the LyC escape fraction is normalized
by the fraction
of 1500 Å photons that escapes. The surprisingly large value (>50%)
results from the fact that the
f(1500)/f(900) flux ratio
is, after the necessary correction for the intergalactic medium
opacity at high redshifts, close to that
predicted from spectral synthesis models without any LyC
self-absorption from neutral hydrogen in the galaxy.
The escape
fractions used at low and high redshifts are therefore
different both in reference wavelength
(the escape fraction for nearby galaxies refers to H![]() vs.
1500 Å for the Lyman break galaxies) and in the
treatment of dust extinction
(dust extinction is accounted for at H
vs.
1500 Å for the Lyman break galaxies) and in the
treatment of dust extinction
(dust extinction is accounted for at H![]() in nearby galaxies,
whereas it is not for the Lyman break galaxies).
Before trying to quantify this difference
between the escape fractions, we have first examined a
quantity that is directly observed in both cases,
the flux ratio
f(1500)/f(900).
in nearby galaxies,
whereas it is not for the Lyman break galaxies).
Before trying to quantify this difference
between the escape fractions, we have first examined a
quantity that is directly observed in both cases,
the flux ratio
f(1500)/f(900).
We have calculated
the
f(1500)/f(900) flux ratios in Mrk 54 and
the four nearby star-forming
galaxies observed with HUT (Table 1). For the comparison with the high-z
galaxies to be meaningful we have to use the f(900) upper
limit fluxes corrected for gas-phase absorption and foreground
dust extinction. As for Mrk 54, the latter correction has been based
on the E(B-V) of Schlegel et al. (1998) given in the
NED. These corrections are slightly different
from those of Leitherer et al. (1995) but the conclusions
are not changed. All steps of calculations are detailed in
the notes to Table 1.
The
f(1500)/f(900) flux ratios of the nearby objects
(Table 1 Col. 7) are found to be larger than the value obtained
by Steidel et al. (2001) from their composite spectrum of
Lyman-break galaxies
(note that their value of 4.6 translates into a value of 1.7 in the units
of Table 1). This is especially true for Mrk 54,
essentially because no correction for H I absorption
has to be applied.
| Object | f(900) | E(B-V) |
|
f(1500) |
|
|
| (2) | (3) | (4) | (5) | (6) | (7) | |
| IRAS 08339+6517 | <
|
0.092 | <
|
|
|
>6.4 |
| Mrk 1267 | <
|
0.034 | <
|
|
|
>4.2 |
| Mrk 66 | <
|
0.012 | <
|
|
|
>4.1 |
| Mrk 496 | <
|
0.020 | <
|
|
|
>4.0 |
| Mrk 54 | <
|
0.015 | <
|
|
|
>40 |
Although the escape of LyC photons is probably
highly variable from galaxy to
galaxy, the number of nearby objects is sufficient to suggest
that the escape is
easier at redshift ![]() 3.4 than at low redshift.
This trend
is now supported by similarly large
f(1500)/f(900) flux ratios recently reported
by Ferguson (2001) for seven galaxies
at
3.4 than at low redshift.
This trend
is now supported by similarly large
f(1500)/f(900) flux ratios recently reported
by Ferguson (2001) for seven galaxies
at
![]() in the HDF.
The UV luminosity may also be a factor in the sense that higher luminosity
at
in the HDF.
The UV luminosity may also be a factor in the sense that higher luminosity
at ![]() 1500 Å would imply more photons for ionizing the gas
and possibly easier escape.
The nearby galaxies have UV luminosities ranging
from
1500 Å would imply more photons for ionizing the gas
and possibly easier escape.
The nearby galaxies have UV luminosities ranging
from
![]() ergs-1Hz-1 at
ergs-1Hz-1 at ![]() 1500 Å
for Mrk 54 to ten times less. However, this largest luminosity is
similar to
the demagnified luminosity
of cB58 (Pettini et al. 2000) reported
by Steidel et al. as representative of the galaxies chosen for
the composite spectrum.
1500 Å
for Mrk 54 to ten times less. However, this largest luminosity is
similar to
the demagnified luminosity
of cB58 (Pettini et al. 2000) reported
by Steidel et al. as representative of the galaxies chosen for
the composite spectrum.
We have also examined the
f(1500)/f(900) flux
ratio obtained for the Lyman break galaxies
by Steidel et al. after correction for the IGM opacity. This ratio
implies an escape fraction (when normalized to 1500 Å) ![]() .
A smaller escape fraction in the absolute sense
might be obtained if only a
fraction of the 1500 Å photons escape
without being absorbed by dust. This argument is given by
Steidel et al. and used by Loeb & Barkana
(2000) to infer an escape fraction of
.
A smaller escape fraction in the absolute sense
might be obtained if only a
fraction of the 1500 Å photons escape
without being absorbed by dust. This argument is given by
Steidel et al. and used by Loeb & Barkana
(2000) to infer an escape fraction of ![]() 10%, close to
the limits obtained for nearby galaxies.
There is, however, a serious limitation with this explanation:
a significant dust extinction at 1500 Å would likely imply
a larger dust extinction at 900 Å and in turn a
smaller intrinsic
f(1500)/f(900) ratio,
uncomfortably small with
respect to those given by stellar population synthesis models
(e.g. Bruzual & Charlot 1993; Charlot 1996;
Leitherer et al. 1999).
The flatness (in
10%, close to
the limits obtained for nearby galaxies.
There is, however, a serious limitation with this explanation:
a significant dust extinction at 1500 Å would likely imply
a larger dust extinction at 900 Å and in turn a
smaller intrinsic
f(1500)/f(900) ratio,
uncomfortably small with
respect to those given by stellar population synthesis models
(e.g. Bruzual & Charlot 1993; Charlot 1996;
Leitherer et al. 1999).
The flatness (in ![]() )
of the composite spectrum obtained by
Steidel et al. also suggests a low extinction according to the
correlation between the ultraviolet extinction and the
slope
)
of the composite spectrum obtained by
Steidel et al. also suggests a low extinction according to the
correlation between the ultraviolet extinction and the
slope ![]() of the far-UV spectrum (Calzetti et al. 1994).
The result of Steidel et al. is puzzling in another respect. If
the escape of LyC photons is anisotropic as discussed above
and suggested by Pettini et al. (2000), it would be difficult
to have only the cases with favorable directions
appear in a composite spectrum. It is also true that the galaxies
contributing to the composite spectrum have been selected
using criteria that would favor the least extinguished and perhaps
lowest covering fraction.
of the far-UV spectrum (Calzetti et al. 1994).
The result of Steidel et al. is puzzling in another respect. If
the escape of LyC photons is anisotropic as discussed above
and suggested by Pettini et al. (2000), it would be difficult
to have only the cases with favorable directions
appear in a composite spectrum. It is also true that the galaxies
contributing to the composite spectrum have been selected
using criteria that would favor the least extinguished and perhaps
lowest covering fraction.
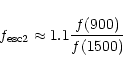
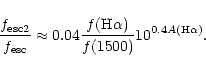
The LyC escape fraction appears in Eq. (2) as the
f(900) flux divided by the H![]() flux and is defined by Steidel
et al. as the f(900) flux normalized by the fraction of 1500 Å
photons that escapes. It is tempting to establish a relation
between these two forms of the escape fraction,
independent of the f(900) flux. Equation (2) can
be written as (neglecting the factors f1 and f2)
flux and is defined by Steidel
et al. as the f(900) flux normalized by the fraction of 1500 Å
photons that escapes. It is tempting to establish a relation
between these two forms of the escape fraction,
independent of the f(900) flux. Equation (2) can
be written as (neglecting the factors f1 and f2)
The stellar contribution to the hydrogen-ionizing background has been investigated by a number of authors and its intensity anticipated as a function of the LyC escape fraction. These results can therefore be briefly revisited in the light of present data and especially the f(1500)/f(900) ratio.
With calculations similar to those of Madau et al.
(1999) and Madau (2000), Steidel et al.
directly use their measured
f(1500)/f(900) ratio
to translate the luminosity function of Lyman break galaxies (at 1500 Å)
into a distribution of Lyman continuum luminosities. They find
that the 900-Å emissivity of galaxies at ![]() exceeds the contribution of QSOs by a factor of 5. This result supports
the role of star formation in
the early re-ionisation of the hydrogen but relies on the assumption that
the measured
f(1500)/f(900) ratio
is characteristic of the whole population of Lyman-break galaxies.
At low redshifts,
Giallongo et al. (1997) and Shull et al. (1999)
have shown that the galaxy contribution to the ionizing
background rivals that of QSOs for an escape fraction of 5%.
Such a value is compatible with the present set of upper limits
obtained with nearby star-forming galaxies.
In the same vein as above, an upper limit on
the 900-Å emissivity of galaxies at
exceeds the contribution of QSOs by a factor of 5. This result supports
the role of star formation in
the early re-ionisation of the hydrogen but relies on the assumption that
the measured
f(1500)/f(900) ratio
is characteristic of the whole population of Lyman-break galaxies.
At low redshifts,
Giallongo et al. (1997) and Shull et al. (1999)
have shown that the galaxy contribution to the ionizing
background rivals that of QSOs for an escape fraction of 5%.
Such a value is compatible with the present set of upper limits
obtained with nearby star-forming galaxies.
In the same vein as above, an upper limit on
the 900-Å emissivity of galaxies at
![]() can be
directly translated from the far-UV luminosity density of
Sullivan et al. (2000), using
the
f(1500)/f(900) ratios in Table 1.
As the data of Sullivan et al. (2000) are at 2000 Å and a
mean redshift of 0.15, we have first used relations
established by Cowie et al. (1999)
to get the emissivity
can be
directly translated from the far-UV luminosity density of
Sullivan et al. (2000), using
the
f(1500)/f(900) ratios in Table 1.
As the data of Sullivan et al. (2000) are at 2000 Å and a
mean redshift of 0.15, we have first used relations
established by Cowie et al. (1999)
to get the emissivity
![]() ergs-1Hz-1Mpc-3 at 1500 Å and
ergs-1Hz-1Mpc-3 at 1500 Å and
![]() (this would be
(this would be
![]() with
an (1+z)4 evolution factor).
With the tightest constraints of Mrk 54 in Table 1
we get a 900-Å luminosity density <
with
an (1+z)4 evolution factor).
With the tightest constraints of Mrk 54 in Table 1
we get a 900-Å luminosity density <
![]() ergs-1Hz-1Mpc-3,
which is close to the emissivity due
to galaxies evaluated
by Shull et al. (1999) for an escape fraction of 5%
that would provide a comparable background to AGN.
All the above calculations raise the issue of whether
the value used for the LyC escape fraction is representative of
the whole population of galaxies. Given all the factors
(distribution of neutral gas, orientation) that make this
parameter random,
it appears a crude oversimplification to use
a unique value for all galaxies. At the same time,
any effort to understand the
variations of this parameter
should carry the same level of difficulty as
establishing the LyC luminosity function itself.
As to the present calculations on Mrk 54 and comparison with other
nearby galaxies, it is likely, from the mere fact that
the LyC escape fraction is random, that any
average value should lie below the current upper limits. In addition,
any dust extinction decreases
the LyC escape fraction below the value expected
from neutral hydrogen absorption alone (see Eqs. (1) or (2)).
The nearby galaxies
under study, selected with significant UV flux for the prospect
of detecting ionizing radiation,
are probably not representative of the whole population in terms of
dust extinction. Such an effect would be present
when it comes to using an average escape fraction
with an H
ergs-1Hz-1Mpc-3,
which is close to the emissivity due
to galaxies evaluated
by Shull et al. (1999) for an escape fraction of 5%
that would provide a comparable background to AGN.
All the above calculations raise the issue of whether
the value used for the LyC escape fraction is representative of
the whole population of galaxies. Given all the factors
(distribution of neutral gas, orientation) that make this
parameter random,
it appears a crude oversimplification to use
a unique value for all galaxies. At the same time,
any effort to understand the
variations of this parameter
should carry the same level of difficulty as
establishing the LyC luminosity function itself.
As to the present calculations on Mrk 54 and comparison with other
nearby galaxies, it is likely, from the mere fact that
the LyC escape fraction is random, that any
average value should lie below the current upper limits. In addition,
any dust extinction decreases
the LyC escape fraction below the value expected
from neutral hydrogen absorption alone (see Eqs. (1) or (2)).
The nearby galaxies
under study, selected with significant UV flux for the prospect
of detecting ionizing radiation,
are probably not representative of the whole population in terms of
dust extinction. Such an effect would be present
when it comes to using an average escape fraction
with an H![]() luminosity density for
deriving the
LyC luminosity density of galaxies.
luminosity density for
deriving the
LyC luminosity density of galaxies.
(iii) A low escape of LyC photons
is expected in Mrk 54 from the large
covering fraction of neutral hydrogen revealed by the
Lyman series absorption lines down to Ly7. The randomness of
the LyC escape fraction as resulting from the geometry
(anisotropy in escape direction, hole in the neutral gas
distribution) and large-scale
galactic outflows is emphasized. No relation
has yet been established between the LyC and the Ly![]() emission
escape in starburst galaxies.
emission
escape in starburst galaxies.
(iv) The contrast between the
detection of significant LyC flux in a composite spectrum
of Lyman break
galaxies (Steidel et al. 2001) at
![]() and the fact that only
upper limits have been obtained in
nearby star-forming galaxies
is investigated.
The
f(1500)/f(900) flux ratio is found
to be larger in nearby galaxies than
in the composite spectrum of Steidel et al. (2001). The possible
trend of LyC photons escaping more easily at high redshifts than at low
redshifts is now supported by the STIS data at
and the fact that only
upper limits have been obtained in
nearby star-forming galaxies
is investigated.
The
f(1500)/f(900) flux ratio is found
to be larger in nearby galaxies than
in the composite spectrum of Steidel et al. (2001). The possible
trend of LyC photons escaping more easily at high redshifts than at low
redshifts is now supported by the STIS data at
![]() of Ferguson
(2001) but more and better observations of nearby galaxies
are needed to distinguish an evolution effect from selection
and random effects.
(v) In addition to an evaluation
from the H
of Ferguson
(2001) but more and better observations of nearby galaxies
are needed to distinguish an evolution effect from selection
and random effects.
(v) In addition to an evaluation
from the H![]() emissivity and the LyC escape fraction,
the 900-Å emissivity of galaxies and potentially the
ionizing background radiation can now be derived from
the measured UV luminosity density and (UV to 900 Å) ratio.
emissivity and the LyC escape fraction,
the 900-Å emissivity of galaxies and potentially the
ionizing background radiation can now be derived from
the measured UV luminosity density and (UV to 900 Å) ratio.
Acknowledgements
We thank the FUSE Team at JHU for the successful operation of such a complex instrument. J-M D thanks G. Kriss for providing specific scripts for reducing FUSE data with IRAF, and A. Boselli and G. Gavazzi for their optical spectroscopic observation of Mrk 54. This research has made use of the NASA/IPAC Extragalactic Database (NED) which is operated by the Jet Propulsion Laboratory, California Institute of Technology, under contract with the National Aeronautics and Space Administration.