A&A 375, 963-976 (2001)
DOI: 10.1051/0004-6361:20010894
New results of magnetic field diagnosis in HgMn stars and normal
late B-type stars
S. Hubrig1 - F. Castelli 2
1 - European Southern Observatory, Casilla 19001, Santiago 19, Chile
2 -
CNR-Gruppo Nazionale Astronomia and Osservatorio Astronomico di Trieste,
Via G.B. Tiepolo 11, 34131 Trieste, Italy
Received 2 February 2001 / Accepted 18 June 2001
Abstract
We suggested in a previous paper that three HgMn
stars, HD 175640, HD 178065, and HD 186122, may be suspected to possess a
magnetic field that could be larger than 2 kG.
We report here new observations of these three stars,
three more HgMn stars, and four normal late B-type stars. The
search was carried out by measuring the equivalent width of the
Fe

 Å line relative to the equivalent width of the
Fe
Å line relative to the equivalent width of the
Fe
 Å line. The observed relative
differences between the equivalent widths of these Fe
lines are
compared with those derived from synthetic spectra computed by neglecting
magnetic field effects.
To investigate the effect of oscillator strength uncertainties on the results,
we computed equivalent widths by using both Fe
Å line. The observed relative
differences between the equivalent widths of these Fe
lines are
compared with those derived from synthetic spectra computed by neglecting
magnetic field effects.
To investigate the effect of oscillator strength uncertainties on the results,
we computed equivalent widths by using both Fe
 -values taken from
Kurucz & Bell (1995)
and Fe
-values taken from Raassen & Uylings (2000). The comparison of the
computed and observed equivalent widths based on the Kurucz & Bell (1995)
atomic data leads us to conclude that all the
stars of our sample, except HD 175640, are very likely to possess
a magnetic field. On the other hand, the comparison of the computed and observed equivalent widths based
on the Raassen & Uylings (2000) -values suggests the possible presence of magnetic
fields only in three stars, the HgMn star HD 16717 and the two normal B-type stars
HD 179761 and HD 186568. The latter two are those in the sample with the largest
-values taken from
Kurucz & Bell (1995)
and Fe
-values taken from Raassen & Uylings (2000). The comparison of the
computed and observed equivalent widths based on the Kurucz & Bell (1995)
atomic data leads us to conclude that all the
stars of our sample, except HD 175640, are very likely to possess
a magnetic field. On the other hand, the comparison of the computed and observed equivalent widths based
on the Raassen & Uylings (2000) -values suggests the possible presence of magnetic
fields only in three stars, the HgMn star HD 16717 and the two normal B-type stars
HD 179761 and HD 186568. The latter two are those in the sample with the largest  (15 km s-1 and
18 km s-1, respectively), so that the results for them are the most uncertain ones.
(15 km s-1 and
18 km s-1, respectively), so that the results for them are the most uncertain ones.
Key words: stars: abundances - stars: atmospheres - stars:
chemically peculiar - stars: magnetic fields
1 Introduction
HgMn stars constitute a well-defined sub-group of chemically
peculiar (CP) stars of B spectral type in the temperature range
10000-14000 K.
These stars exhibit marked abundance anomalies of several elements:
e.g., overabundances of Hg, Mn, Ga, Y, Cu, Be,
P, Bi, Sr, Zr, and deficiencies of He, Al, Zn, Ni, Co.
The HgMn stars differ from the classical Bp stars,
which share the same temperature range, because they generally have neither
extreme overabundances of rare earths, nor significant overabundances of Si.
In fact, the excess of Si is the most obvious anomaly
in classical Bp stars. The He-weak stars constitute
another group of peculiar stars which overlap in temperature
the hottest HgMn stars, in that their
 ranges from about 13000 K to
about 17000 K. The He-weak stars are defined as stars having
abnormally weak helium lines. In analogy with the HgMn stars
they may show enhanced lines of Mn and Hg.
ranges from about 13000 K to
about 17000 K. The He-weak stars are defined as stars having
abnormally weak helium lines. In analogy with the HgMn stars
they may show enhanced lines of Mn and Hg.
In contrast with Bp and He-weak stars, the HgMn stars do not show
conspicuous intensity variations of the spectral lines.
Large-scaled organized magnetic fields were measured in both classical Bp and
He-weak stars, while they have not been definitely detected in HgMn stars.
Although Babcock (1958) had reported about weak
longitudinal fields in some HgMn stars, this finding was never confirmed
in later studies (e.g., Conti 1970; Landstreet 1992).
However, weak magnetic fields, with a longitudinal component less than a few
hundred Gauss, or complex in structure, can not be excluded a priori for HgMn
stars, owing to the limitations of the usual spectropolarimetric techniques.
We have shown in a previous paper (Hubrig et al.
1999, Paper I) that three HgMn
stars, HD 175640, HD 178065, and HD 186122, were suspected to possess a
magnetic field with complex and/or toroidal structure. To detect magnetic fields we have applied a
simple method
introduced by Mathys (1990) which uses the relative magnetic
intensification  W/
W/
 of the two Fe
lines of mult. 74,
Å and
Å.
W/
is defined as the ratio of the
difference of the equivalent widths of the two Fe
lines to the average of the two equivalent widths.
The two Fe
transitions have approximately the same intensity
under normal conditions and observations of normal A-type stars have shown
that the equivalent widths of the two lines do not differ in these stars
more than 2.5% (Mathys & Lanz 1990).
Differences larger than 10% in the equivalent widths
were observed in magnetic Ap and Bp stars by Mathys (1990). They
were explained by Takeda (1991) as due to magnetic intensification
produced by different magnetic desaturations induced by different
Zeeman-split components. Takeda (1991) also showed that
the relative intensification is roughly correlated with the
strength of the magnetic field, so that it is potentially a powerful tool
for detecting magnetic fields which have a complex structure and
are difficult to detect by polarization measurements.
of the two Fe
lines of mult. 74,
Å and
Å.
W/
is defined as the ratio of the
difference of the equivalent widths of the two Fe
lines to the average of the two equivalent widths.
The two Fe
transitions have approximately the same intensity
under normal conditions and observations of normal A-type stars have shown
that the equivalent widths of the two lines do not differ in these stars
more than 2.5% (Mathys & Lanz 1990).
Differences larger than 10% in the equivalent widths
were observed in magnetic Ap and Bp stars by Mathys (1990). They
were explained by Takeda (1991) as due to magnetic intensification
produced by different magnetic desaturations induced by different
Zeeman-split components. Takeda (1991) also showed that
the relative intensification is roughly correlated with the
strength of the magnetic field, so that it is potentially a powerful tool
for detecting magnetic fields which have a complex structure and
are difficult to detect by polarization measurements.
The method was successively applied by Lanz & Mathys (1993) to detect magnetic
fields in Am stars, after Mathys & Lanz (1990) measured
a relative intensification of 5.2% in the Am star o Peg.
Among the 18 Am stars examined, they found two stars affected by magnetic fields
according to their measured
 ,
whose values were
larger by 0.03-0.04 than the predicted ones.
,
whose values were
larger by 0.03-0.04 than the predicted ones.
The same method was used in this paper
with the aim to continue the search for magnetic fields in HgMn
stars performed in Paper I. In the previous study we examined nine HgMn stars.
All the stars except one (HD 141556) were observed on a single occasion.
In order to confirm the results from Paper I and/or assess the possible
variability of magnetic fields, we have reobserved four HgMn stars. We added
two new HgMn stars, and five normal late B-type stars to be used as comparison stars.
All the spectra analyzed in this paper were obtained on one night in August 1999
at the CFHT with the high-resolution coudè spectrograph (Gecko) and have a higher
S/N ratio than the spectra adopted for Paper I, which were taken at ESO with
the 1.4 m CAT telescope.
![\begin{figure}
\par\includegraphics[width=11cm]{fig1ab.ps}\end{figure}](/articles/aa/full/2001/33/aa1101/Timg17.gif) |
Figure 1:
The observed spectra normalized to the continuum. For HD 175640, HD 178065,
HD 186122, HD 193452, and HD 196426, the CFHT spectra (full lines) are compared
with the CAT spectra (dashed lines) used in Paper I. The vertical scale is reduced by
one half for HD 186122 and HD 193452. Absorption lines are Cr
mult. 105 at 6147.154 Å,
Fe
mult. 74 at 6147.741 Å together with
Fe
at 6147.775 Å, Fe
mult. 74 at 6149.258 Å,
and Hg
at 6149.5 Å. |
| Open with DEXTER |
Because the Mathys method can be applied only to stars having
low enough
to avoid blends of the two Fe
lines at 6147.7 Å and 6149.2 Å each other
and with other components, we observed only sharp-lined stars.
As mentioned in Paper I, the line Fe
 Å is severely blended in HgMn stars with the line Hg
at
Å is severely blended in HgMn stars with the line Hg
at
 Å and therefore the applied method can provide a satisfactory diagnosis only
for very slowly rotating HgMn stars observed at high resolution, so that
the Fe
and the Hg
features are not blended.
All the HgMn stars in our sample (HD 16727, HD 27295, HD 175640, HD 178065,
HD 186122, and HD 193452) are slowly rotating stars with
Å and therefore the applied method can provide a satisfactory diagnosis only
for very slowly rotating HgMn stars observed at high resolution, so that
the Fe
and the Hg
features are not blended.
All the HgMn stars in our sample (HD 16727, HD 27295, HD 175640, HD 178065,
HD 186122, and HD 193452) are slowly rotating stars with
 5 km s-1 and they are not known to be
spectroscopic binaries.
5 km s-1 and they are not known to be
spectroscopic binaries.
Five late B-type stars, HD 179761, HD 186568, HD 196426,
HD 209459, and HD 219927, were observed as
comparison stars because they have a sharp-lined spectrum and were not
found to show chemical peculiarities and magnetic fields
(Cowley 1972; Cowley & Aikman 1980).
Three out of the five stars (HD 179761, HD 196426 and
HD 209459) have been frequently used as comparison standards in other studies
(e.g., Smith & Dworetsky 1993; Dworetsky & Budaj 2000).
The Hg
line is not a problem for the normal B-type stars.
Mercury abundances  2.5 dex
were derived by Smith (1997) in normal late B-type stars
from the analyis of Hg
at 1942 Å observed in co-added
IUE spectra. We verified by computing synthetic spectra for
log
2.5 dex
were derived by Smith (1997) in normal late B-type stars
from the analyis of Hg
at 1942 Å observed in co-added
IUE spectra. We verified by computing synthetic spectra for
log
 that no Hg
line at
Å is predicted in late B-type stars
for this mercury abundance.
that no Hg
line at
Å is predicted in late B-type stars
for this mercury abundance.
2 Observations
The observations were made on 1999 August 29 at the
CFHT with the GECKO spectrograph at a
resolving power of
 and grating settings
corresponding to the wavelength interval 6105-6190 Å.
Programme stars are listed in Table 1, where we give the HD number and other
identifiers in Cols. 1-3, the V magnitude and the spectral type
(both from the catalog of Renson 1991) in Cols. 4 and 5.
The spectra were reduced with the help of D. A. Bohlender. A set of IRAF macros
written by Bohlender et al. (1998) was used.
Special care was taken in order to eliminate the scattered
light from the spectra.
and grating settings
corresponding to the wavelength interval 6105-6190 Å.
Programme stars are listed in Table 1, where we give the HD number and other
identifiers in Cols. 1-3, the V magnitude and the spectral type
(both from the catalog of Renson 1991) in Cols. 4 and 5.
The spectra were reduced with the help of D. A. Bohlender. A set of IRAF macros
written by Bohlender et al. (1998) was used.
Special care was taken in order to eliminate the scattered
light from the spectra.
The achieved signal-to-noise ratios in the continuum are given in Col. 6 of
Table 1. They were measured after reduction in portions of the spectrum
apparently devoid of lines: accordingly the derived values must be regarded
as upper limits of the S/N ratio actually obtained. The typical value of
the signal-to-noise ratio of our spectra is larger than 300.
Table 1:
Journal of observations.
| HD |
HR |
Other id. |
V |
Sp. type |
S/N |
| |
|
|
|
|
|
| HgMn stars |
| 16727 |
785 |
11 Per |
5.7 |
B7 HgMn |
320 |
| 27295 |
1339 |
53 Tau |
5.5 |
B9 HgMn |
250 |
| 1756401 |
7143 |
|
6.2 |
B9 HgMn |
390 |
| 1780651 |
7245 |
|
6.6 |
B9 HgMn |
375 |
| 1861221 |
7493 |
46 Aql |
6.3 |
B9 MnHg |
360 |
| 1934521 |
7775 |
|
6.1 |
B9 HgMn |
350 |
| |
|
|
|
|
|
| Superficially normal stars |
| 1964261 |
7878 |
|
6.2 |
B8 III |
460 |
| 209459 |
8404 |
21 Peg |
5.8 |
B9.5 V |
380 |
| |
|
|
|
|
|
| Normal stars |
| 179761 |
7287 |
21 Aql |
5.1 |
B8 II-III |
370 |
| 186568 |
7512 |
|
6.1 |
B9 II |
420 |
| 219927 |
8873 |
|
6.3 |
B8 III |
320 |
1 Stars studied also in Hubrig et al. (1999) (Paper I).
The spectra, normalized to the continuum, are shown in Fig. 1 for
the region 6146-6150 Å. The CFHT spectra of HD 175640, HD 178065,
HD 186122, HD 193452, and HD 196426 are compared with the
spectra observed at CAT and used in Paper I. The larger noise
of the CAT spectra is evident in the figure.
The superficially normal late B-type star HD 196426, used in Paper I as
a comparison star, turned out to be a spectroscopic binary.
Both Fe
lines show very asymmetric profiles in the CFHT
spectrum, with red wings much steeper than blue wings.
As a consequence, this star was not used in this paper.
3 The method
The analysis was performed as in Paper I. We searched for a possible
intensification of the line Fe
6147.7 Å relative to the
line Fe
6149.2 Å by measuring the equivalent widths
of the two absorption profiles. Then, we derived an intensification
index in according to Mathys (1990):
Because Fe
6147.741 Å may be blended with Fe
6147.775 Å,
the measured intensification could be due to the blend of the two Fe
lines
at 6147.7 Å rather than to the effect af a magnetic field.
We therefore simulated the observed spectrum with synthetic spectra
which consider all the
possible predicted contributions to Fe
6147.741 Å.
Then we measured the equivalent widths of the computed profiles
at 6147.7 Å and at 6149.2 Å and we derived the computed
intensification index.
The difference between the observed and computed
ratios yields the amount of the intensification of Fe
6147.7 Å over Fe
6149.2 Å due to the magnetic field.
The equivalent widths W of the Fe
lines at 6147.7 Å and 6149.2 Å were measured both by Gaussian fitting and by direct
integration of the line profiles using the IRAF package.
For the most rapidly rotating stars, HD 179761 and HD 186568, we kept only the
measurements performed by direct integration, because of the
non-Gaussian form of the rotational broadening function.
In the spectra examined with IRAF any preselected continuum disappears,
so that it may be differently fixed each time a line is measured. Therefore,
we also used a code written by F.C., which keeps
the preselected continuum and yields equivalent widths measured
by direct integration.
A further shortcoming affecting the measurement of the equivalent widths is
the requirement that the width of the profile has to be fixed at the level of the continuum.
Owing to the spectral noise, the choice of the blue end and of the red end
of a profile may be a difficult
decision especially when very accurate equivalent widths are required.
Since the CFHT spectra are
taken at high S/N ratio, Fig. 1 shows that this is not a serious problem for some stars
in our sample. However, for other stars, such as HD 178065, HD 209459, and HD 186568,
the fixing of the width of the profiles is a completely subjective decision.
A further uncertainty occurs in HgMn stars for the equivalent width of Fe
6149.25 Å,
when the line is blended with Hg
6149.48 Å.
To be more definitive about uncertainties in the equivalent widths, the
measurements were performed independently by each author.
Table 2 lists the measured equivalent widths: (
 )
and
(
)
and
(
 )
are the equivalent widths from the fit to
Gaussians measured by F.C. and S.H. respectively; (
)
are the equivalent widths from the fit to
Gaussians measured by F.C. and S.H. respectively; (
 )
and (
)
and (
 )
are the equivalent widths measured by direct
integration by F.C. and S.H. respectively; (
)
are the equivalent widths measured by direct
integration by F.C. and S.H. respectively; (
 )
indicates
the equivalent widths measured by F.C. by direct integration by means of
her code.
The average of all five determinations together with the
rms values for W(6147) and W(6149) are given in Cols. 12 and 13.
Finally, Col. 14 shows the ratio
(
)
)
indicates
the equivalent widths measured by F.C. by direct integration by means of
her code.
The average of all five determinations together with the
rms values for W(6147) and W(6149) are given in Cols. 12 and 13.
Finally, Col. 14 shows the ratio
(
)
 with the associated uncertainties.
The equivalent widths in Table 2 are given in mÅ.
with the associated uncertainties.
The equivalent widths in Table 2 are given in mÅ.
HD 27295 yields an example of the uncertainty in
related with different placements of the continuum. This star
exhibits the faintest Fe
lines.
Equivalent widths which differ more than 1.0 mÅ were measured by
F.C. and S.H., respectively. In Table 2,
the first row for HD 27295 lists
all the measured equivalent widths and their average, while
the two successive rows list the separate measurements and
show that systematic differences in the placement of the continuum
may lead to differences on the order of 0.02 for the
ratio. If we exclude HD 27295,
the uncertainty on
is less than 0.03.
The typical difference between several measurements of the equivalent widths
in the same spectrum
with the same continuum is on the order of 0.3-0.4 mÅ.
Unfortunately, all the spectra were obtained during a single night, and we do not have
several spectra for any star to verify the noise statistics across the measured lines.
On the other hand, we have already shown (Paper I)
for the star HD 141556 that the ratio
derived from the repeated observations
is almost the same, differing by only 0.003 when the direct integration method
was used.
For nine out of the ten stars examined the equivalent width of
Fe
Å is larger than that of
Fe
Å.
This behaviour is similar, even if less conspicuous, to that
observed by Mathys & Lanz (1992) for the magnetic Ap stars.
Only for the HgMn star HD 175640, the equivalent width of
Fe
Å is larger by 0.1 mÅ than that of Fe
Å. In Paper I
this star was suspected to possess a magnetic field.
Figure 1 shows that the profiles in the CAT spectrum are
slightly stronger than those in the CFHT spectrum.
The difference is reduced if the continuum in the CAT spectrum
is lowered. The slightly higher continuum placement and the rather strong noise
are probably the cause of the larger measured equivalent widths in the CAT spectrum.
The results from Paper I are compared in more detail with those from this paper
in Sect. 7.
The model parameters
and  were derived from
observed Strömgren indices and also from spectrophotometry,
when available.
were derived from
observed Strömgren indices and also from spectrophotometry,
when available.
Observed Strömgren indices were taken from the catalog of Hauck & Mermilliod (1998)
and were dereddened by means of the UVBYLIST code
of Moon (1985), which yields E(b-y), and therefore
(b-y)0=(b-y)-E(b-y),
m0= m1+ 0.33E(b-y), and
c0= c1 - 0.19E(b-y); the last two relations,
as well as
E(B-V)=E(b-y)/0.724 for RV=3.1, are taken
from Crawford & Mandwewala (1976). The reddening E(B-V) was used for
dereddening the spectrophotometric observations, which are
available for HD 27295 (Adelman & Pyper 1979),
HD 209459 (Adelman & Pyper 1983), HD 179761 (Adelman 1978), and HD 219927 (Breger 1976).
For each star of the sample, Table 3 lists the observed Strömgren indices,
the reddening E(b-y), and the reddening E(B-V).
Because our spectra have too few lines in order to derive the microturbulent velocity  ,
we searched for it in the literature.
The available
and the corresponding source are given in
Cols. 8 and 9 of Table 3. All the microturbulent velocities are lower than 2 km s-1,
in agreement with Adelman & Rayle (2000), who stated that "Trends in recent elemental
abundances studies indicate for normal main sequence band stars with
,
we searched for it in the literature.
The available
and the corresponding source are given in
Cols. 8 and 9 of Table 3. All the microturbulent velocities are lower than 2 km s-1,
in agreement with Adelman & Rayle (2000), who stated that "Trends in recent elemental
abundances studies indicate for normal main sequence band stars with
 K that their microturbulence is 0 km s-1...''
and in agreement with Adelman (1994) who showed that most HgMn stars
have little or no microturbulent velocity.
We investigated the effect of the microturbulent velocity on the stellar
parameters by deriving them from fluxes and colors based on
two different grids of models, namely AP00K0NOVER and AP00K2NOVER.
The first grid was computed for
K that their microturbulence is 0 km s-1...''
and in agreement with Adelman (1994) who showed that most HgMn stars
have little or no microturbulent velocity.
We investigated the effect of the microturbulent velocity on the stellar
parameters by deriving them from fluxes and colors based on
two different grids of models, namely AP00K0NOVER and AP00K2NOVER.
The first grid was computed for  km s-1, while the second grid
was computed for
km s-1, while the second grid
was computed for  km s-1. The metallicity is
![$\rm [M/H]=0.0$](/articles/aa/full/2001/33/aa1101/img75.gif) for
both grids. The grids are available at the Kurucz website
for
both grids. The grids are available at the Kurucz website![[*]](/icons/foot_motif.gif) in the subdirectory "gridp00nover'' of the directory "grids of model atmospheres''.
The models in the grids were obtained by merging
the models computed by Castelli for
in the subdirectory "gridp00nover'' of the directory "grids of model atmospheres''.
The models in the grids were obtained by merging
the models computed by Castelli for
 K with the models computed by Kurucz
for
K with the models computed by Kurucz
for
 K. More details about these grids are given by Castelli (1999).
The grids of fluxes and the grids of synthetic Strömgren colors
used for this paper were computed from the above models and are available in the
same directories of the grids of models. The grids of fluxes are FP00K0NOVER
(for km s-1) and FP00K2NOVER (for km s-1),
while the grids of synthetic Strömgren colors are
UVBYBETAP00K0NOVER (for km s-1)
and UVBYBETAP00K2NOVER (for km s-1).
The synthetic
K. More details about these grids are given by Castelli (1999).
The grids of fluxes and the grids of synthetic Strömgren colors
used for this paper were computed from the above models and are available in the
same directories of the grids of models. The grids of fluxes are FP00K0NOVER
(for km s-1) and FP00K2NOVER (for km s-1),
while the grids of synthetic Strömgren colors are
UVBYBETAP00K0NOVER (for km s-1)
and UVBYBETAP00K2NOVER (for km s-1).
The synthetic  indices were computed according to
Lester et al. (1986) except for the normalization:
instead of using five stars (
indices were computed according to
Lester et al. (1986) except for the normalization:
instead of using five stars ( Gem,
Gem,  CMi,
CMi,
 Leo,
Leo,  UMa, and Vega) for the normalization
of the indices as did Lester et al. (1986), the uvby indices were normalized
using only Vega, while the
indices were normalized by using both Vega and the Sun.
The possible problems due to the use of UMa to normalize
the indices are discussed by Castelli (1991).
UMa, and Vega) for the normalization
of the indices as did Lester et al. (1986), the uvby indices were normalized
using only Vega, while the
indices were normalized by using both Vega and the Sun.
The possible problems due to the use of UMa to normalize
the indices are discussed by Castelli (1991).
Parameters
and  from Strömgren photometry were derived by
interpolating the dereddened observed indices in the grids of synthetic indices.
Those for
from Strömgren photometry were derived by
interpolating the dereddened observed indices in the grids of synthetic indices.
Those for  km s-1 are given
in Cols. 2 and 3 of Table 4, while those for
km s-1 are given
in Cols. 2 and 3 of Table 4, while those for  km s-1 are listed
in Cols. 4 and 5. The largest difference in
is 77 K
for HD 16727, while the largest difference in
is 0.02 dex for HD 209459.
Column 9 in Table 4 specifies which indices were used to obtain
and .
The errors associated with the parameters were derived
by assuming an uncertainty of
km s-1 are listed
in Cols. 4 and 5. The largest difference in
is 77 K
for HD 16727, while the largest difference in
is 0.02 dex for HD 209459.
Column 9 in Table 4 specifies which indices were used to obtain
and .
The errors associated with the parameters were derived
by assuming an uncertainty of  0.015 mag for all the observed indices
(Relyea & Kurucz 1978), except for ,
for which an error of 0.016 mag was adopted.
It is the largest error in
for the sample of stars.
In fact, errors in ,
as taken from the catalog of
Hauck & Mermilliod (1998),
range from 0.001 mag for HD 219927 to 0.016 mag for HD 175640,
while, for all the stars, the errors in c are less than the error adopted by us.
0.015 mag for all the observed indices
(Relyea & Kurucz 1978), except for ,
for which an error of 0.016 mag was adopted.
It is the largest error in
for the sample of stars.
In fact, errors in ,
as taken from the catalog of
Hauck & Mermilliod (1998),
range from 0.001 mag for HD 219927 to 0.016 mag for HD 175640,
while, for all the stars, the errors in c are less than the error adopted by us.
Parameters for HD 27295, HD 209459, HD 179761, and HD 219927
were also derived by fitting the dereddened spectrophotometric observations to the grids
of synthetic fluxes FP00K0NOVER and FP00K2NOVER.
The fitting procedure is based on that described by Lane & Lester (1984).
The search for the minimum rms difference
between the observed and computed energy distributions is made by interpolating in the
grids of computed fluxes. The computed fluxes are sampled in steps of 50 K in
and in steps of 0.1 dex in ,
so the finer sampling was
obtained by linear interpolation. Columns 7 and 8 of Table 4 show the parameters
derived from the spectrophotometry by using fluxes computed for km s-1.
For the four stars, the temperature derived from fluxes computed for
km s-1 is 50 K lower than
derived from
fluxes computed for km s-1, while
the gravity does not change.
Temperatures from Strömgren indices and from the spectrophotometry
corresponding to km s-1 differ no more than 104 K (HD 209459), while
the differences in
are as large as 0.4 dex (HD 27295).
The adopted parameters for the sample of stars are given in Cols. 9 and 10 of Table 4. They
approximate the determinations listed in Cols. 2-5, 7, and 8.
The last two columns of Table 4 list, for comparison, the parameters
derived by Smith & Dworetsky (1993) for the stars in common and which were derived
by them from Strömgren photometry, Geneva photometry, spectrophotometric scans,
and H profiles. The agreement with our determinations
from Strömgren photometry is very good.
profiles. The agreement with our determinations
from Strömgren photometry is very good.
Table 3:
Strömgren indices, reddening, microturbulent velocity, and rotational velocity.
|
HD |
(b-y) |
m1 |
c1 |
|
E(b-y) |
E(B-V) |
|
Ref. |
|
|
HgMn stars |
|
|
| 16727 |
-0.050 |
0.114 |
0.471 |
2.729 |
0.016 |
0.022 |
- |
|
4.50 |
| 27295 |
-0.036 |
0.129 |
0.738 |
2.799 |
0.004 |
0.055 |
0.0 |
(1) |
5.00 |
| 175640 |
+0.001 |
0.103 |
0.747 |
2.771 |
0.044 |
0.061 |
1.0 |
(2) |
2.50 |
| 178065 |
+0.073 |
0.077 |
0.729 |
2.718 |
0.119 |
0.164 |
- |
|
1.70 |
| 186122 |
-0.019 |
0.094 |
0.641 |
2.729 |
0.035 |
0.048 |
0.0 |
(2) |
0.00 |
| 193452 |
-0.007 |
0.138 |
0.909 |
2.845 |
0.017 |
0.023 |
0.0 |
(2) |
0.75 |
| |
|
|
|
|
|
|
|
|
|
| Normal stars |
|
|
| 209459 |
-0.011 |
0.112 |
1.023 |
0.796 |
0.008 |
0.011 |
0.5 |
(2) |
3.70 |
| 179761 |
-0.010 |
0.084 |
0.629 |
2.700 |
0.046 |
0.063 |
0.0 |
(3) |
15.00 |
| 186568 |
-0.008 |
0.088 |
0.814 |
2.724 |
0.032 |
0.044 |
- |
|
18.00 |
| 219927 |
-0.008 |
0.095 |
0.637 |
2.718 |
0.045 |
0.062 |
- |
|
5.00 |
References for
:
(1) Adelman & Pyper (1979); (2) Smith & Dworetsky (1993);
(3) Adelman (1984).
1 SD: Smith & Dworetsky (1993).
2 The definition of the indices a and r* can be found in Strömgren (1966)
and in Moon & Dworetsky (1985).
The iron abundance needed for computing the synthetic Fe
profiles was
derived for each star from the measured equivalent width of
the line Fe
Å and from the ATLAS9 (Kurucz 1993a) model
computed for km s-1, solar metallicity, and parameters given
in Cols. 9 and 10 of Table 4.
The WIDTH code of Kurucz (1993a) was used to obtain the iron abundance.
The line Fe
Å was assumed as
unblended in all the stars, although this hypothesis could be questionable
for HD 179761 and HD 186568, the most rapidly rotating stars of the sample
(
 km s-1 and
 km s-1,
respectively). However, if some unpredicted line contributes to the
equivalent width of Fe
at 6149.2 Å, the actual magnetic intensification
should be larger than that measured by us and listed in Table 2 (i.e. a blend with
Fe
Å serves to reduce
).
km s-1,
respectively). However, if some unpredicted line contributes to the
equivalent width of Fe
at 6149.2 Å, the actual magnetic intensification
should be larger than that measured by us and listed in Table 2 (i.e. a blend with
Fe
Å serves to reduce
).
For each star,
the same atmosphere model used in WIDTH and the iron abundance obtained from
WIDTH were then used in the SYNTHE code of Kurucz (1993b)
to compute a synthetic spectrum at
 resolution. As in Paper I,
the lines of the gf0800.100 line list from Kurucz & Bell (1995) were adopted,
except for the Hg
line at 6149.47 Å, which was replaced by the
Hg
isotopic components given in Paper I and reported here in Table 5.
The
ratios were computed by assuming
solar abundances for all the elements except for iron.
resolution. As in Paper I,
the lines of the gf0800.100 line list from Kurucz & Bell (1995) were adopted,
except for the Hg
line at 6149.47 Å, which was replaced by the
Hg
isotopic components given in Paper I and reported here in Table 5.
The
ratios were computed by assuming
solar abundances for all the elements except for iron.
The synthetic profiles were broadened for an instrumental
resolution of 125000 and for the rotational velocity
listed
in the last column of Table 3. For each star, the rotational velocity is that
which best reproduces the observed Fe
Å
profile, when the synthetic profile is computed by using the
adopted model parameters given in Table 4 and the corresponding iron abundance
listed in Table 6.
The wavelength sampling in the synthetic spectra corresponding to the
resolution of
was selected in order to provide
accurate equivalent widths from the synthetic profiles integrated
by means of a simple Simpson rule for a constant step-size.
The computed equivalent widths in WIDTH are obtained by
a generalized Simpson rule for a step-size which increases with
the increasing of the distance from the line center. The two different integration methods
give differences in the computed equivalent widths on the order of
0.1 mÅ.
Because the computed profiles are free from any noise, the
equivalent widths obtained by direct integration are not affected
by the uncertainty
related to the choice of the blue and red ends of the profile
as in the case of the equivalent widths measured on the observed profiles,
provided that the stars have low .
In fact, for the two most rapidly rotating stars of the sample, HD 179761 and HD 186568,
the predicted lines
of Ni
at 6148.246 Å, Ni
at 6148.674 Å, and Fe
at 6148.848 Å cause a lowering of the continuum on the order of 0.1%
in the region 6148.20-6148.85 Å, so that it is impossible
to know where exactly the red wing of the 6147.7 Å line ends and where
the blue wing of the 6149.2 Å line starts.
By looking at the numbers giving the residual flux, we assumed for HD 179761
that the blue wing of Fe
6147.7 Å ends at 6148.1899 Å
and that the red wing of Fe
6149.2 Å starts at 6148.8384 Å.
The corresponding equivalent widths are 15.55 mÅ and 14.82 mÅ.
For the same star, we derived slightly different wavelength limits
from the visual inspection of the plotted profiles, corresponding to
equivalent widths of 15.37 mÅ and 14.80 mÅ.
The
ratios
corresponding to two cases are 0.048 and 0.038, respectively.
They are both much lower than the observed ratio 0.097.
For HD 186568, the equivalent widths derived by fixing the
limits of the profiles by looking at values of the residual flux
are 22.57 mÅ for Fe
6147.7 Å and 21.85 mÅ for Fe
6149.2 Å.
When the limits of the profiles were fixed from the visual inspection
of their shape we derived 22.23 mÅ and 21.68 mÅ for the two Fe
lines.
The
ratios corresponding to the two measurements
are 0.032 and 0.025, respectively. Both values are lower than the observed ratio 0.112.
The lines of the region 6147-6150 Å which have a computed residual
flux at the line center equal or less than 0.999 are listed in Col. 3 of Table 5. They are taken from
the Kurucz & Bell (1995) line list.
The
 adopted in Paper I for Fe
6147.775 Å
is replaced in this paper by
adopted in Paper I for Fe
6147.775 Å
is replaced in this paper by
 from Kurucz & Bell (1995).
The
adopted in Paper I was fixed from the requirement
that the difference between the computed equivalent widths of
Fe
6147.741 Å and Fe
6149.258 Å be not larger than 0.1 mÅ for HD 196426, in agreement with the measured equivalent widths.
The computed contribution of Fe
6147.775 Å to Fe
6147.741 Å was suppressed when
from Kurucz & Bell (1995).
The
adopted in Paper I was fixed from the requirement
that the difference between the computed equivalent widths of
Fe
6147.741 Å and Fe
6149.258 Å be not larger than 0.1 mÅ for HD 196426, in agreement with the measured equivalent widths.
The computed contribution of Fe
6147.775 Å to Fe
6147.741 Å was suppressed when
 was adopted. In Paper I,
HD 196426 was considered to be a normal B-type star,
therefore free from any magnetic intensification. For this reason, it was adopted
as a comparison star for the sample of HgMn stars.
The finding that HD 196426 is very likely a spectroscopic
binary makes now the lowering of the
value very arbitrary,
all the more so, as Table 2 shows, that
the measured equivalent widths of the profiles at 6147.7 Å and
6149.2 Å are different also in normal B-type stars.
was adopted. In Paper I,
HD 196426 was considered to be a normal B-type star,
therefore free from any magnetic intensification. For this reason, it was adopted
as a comparison star for the sample of HgMn stars.
The finding that HD 196426 is very likely a spectroscopic
binary makes now the lowering of the
value very arbitrary,
all the more so, as Table 2 shows, that
the measured equivalent widths of the profiles at 6147.7 Å and
6149.2 Å are different also in normal B-type stars.
In order to investigate the effect on the computed equivalent
widths of Fe
-values different from those
of Kurucz & Bell (1995), we also used the Fe
oscillator
strengths from Raassen & Uylings (2000). They are listed in the
fourth column of Table 5.
In all the stars, Fe
at 6147.741 Å is blended with Fe
6147.775 Å,
whichever is the source of the Fe
-values,
Kurucz & Bell (1995) or Raassen & Uylings (2000).
In HD 193452 and in HD 209459, Fe
6147.741 Å
is also blended with Fe
 6147.829 Å. The residual
flux at the line center of the unbroadened Fe
profile is 0.995 for HD 193452
and 0.997 for HD 209450, when -values from Kurucz & Bell (1995) are
considered; it is 0.996 and 0.998 when -values from Raassen & Uylings (2000)
are adopted.
The Fe
line at 6149.258 Å is unblended in all the stars, except
in HD 186568 when the Kurucz & Bell (1995) -values are used.
In this case, the Fe
line at 6148.848 Å contributes to the
Fe
6149.258 Å with a residual flux at the line center equal to 0.997.
The contribution of Fe
6148.848 Å disappears when the Raassen & Uylings (2000)
data are used.
6147.829 Å. The residual
flux at the line center of the unbroadened Fe
profile is 0.995 for HD 193452
and 0.997 for HD 209450, when -values from Kurucz & Bell (1995) are
considered; it is 0.996 and 0.998 when -values from Raassen & Uylings (2000)
are adopted.
The Fe
line at 6149.258 Å is unblended in all the stars, except
in HD 186568 when the Kurucz & Bell (1995) -values are used.
In this case, the Fe
line at 6148.848 Å contributes to the
Fe
6149.258 Å with a residual flux at the line center equal to 0.997.
The contribution of Fe
6148.848 Å disappears when the Raassen & Uylings (2000)
data are used.
Five different computed intensification indices (
 ,
based on the Kurucz & Bell (1995) -values, are listed for each star in
Col. 8 of Table 6. The first one is computed from synthetic
profiles corresponding to the adopted model parameters (Cols. 9 and 10 of Table 4).
The other four (
ratios are computed
by assuming errors in the model parameters on the order of
500 K in
and 0.5 dex in .
For all the stars these errors
are much larger than those estimated in Sect. 5.1.
,
based on the Kurucz & Bell (1995) -values, are listed for each star in
Col. 8 of Table 6. The first one is computed from synthetic
profiles corresponding to the adopted model parameters (Cols. 9 and 10 of Table 4).
The other four (
ratios are computed
by assuming errors in the model parameters on the order of
500 K in
and 0.5 dex in .
For all the stars these errors
are much larger than those estimated in Sect. 5.1.
1 (

and (
are based on the equivalent
widths measured by F.C.
2 (
and (
are based on the equivalent
widths measured by S.H.
Column 2 in Table 6 lists the
average measured equivalent width
 (6149)
of the observed line at
taken from Table 2; Cols. 3 and 4 list the model parameters,
Col. 5 gives the corresponding iron abundance
(6149)
of the observed line at
taken from Table 2; Cols. 3 and 4 list the model parameters,
Col. 5 gives the corresponding iron abundance
 )
derived with the WIDTH code. The adopted hydrogen abundance,
needed for the conversion on the scale where
)
derived with the WIDTH code. The adopted hydrogen abundance,
needed for the conversion on the scale where
 (H) = 12.00,
is
(H) = 12.00,
is
 .
The next two columns list the equivalent
widths of the two Fe
synthetic profiles at 6147.7 Å and 6149.2 Å,
corresponding to the iron abundance given in col. 5.
We point out that the computed ratios (
given in Col. 8 do not include magnetic field contributions, so that they should
correspond to those observed in non-magnetic stars having similar stellar
parameters. The last column of Table 6 lists for comparison
the observed ratios (
taken from Table 2.
.
The next two columns list the equivalent
widths of the two Fe
synthetic profiles at 6147.7 Å and 6149.2 Å,
corresponding to the iron abundance given in col. 5.
We point out that the computed ratios (
given in Col. 8 do not include magnetic field contributions, so that they should
correspond to those observed in non-magnetic stars having similar stellar
parameters. The last column of Table 6 lists for comparison
the observed ratios (
taken from Table 2.
As mentioned in Sect. 4, the star HD 27295 shows the largest uncertainty in
(
related with different placements
of the continuum. The fractional errors of the equivalent widths
(6147) and
(6149)
derived by averaging all the five measurements available for each line are so large that
they indicate the meaninglessness of averaging
equivalent widths based on very different continua.
We therefore considered the separate measurements
performed for this star. The two different sets of data for HD 27295
given in Table 6 correspond to the meaurements made by F.C. and to
the measurements made by S.H, respectively.
Both separate measurements show evidence of relative intensification.
Table 6 indicates that the computed intensification indices depend only marginally
on
and ,
so that large errors in the adopted parameters do not
affect the results in a significant way.
Table 7 lists the intensification indices computed for
the adopted model parameters when the Fe
profiles are computed by using
-values from Raassen & Uylings (2000).
1 (
and (
are based on the equivalent
widths measured by F.C.
2 (
and (
are based on the equivalent
widths measured by S.H.
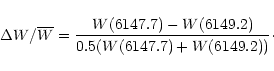
The observed and computed (
)
ratios listed in Table 6 are compared
in Fig. 2,
where the full black symbols show the computed intensification indices as
function of
and the white open symbols show the observed (
ratios together with the estimated errors.
The two separate (
ratios for HD 27295 are plotted,
while only one (
ratio is shown, owing to the negligible
differences between the two separated computed intensification factors.
The computed intensification indices plotted in Fig. 2 are
those given in the first row of Table 5 for each star,
while the small error bars indicate the
ratios derived from models computed for gravities which differ
by 0.5 dex from the adopted .
These are given in Table 6
for each star in the fourth and fifth rows.
An error of -0.5 dex in
does not change the value of
the intensification index for most stars,
so that there is no error bar in Fig. 2 for logg=-0.5.
The (
ratios
corresponding to errors of 500 K in
and listed for each star in
Col. 8 of Table 6, in the second and thirth rows,
are so close to those computed for the adopted parameters that
Fig. 2 does not change in a significant way if
models with
increased or decreased by 500 K are used.
The full line plotted in Fig. 2 shows the computed intensification index
as function of
,
when
is computed
from unbroadened profiles predicted for
ranging,
at steps of 500 K, from 10000 K to
15000 K, = 3.5 and solar iron abundance (
 ).
A gravity change from = 3.5 to = 4.0 gives a maximum difference of 0.003
in (
.
A change of microturbulent velocity from
0 km s-1 to 2 km s-1 gives a maximum difference of 0.002 in
(
.
).
A gravity change from = 3.5 to = 4.0 gives a maximum difference of 0.003
in (
.
A change of microturbulent velocity from
0 km s-1 to 2 km s-1 gives a maximum difference of 0.002 in
(
.
Figure 3 shows the same comparison plotted in Fig. 2, but, in this case,
all the computations, which are listed in Table 7, are based on
the Fe
-values taken from Raassen & Uylings (2000).
The sample of stars showing magnetic intensification consists now only of
three
stars instead of nine stars, as we obtained when we used the
Kurucz & Bell (1995) Fe
-values.
The three stars
are the HgMn star HD 16727 and the two normal stars HD 179761 and HD 186568.
We note that the two normal stars are those of the sample having the highest rotational velocity.
![\begin{figure}
\par\includegraphics[width=8cm]{1101f2.eps}\end{figure}](/articles/aa/full/2001/33/aa1101/Timg111.gif) |
Figure 2:
Comparison of the observed intensification indices (open circles and
open squares) with those computed by using the Kurucz & Bell (1995)
-values (full circles and full squares).
The correspondence of each number to each star is: 1 = HD 16727, 2 = HD 27295,
3 = HD 175640, 4 = HD 178065, 5 = HD 186122, 6 = HD 193452, 7 = HD 209459, 8 = HD 179761,
9 = HD 186568, 10 = HD 219927. The full line shows the computed
intensification index derived from unbroadened Fe
lines computed for
 ,
zero microturbulent velocity, and solar iron abundance. ,
zero microturbulent velocity, and solar iron abundance. |
| Open with DEXTER |
![\begin{figure}
\par\includegraphics[width=8cm]{1101f3.eps}\end{figure}](/articles/aa/full/2001/33/aa1101/Timg112.gif) |
Figure 3:
Comparison of the observed intensification indices (open circles and
open squares) with those computed by using the Raassen & Uylings (2000)
-values for Fe
(full circles and full squares).
The correspondence of each number to each star is: 1 = HD 16727, 2 = HD 27295,
3 = HD 175640, 4 = HD 178065, 5 = HD 186122, 6 = HD 193452, 7 = HD 209459, 8 = HD 179761,
9 = HD 186568, 10 = HD 219927. The full line shows the computed
intensification index derived from unbroadened Fe
lines computed for
,
zero microturbulent velocity, and solar iron abundance. |
| Open with DEXTER |
There are five stars in our sample in common with the stars analyzed in
Paper I. For the normal B-type star HD 196426 we already pointed out in
Sect. 2 that the spectrum taken at ESO
is so different from that taken at CFHT, that the star is suspected to
be binary.
All the HgMn stars of our sample, except HD 27295, show a moderately
strong line at 6149.45 Å, which we identified as Hg
.
Table 8 compares the mercury abundance of the four HgMn stars analyzed both
in Paper I and in this paper and gives also the mercury abundance for HD 16727
obtained in this study. The mercury abundance was derived from the
comparison of the observed profiles with profiles computed taking
into account the isotopic composition, which was discussed in Paper I.
The model parameters are those adopted for the stars and given in
Cols. 9 and 10 of Table 4; the rotational velocities
used for computing
the synthetic profiles are given in the last two columns of Table 8.
There is an excellent agreement between the
values from
this paper and Paper I.
The mercury abundances derived in this paper, and listed in Col. 2 of Table 8, are lower than
those derived in Paper I, which are given in the third column of Table 7.
The difference is about 0.2-0.4 dex, except for HD 186122. In fact,
in Paper I we estimated as a
pure noise the signal observed in the CAT spectrum of HD 186122, so that we
assumed meteoritic abundance for this star.
Table 8:
The mercury abundance and the rotational velocity
from this paper (II) and Paper I (I).
|
HD |
 ) ) |
|
| |
(II) |
(I) |
(II) |
(I) |
|
16727 |
-7.25 |
- |
4.50 |
- |
| 175640 |
-6.75 |
-6.50 |
2.50 |
2.50 |
| 178065 |
-7.05 |
-6.85 |
1.70 |
1.50 |
| 186122 |
-7.45 |
-10.95 |
0.00 |
0.00 |
| 193452 |
-5.70 |
-5.31 |
0.75 |
0.75 |
Table 9 compares results for iron from Paper I and from this paper for
the four HgMn stars analyzed in both studies.
In particular, it compares the measured equivalent widths of Fe
6149.2 Å,
the corresponding iron abundances
 ), the computed equivalent
widths
), the computed equivalent
widths
 and
and
 of Fe
6147.7 Å and Fe
6149.2 Å,
respectively, and the computed and measured intensification factors
(
and (
.
Computations performed in this paper by using both the Kurucz & Bell (1995) (KB)
-values and the Fe
-values from Raassen & Uylings (2000) (RU) are
considered.
of Fe
6147.7 Å and Fe
6149.2 Å,
respectively, and the computed and measured intensification factors
(
and (
.
Computations performed in this paper by using both the Kurucz & Bell (1995) (KB)
-values and the Fe
-values from Raassen & Uylings (2000) (RU) are
considered.
For three stars (HD 175640, HD 178065, and HD 193452) the equivalent widths
of Fe
 Å are systematically smaller in the CFHT spectra than
in the ESO spectra taken at the higher spectral resolution (
Å are systematically smaller in the CFHT spectra than
in the ESO spectra taken at the higher spectral resolution (
 ).
The opposite is true for HD 186122.
).
The opposite is true for HD 186122.
A few factors could be responsible for the different intensity of the Hg
and
Fe
profiles observed in the CAT and CFHT spectra (see Fig. 1):
for instance,
the different spectral resolution, the placing of the
continuum, or the residual scattered light in the Gecko spectrograph,
which could have been not completely removed.
The lower Fe
equivalent widths measured in this paper could be also due to
the more accurate measuraments performed in this second analysis. In fact,
in Paper I, the equivalent widths used to derive the iron abundance
were measured only
by gaussian fitting, whereas for the present paper we used the average of five
measurements.
For all the four HgMn stars,
the measured intensification factors are lower in this paper than those obtained
in Paper I and they are very close to the intensification factors computed by using
the Raassen & Uylings (2000) -values for Fe
,
so that the suggestion
of the presence of a magnetic field for HD 175640, HD 178065, and HD 186122
can not be confirmed by the present results.
8 Discussion
Table 6 and Fig. 2 show that the intensification indices
computed by using -values from Kurucz & Bell (1995) are
lower than the observed intensification indices for all the stars in our sample,
except HD 175640. For HD 193452 and HD 209459 the differences
lie within the error limits, but for five stars,
HD 16727, HD 27295, HD 179761, HD 186568 and HD 219927,
the differences are larger even when the observational and
computational uncertainties discussed in the previous sections are taken into account.
Especially striking is
the outcome of measurements in the star HD 186568 with the largest value
of .
The difference between the equivalent widths of
Fe
6147.7 Å and Fe
6149.2 Å is expected
to be 0.72 mÅ, whereas we have measured 2.57 mÅ.
Our calculations show that
large errors in the adopted parameter
and
do not affect
the results in a significant way.
However, if Fe
-values from Raassen & Uylings (2000) are used to compute
the Fe
profiles, the intensification indices become by about 2% higher and
the comparison between the calculated and observed
ratios
suggests the possible presence of magnetic fields in only three stars,
the HgMn star HD 16727
and the two normal late B-type stars HD 179761 and HD 186568.
We must deduce from the above results that the used diagnosis method heavly
depends on uncertainties of the atomic data.
Karlsson et al. (2001) demonstrated that experimental -values of
Fe
better agree with the -values computed by
Raassen & Uylings (2000) than with those computed by Kurucz & Bell (1995),
and recommend the use of the Raassen & Uylings (2000) data.
As a consequence, we have to conclude that our claim for magnetic field detection can be held
only for few stars. In particular, we can not confirm any magnetic field for
the three stars studied in Paper I, HD 175640, HD 178065, and HD 186122.
The differences between the measurements made in this paper and those from Paper I
could be related with instrumental effects and data reduction
problems, as we discussed in Sect. 7. However, we can not exclude a priori the presence
of weak magnetic fields of complex structure which change with time.
They could be responsible for the differences in the observed intensification
indices and for the small differences in the measured equivalent widths
of Fe
and Hg
of the stars observed both at CAT and at
CFHT, in particular of HD 175640 (Tables 8 and 9). In fact, Takeda (1991) shows that
the magnetic intensification may become negative for particular
magnetic field configurations.
The most intriguing result would have been to recognize the presence of magnetic
fields in normal late B-type stars that have been selected by us as standards
on the basis of previous studies on their nature.
Whereas the observed and computed intensification indices agree within the
estimated errors for the normal stars HD 209459 and HD 219927, the other two normal stars,
HD 179761 and HD 186568, show rather high observed relative differences between the
equivalent widths of the two Fe
lines compared with those derived from
synthetic spectra. However, the rather high rotational velocity of HD 179761
(15 km s-1) and HD 186568 (18 km s-1) makes the results from
the Mathys method somewhat uncertain. In fact, as we discussed in Sect. 5.2,
it is difficult to compute accurate equivalent widths for the rotationally
broadened profiles, owing to
the depressed continuum in the range 6148.20-6148.85 Å,
due to the presence of very weak lines (Table 5).
No large-scale magnetic fields were ever detected
for normal upper-main-sequence stars (O9.5-F6)(Landstreet 1982).
There is only a little information in the literature about
the normal late B-type stars studied in this paper.
Previous studies of the four normal stars in our sample
revealed only very mild peculiarities
and the possibility that they may be regarded as
superficially normal stars is still viable. In particular,
Babcock (1958) observed the star HD 186568 photographically, but no
magnetic field was found.
Bohlender & Landstreet (1990) searched for magnetic field in the
star HD 209459 with the H
Zeeman analyser technique. Measurement errors
have been typically few hundred Gauss and no definite field detections
have emerged. Sadakane (1981) determined abundances of 15 elements in this star and found that the metal abundances are nearly solar or
slightly underabundant except for Mn, Y and Ba, which may be overabundant.
Cowley (1980) mentioned a weakness of Sc
relative to lines of other
ions and suggested that HD 209459 may be related to hot Am stars.
Cowley(1980) also studied the star HD 219927 and describes it as
nearly normal. No search for magnetic field has been carried out for this
star.
The star HD 179761 is one of the hottest stars for which Babcock (1958)
has found a longitudinal field. Three out of four measurements performed
by him revealed a magnetic field ranging from -500 to -600 Gauss at
the level of 3.5 to 5.
No peculiar elements have
been detected in our spectrum. However, Cowley (1972)
noticed that the character of the hydrogen wings suggests that this star
could be similar to HgMn stars.
No variation of radial velocity
to 5.
No peculiar elements have
been detected in our spectrum. However, Cowley (1972)
noticed that the character of the hydrogen wings suggests that this star
could be similar to HgMn stars.
No variation of radial velocity  has been reported for
the stars HD 186568 and HD 209459. Our
measurement of radial velocity of the star HD 186568
(
= -8.4 km s-1) agrees well with the
value measured by Morse et al. (1991) (
has been reported for
the stars HD 186568 and HD 209459. Our
measurement of radial velocity of the star HD 186568
(
= -8.4 km s-1) agrees well with the
value measured by Morse et al. (1991) (
 km s-1).
The stars HD 179761 and HD 219927 show variable
and
they are probably spectroscopic binaries. However, only very few radial velocity measurements
are available at the moment for them. For HD 179761 Morse et al.
(1991) measured
km s-1).
The stars HD 179761 and HD 219927 show variable
and
they are probably spectroscopic binaries. However, only very few radial velocity measurements
are available at the moment for them. For HD 179761 Morse et al.
(1991) measured
 km s-1 whereas we
measured
km s-1 whereas we
measured
 km s-1.
Wolff (1978) found that the radial velocity of HD 219927 varies from
-3.1 km s-1 to 4.9 km s-1. We measured for this star
= -11.4 km s-1.
Spectral lines from the companions have not been detected in our data.
km s-1.
Wolff (1978) found that the radial velocity of HD 219927 varies from
-3.1 km s-1 to 4.9 km s-1. We measured for this star
= -11.4 km s-1.
Spectral lines from the companions have not been detected in our data.
HgMn stars still remain interesting objects for future studies on
the presence of magnetic fields for them.
Further high resolution and high signal-to-noise ratio
spectra are needed to state whether the equivalent width variations and the
intensification indices found for both HgMn and normal late B-type stars
are due to weak variable magnetic fields or are rather due to instrumental effects
and measurement techniques.
For instance, in addition to the two Fe
lines of mult. 74 used in this paper,
other pairs of magnetically sensitive lines could be observed and analyzed.
Takeda (1991) pointed out the existence of
another pair of Fe
lines at 4416.8 Å and 4385.4 Å with the same
Zeeman patterns. Among the other elements different from iron, there is a
pair of Cr
lines at 5620.918 Å and 5622.468 Å, which have identical patterns.
Other independent approaches to study weak magnetic fields in normal
late B-type stars and HgMn stars would be the moment technique in order to look
for possible differential broadening of spectral lines having different
magnetic sensitivities (Mathys 1995; Mathys & Hubrig 1997), or
the multi-line Stenflo-Lindegren (1977) technique, which can be very
powerful if it is applied to a suitable sample of spectral lines. Magnetic
field detections might also be valuably
attempted through the observation of linear polarization in spectral
lines.
To our knowledge, such observations have never been done for normal late
B-type stars and HgMn stars.
Acknowledgements
We would like to thank J. Matthews for assistance during the CFHT
observations and D. A. Bohlender for help with the data reduction.
We thank the referee G. Wade for the constructive comments and
discussions which have helped us to improve the paper in a
substantial way.
S. H. thanks the DFG for travel funds to the CFHT.
- Adelman, S. J. 1978, ApJ, 222, 547
NASA ADS
- Adelman, S. J. 1994, MNRAS, 266, 97
In the text
NASA ADS
- Adelman, S. J., & Pyper, D. M. 1979, AJ, 84, 1603
NASA ADS
- Adelman, S. J., & Pyper, D. M. 1983, ApJ, 266, 732
NASA ADS
- Adelman, S. J., & Rayle, K. E. 2000, A&A, 355, 308
NASA ADS
- Babcock, H. W. 1958, ApJS, 3, 141
In the text
NASA ADS
- Bohlender, D. A., Dworetsky, M. M., & Jomaron, C. M. 1998, ApJ, 504, 533
In the text
NASA ADS
- Bohlender, D. A., & Landstreet, J. D. 1990, MNRAS, 247, 606
In the text
NASA ADS
- Breger, M. 1976, ApJS, 32, 7
NASA ADS
- Castelli, F. 1991, A&A, 251, 106
NASA ADS
- Castelli, F. 1999, A&A, 346, 564
NASA ADS
- Conti, P. S. 1970, ApJ, 160, 1077
In the text
NASA ADS
- Cowley, A. 1972, AJ, 77, 750
In the text
NASA ADS
- Cowley, C. R. 1980, PASP, 92, 159
In the text
NASA ADS
- Cowley, C. R., & Aikman, G. C. L. 1980, ApJ, 242, 684
In the text
NASA ADS
- Crawford, D. L., & Mandwewala, N. 1976, PASP, 88, 917
In the text
NASA ADS
- Dworetsky, M. M., & Budaj, J. 2000, MNRAS, 318, 1264
In the text
NASA ADS
- Hauck, B., & Mermilliod, M. 1998, A&AS, 129, 431
In the text
NASA ADS
- Hubrig, S., Castelli, F., & Wahlgren, G. M. 1999, A&A, 346, 139
In the text
NASA ADS
- Karlsson, H., Sikström, C. M., Johansson, S., Li, Z. S., & Lundberg, H. 2001, A&A, 371, 360
NASA ADS
- Kurucz, R. L. 1993a, ATLAS9 Stellar Atmosphere Programs and 2 km s-1 grid, CD-ROM No. 13, Smithonian Astrophys. Obs. (Cambridge, MA)
- Kurucz, R. L. 1993b, SYNTHE Spectrum Synthesis Programs and Line Data, CD-ROM No. 18,
Smithonian Astrophys. Obs. (Cambridge, MA)
- Kurucz, R. L., & Bell, B. 1995, Atomic Line List, CD-ROM No. 23,
Smithonian Astrophys. Obs. (Cambridge, MA)
In the text
- Landstreet, J. D. 1982, ApJ, 258, 639
In the text
NASA ADS
- Landstreet, J. D. 1992, A&AR, 4, 35
In the text
- Lane, M. C., & Lester, J. B. 1984, ApJ, 281, 273
- Lanz, T., & Mathys, G. 1993, A&A, 280, 486
In the text
NASA ADS
- Lester, J. B., Gray, R. O., & Kurucz, R. L. 1986, ApJS, 61, 509
NASA ADS
- Mathys, G. 1990, A&A, 232, 151
In the text
NASA ADS
- Mathys, G. 1995, A&A, 293, 746
In the text
NASA ADS
- Mathys, G., & Lanz, T. 1990, A&A, 230, L21
In the text
NASA ADS
- Mathys, G., & Lanz, T. 1992, A&A, 256, 169
In the text
NASA ADS
- Mathys, G., & Hubrig, S. 1997, A&AS, 124, 475
In the text
NASA ADS
- Moon, T. T. 1985, Commun. Univ. London Obs., 78
In the text
- Moon, T. T., & Dworetsky, M. M. 1985, MNRAS, 217, 305
NASA ADS
- Morse, J. A., Mathieu, R. D., & Levine, S. E. 1991, AJ, 101, 1495
In the text
NASA ADS
- Raassen, A. J. J., & Uylings, P. H. M. 2000, The atomic data are
available on the Web, http://www.science.uva.nl/pub/orth/iron/FeII.E1
- Relyea, L. J., & Kurucz, R. L. 1978, ApJS, 37, 45
NASA ADS
- Renson, P. 1991, Catalogue Général des Étoiles Ap et A,
Institut d'Astrophysique, Université de Liège
In the text
- Sadakane, K. 1981, PASP, 93, 587
In the text
NASA ADS
- Smith, K. C. 1997, A&A, 319, 928
In the text
NASA ADS
- Smith, K. C., & Dworetsky, M. M. 1993, A&A, 274, 335
In the text
NASA ADS
- Stenflo, J. O., & Lindegren, L. 1977, A&A, 59, 367
In the text
NASA ADS
- Strömgren, B. 1966, ARA&A, 4, 433
NASA ADS
- Takeda, Y. 1991, Publ. Astron. Soc. Jpn, 43, 823
In the text
NASA ADS
- Wolff, S. C., ApJ, 434, 349
In the text
Copyright ESO 2001
![\begin{figure}
\par\includegraphics[width=11cm]{fig1ab.ps}\end{figure}](/articles/aa/full/2001/33/aa1101/img17.gif)
![\begin{figure}
\addtocounter{figure}{-1}
\par\includegraphics[width=6.9cm]{fig1c.ps}
\end{figure}](/articles/aa/full/2001/33/aa1101/img18.gif)
![\includegraphics[width=18cm,clip]{jal.ps}](/articles/aa/full/2001/33/aa1101/img88.gif)
![\begin{figure}
\par\includegraphics[width=8cm]{1101f2.eps}\end{figure}](/articles/aa/full/2001/33/aa1101/img111.gif)
![\begin{figure}
\par\includegraphics[width=8cm]{1101f3.eps}\end{figure}](/articles/aa/full/2001/33/aa1101/img112.gif)