Comparison of column densities towards the primary as derived from line absorption requires the continuum to be normalised to eliminate continuum variability of the primary - which is mainly due to tidal deformation of the primary, with a possible contribution of X-ray heating of the primary by the X-ray source. It must be realised that normalising the continuum is in principle incorrect when studying line emission: at a certain orbital phase, the emission is due to scattered light originating from parts of the primary that are not necessarily the part from which the observed continuum originates.
For each object, three wavelength intervals were chosen that show no intrinsic
variability other than a possible continuum variability. These are listed in
Table B.1. To normalise the flux scales of the spectra relative to eachother,
each spectrum k was divided by a normalisation factor fk. This factor
was constructed from the spectral points
![]() in the
three intervals
in the
three intervals
![]() ,
with interval j having
nj spectral points:
,
with interval j having
nj spectral points:
![\begin{displaymath}f_{k} = \sum_{j=1}^{3} \left[ \left( \frac{ n_{j} }{ \sum_{j=...
...}{ \sum_{k=1}^{N}
\sum_{i=A_{j}}^{B_{j}} x_{ki} } \right]\cdot
\end{displaymath}](/articles/aa/full/2001/32/aah2663/img249.gif) |
(B.1) |
The normalisation constants may in principle be used to construct UV continuum lightcurves, after correcting for the change in sensitivity of the detector according to the correction table of Bohlin & Grillmair (1988). The correction procedure does not discriminate between the two resolution modes (Cassatella et al. 1994). Not all spectra can be used to construct a lightcurve. For the HMXBs in low resolution all spectra available are used except for SWP3989 (HDE 226868/Cyg X-1) and SWP1458 and 1459 (Sk-Ph/LMC X-4) that had a large (factor of 3 to 5) offset in flux level. For the HMXBs in high resolution all spectra of HD 77581/Vela X-1 are used, but SWP1476, 1714 and 1972 through 5180 (HD 153919/4U1700-37) are omitted because they were taken through the small aperture causing the loss of an unknown fraction of the total light.
| HMXB | Band 1 | Band 2 | Band 3 |
| Cyg X-1 | (1265, 1295) | (1759, 1765) | (1820, 1895) |
| LMC X-4 | (1650, 1670) | (1690, 1710) | (1820, 1895) |
| SMC X-1 | (1605, 1635) | (1746, 1762) | (1820, 1895) |
| Vela X-1 | (1272, 1278) | (1492, 1498) | (1696, 1702) |
| 4U1700-37 | (1465, 1470) | (1515, 1518) | (1772, 1777) |
To study variability in the spectrum tilt, we define UV colours in the
following way:
| (B.2) |
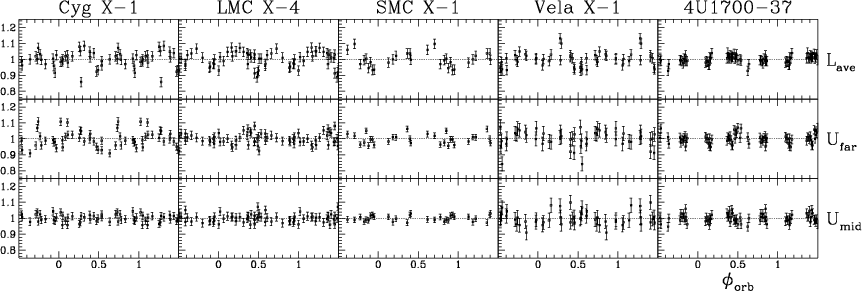
The UV continuum lightcurves are displayed in Fig. B.1. The
![]() lightcurve is an average of all points within the 3 wavelength bands. It is
not straightforward to determine the errors on the individual points in the
lightcurve. The photometric accuracy of IUE is reported to be
lightcurve is an average of all points within the 3 wavelength bands. It is
not straightforward to determine the errors on the individual points in the
lightcurve. The photometric accuracy of IUE is reported to be ![]() 6% at a
95% confidence level (Bohlin et al. 1980). This is probably a conservative
estimate, judging from the small degree of scatter. For the error on the
colour measurement we adopt the standard deviation of the distribution
function of the measured
6% at a
95% confidence level (Bohlin et al. 1980). This is probably a conservative
estimate, judging from the small degree of scatter. For the error on the
colour measurement we adopt the standard deviation of the distribution
function of the measured
![]() points, which is a very conservative
error estimate, and the same value is assigned to the error of the
points, which is a very conservative
error estimate, and the same value is assigned to the error of the
![]() colour.
colour.
The lightcurve of HDE 226868/Cyg X-1 (Fig. B.1) has a minimum to maximum
amplitude of ![]() 17% (the deviating point at
17% (the deviating point at
![]() probably does not
contain all the flux of the source). This is consistent with the scatter of
similar amplitude in the UV photometry around 1500 and 1800 Å obtained by
Wu et al. (1982) with the Astronomical Netherlands Satellite (ANS), but
considerably larger than the 8% found by Treves et al. (1980) who analysed
only 7 spectra by integrating the entire spectrum between 1250 and 1900 Å.
The absence of X-ray eclipses limits the inclination to
probably does not
contain all the flux of the source). This is consistent with the scatter of
similar amplitude in the UV photometry around 1500 and 1800 Å obtained by
Wu et al. (1982) with the Astronomical Netherlands Satellite (ANS), but
considerably larger than the 8% found by Treves et al. (1980) who analysed
only 7 spectra by integrating the entire spectrum between 1250 and 1900 Å.
The absence of X-ray eclipses limits the inclination to
![]() (Bolton
1975). Hence the deprojected amplitude is even larger, implying a severe
deformation of HDE 226868.
(Bolton
1975). Hence the deprojected amplitude is even larger, implying a severe
deformation of HDE 226868.
The
![]() colour shows clear orbital modulation similar to the average
flux: when the HMXB becomes fainter in the UV, the spectrum becomes redder.
This may reflect a lower photospheric temperature of HDE 226868 at the side
that faces to and away from Cyg X-1, probably a result of the tidal
deformation of the primary (Hutchings 1974). HDE 226868 is possibly filling its
tidal lobe during peri-astron of the slightly eccentric orbit (
colour shows clear orbital modulation similar to the average
flux: when the HMXB becomes fainter in the UV, the spectrum becomes redder.
This may reflect a lower photospheric temperature of HDE 226868 at the side
that faces to and away from Cyg X-1, probably a result of the tidal
deformation of the primary (Hutchings 1974). HDE 226868 is possibly filling its
tidal lobe during peri-astron of the slightly eccentric orbit (![]() :
Bolton 1975). No heating of the photosphere of the primary by the X-ray
companion is observed, in agreement with Strömgren photometry by Hilditch
& Hill (1974).
:
Bolton 1975). No heating of the photosphere of the primary by the X-ray
companion is observed, in agreement with Strömgren photometry by Hilditch
& Hill (1974).
The lightcurve of Sk-Ph/LMC X-4 (Fig. B.1) has a minimum to maximum amplitude
of ![]() 19%, and is an improvement over the lightcurve derived from only 15
spectra by van der Klis et al. (1982) (see also Vrtilek et al. 1997). The
variable depth of the
19%, and is an improvement over the lightcurve derived from only 15
spectra by van der Klis et al. (1982) (see also Vrtilek et al. 1997). The
variable depth of the ![]() minimum was explained by a precessing
accretion disk (van der Klis et al. 1982). The precession causes variations
in the amount of surface of Sk-Ph that is exposed to X-ray heating, as well as
variations in the fraction of Sk-Ph that is eclipsed by the disk. Heemskerk &
van Paradijs (1989) confirmed the presence of an accretion disk that precesses
with a period of
minimum was explained by a precessing
accretion disk (van der Klis et al. 1982). The precession causes variations
in the amount of surface of Sk-Ph that is exposed to X-ray heating, as well as
variations in the fraction of Sk-Ph that is eclipsed by the disk. Heemskerk &
van Paradijs (1989) confirmed the presence of an accretion disk that precesses
with a period of
![]() days, whilst X-ray observations had already
revealed a
days, whilst X-ray observations had already
revealed a
![]() days period (Pakull et al. 1985); we adopt
days period (Pakull et al. 1985); we adopt
![]() days. Phase
days. Phase
![]() corresponds to the phase
when the accretion disk is seen edge-on.
corresponds to the phase
when the accretion disk is seen edge-on.
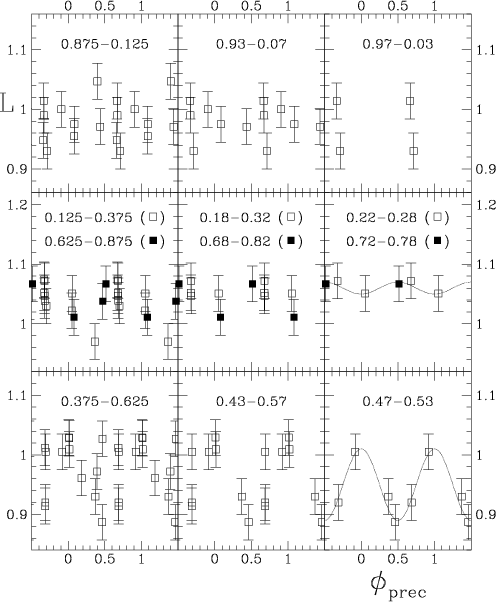
Lightcurves are created according to the cycle parameters of the precession of
the accretion disk, for bins around orbital phases
![]() ,
0.25
& 0.75, and 0.5 (Fig. B.2). For orbital phases
,
0.25
& 0.75, and 0.5 (Fig. B.2). For orbital phases
![]() no
clear variability with the disk precession period is seen. For
no
clear variability with the disk precession period is seen. For
![]() the luminosity is lowest when the accretion disk eclipses the
largest part of Sk-Ph (
the luminosity is lowest when the accretion disk eclipses the
largest part of Sk-Ph (
![]() ), and highest when the
accretion disk is seen edge-on (
), and highest when the
accretion disk is seen edge-on (
![]() ). This is especially
clear when narrower orbital phase bins are taken. At
). This is especially
clear when narrower orbital phase bins are taken. At
![]() & 0.75 the luminosity varies in anti-phase with the variation
at
& 0.75 the luminosity varies in anti-phase with the variation
at
![]() .
Our results agree well with those of Heemskerk &
van Paradijs (1989) from optical data. The amplitude of variability of the UV
luminosity at
.
Our results agree well with those of Heemskerk &
van Paradijs (1989) from optical data. The amplitude of variability of the UV
luminosity at
![]() is 10% - the same as in the optical.
is 10% - the same as in the optical.
The
![]() colour (Fig. B.1) is modulated with the orbital period. The
colour behaviour around orbital phase
colour (Fig. B.1) is modulated with the orbital period. The
colour behaviour around orbital phase
![]() may be
dominated by X-ray heating, causing the UV spectrum to become hotter close to
may be
dominated by X-ray heating, causing the UV spectrum to become hotter close to
![]() .
The scatter in the
.
The scatter in the
![]() colour very close to
colour very close to
![]() may be due to variable obscuration by the precessing
disk.
may be due to variable obscuration by the precessing
disk.
The lightcurve of Sk 160/SMC X-1 (Fig. B.1) has a minimum to maximum amplitude
of ![]() 17%. In optical lightcurves the
17%. In optical lightcurves the ![]() minimum is observed to be
weaker than the
minimum is observed to be
weaker than the ![]() minimum, explained by X-ray heating by the bright
X-ray source (Hutchings 1974). Van Paradijs & Zuiderwijk (1977) and Howarth
(1982), however, found that X-ray heating is not sufficient and that an
emitting accretion disk is required, in agreement with the suggestion that the
mass transfer is dominated by Roche-lobe overflow (Hutchings et al. 1977).
Despite using more spectra than van der Klis et al. (1982), the orbital phase
coverage of our UV lightcurve around
minimum, explained by X-ray heating by the bright
X-ray source (Hutchings 1974). Van Paradijs & Zuiderwijk (1977) and Howarth
(1982), however, found that X-ray heating is not sufficient and that an
emitting accretion disk is required, in agreement with the suggestion that the
mass transfer is dominated by Roche-lobe overflow (Hutchings et al. 1977).
Despite using more spectra than van der Klis et al. (1982), the orbital phase
coverage of our UV lightcurve around ![]() is too poor to answer the
question of X-ray heating and accretion disk. An
is too poor to answer the
question of X-ray heating and accretion disk. An
![]() day periodicity in
the X-ray characteristics of SMC X-1 has been attributed to a precessing
accretion disk (e.g. Wojdowski et al. 1998).
day periodicity in
the X-ray characteristics of SMC X-1 has been attributed to a precessing
accretion disk (e.g. Wojdowski et al. 1998).
The lightcurve of HD 77581/Vela X-1 (Fig. B.1) has a minimum to maximum
amplitude of ![]() 20% and clear orbital modulation, although Dupree et al. (1980) could not see continuum variability in the 5 low resolution spectra
they used. The
20% and clear orbital modulation, although Dupree et al. (1980) could not see continuum variability in the 5 low resolution spectra
they used. The ![]() minimum is significantly deeper than the
minimum is significantly deeper than the ![]() minimum, much alike the visual lightcurve (Zuiderwijk et al. 1977) that has a
somewhat smaller amplitude of
minimum, much alike the visual lightcurve (Zuiderwijk et al. 1977) that has a
somewhat smaller amplitude of ![]() 15%. Zuiderwijk et al. argue that
HD 77581 is nearly filling its Roche lobe.
15%. Zuiderwijk et al. argue that
HD 77581 is nearly filling its Roche lobe.
The
![]() colour is modulated with the orbital period, becoming redder
around
colour is modulated with the orbital period, becoming redder
around ![]() .
This may be explained by temperature gradients over the
photosphere of HD 77581. The scatter of the
.
This may be explained by temperature gradients over the
photosphere of HD 77581. The scatter of the
![]() colour near
colour near
![]() may result from variable X-ray heating of the part of the
photosphere of HD 77581 that faces Vela X-1, due to the strongly variable X-ray
flux.
may result from variable X-ray heating of the part of the
photosphere of HD 77581 that faces Vela X-1, due to the strongly variable X-ray
flux.
The lightcurve of HD 153919/4U1700-37 (Fig. B.1) is flat within ![]() 4 to
5%, possibly with a marginable maximum at
4 to
5%, possibly with a marginable maximum at ![]() .
This is less than the
UV amplitude around 1500 and 1800 Å of 8% found by Hammerschlag-Hensberge
& Wu (1977) using the ANS. Optical amplitudes are
.
This is less than the
UV amplitude around 1500 and 1800 Å of 8% found by Hammerschlag-Hensberge
& Wu (1977) using the ANS. Optical amplitudes are ![]() 4 to 8%
(Hammerschlag-Hensberge & Zuiderwijk 1977; van Paradijs et al. 1978). The
small amplitude may be due to a large mass ratio of the system and therefore
small distortion of HD 153919. The optical lightcurve cannot be described by
tidal distortion of HD 153919 alone (van Paradijs et al. 1978). In particular
the deepest minimum does not occur at
4 to 8%
(Hammerschlag-Hensberge & Zuiderwijk 1977; van Paradijs et al. 1978). The
small amplitude may be due to a large mass ratio of the system and therefore
small distortion of HD 153919. The optical lightcurve cannot be described by
tidal distortion of HD 153919 alone (van Paradijs et al. 1978). In particular
the deepest minimum does not occur at ![]() but at
but at ![]() .
Possible
explanations include extra absorption originating from the mass flow in the
system. The UV lightcurves presented here also suggest a minimum near
.
Possible
explanations include extra absorption originating from the mass flow in the
system. The UV lightcurves presented here also suggest a minimum near
![]() .
Hints for the signature of a photo-ionization wake in
Strömgren photometry are presented in Appendix C. The
.
Hints for the signature of a photo-ionization wake in
Strömgren photometry are presented in Appendix C. The
![]() colour
is bluest at orbital phase
colour
is bluest at orbital phase ![]() ,
which suggests X-ray heating of the
part of the photosphere of HD 153919 facing 4U1700-37.
,
which suggests X-ray heating of the
part of the photosphere of HD 153919 facing 4U1700-37.
Copyright ESO 2001