 |
(D.1) |
The degree of variability in a particular spectral point over a series of spectra can be expressed by the variance in that spectral point. The variances are often used to derive error estimates on the values of spectral points, and to detect intrinsic spectral variability. Usually two adjacent spectral points do not behave independently from eachother. Ignoring the covariability of adjacent spectral points can lead to serious under-estimation of the error on a quantity derived by integration along the spectrum. A correct error analysis therefore involves the calculation of covariances. Better than variances, covariances are powerful in detecting variability on an intermediate spectral scale - i.e. exceeding the instrumental profile but considerably smaller than the total spectral range. Covariances have also been used successfully in proving the reality of spectral features with low signal-to-noise (van Loon et al. 1996).
For a set of N spectra, each consisting of a number of spectral values x,
the covariance of points a & b is:
 |
(D.1) |
 |
(D.2) |
 |
(D.3) |
 |
(D.4) |
| (D.5) |
| Cyg X-1 | LMC X-4 | SMC X-1 | Vela X-1 | 4U1700-37 |
| 1250,1370 | 1170,1200 | 1250,1380 | 1153,1200 | 1183,1225 |
| 1420,1510 | 1280,1380 | 1415,1530 | 1253,1280 | 1420,1517 |
| 1565,1926 | 1430,1530 | 1560,1926 | 1315,1380 | 1730,1947 |
| 1565,1926 | 1415,1530 | |||
| 1565,1840 |
 |
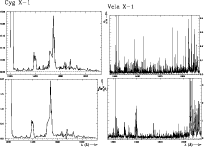
Figure D.2: Variances (top) and integrated covariances (bottom) in the spectra of Cyg X-1 (left) and Vela X-1 (right), as a function of wavelength of the spectral points i. |
The covariances
![]() decrease with increasing distance |j-i| to
the point i. If the integral of the covariances for the point i converges
sufficiently fast, then the integration interval (A,B) in Eq. (D3) may be
replaced by a smaller interval such that the integral of the covariances just
reaches convergence. This interval is determined from a covariance profile of
decrease with increasing distance |j-i| to
the point i. If the integral of the covariances for the point i converges
sufficiently fast, then the integration interval (A,B) in Eq. (D3) may be
replaced by a smaller interval such that the integral of the covariances just
reaches convergence. This interval is determined from a covariance profile of
![]() versus j-i, which represents the spectral shape of the
instrumental profile. As an example the covariance profile and the cumulative
covariance are shown for Cyg X-1 and Vela X-1 (Fig. D.1). The dashed, dotted
and dash-dotted lines represent the mean curves within the three regions in
which the continuum calibration factors were determined (from shortest to
longest wavelength, respectively), whilst the solid line represents the entire
spectral range - i.e. including wildly variable spectral features. Both the
covariance and the cumulative covariance at zero distance from the point ireduce to the variance - i.e. the covariance of point i with itself. At
larger distances the covariance diminishes to a small oscillation around zero,
whilst the initially rapidly growing cumulative covariance approximates a
constant level.
versus j-i, which represents the spectral shape of the
instrumental profile. As an example the covariance profile and the cumulative
covariance are shown for Cyg X-1 and Vela X-1 (Fig. D.1). The dashed, dotted
and dash-dotted lines represent the mean curves within the three regions in
which the continuum calibration factors were determined (from shortest to
longest wavelength, respectively), whilst the solid line represents the entire
spectral range - i.e. including wildly variable spectral features. Both the
covariance and the cumulative covariance at zero distance from the point ireduce to the variance - i.e. the covariance of point i with itself. At
larger distances the covariance diminishes to a small oscillation around zero,
whilst the initially rapidly growing cumulative covariance approximates a
constant level.
For Cyg X-1 the solid line is too high to be captured within the frame of the
plots, indicating that some parts of the spectrum are strongly variable. The
width of the covariance profile corresponds to the specified spectral
resolving power of about 250. The cumulative covariance indicates that a
reasonable choice for the integration interval is ![]() Å. The sharp peak
of the covariance profile of Vela X-1 indicates a spectral resolution in
accordance with the specified spectral resolving power of about 104.
Its broad wings, however, prevent the cumulative covariance from converging
within
Å. The sharp peak
of the covariance profile of Vela X-1 indicates a spectral resolution in
accordance with the specified spectral resolving power of about 104.
Its broad wings, however, prevent the cumulative covariance from converging
within ![]() 16 spectral points (
16 spectral points (![]() 1.6 Å) - several times the
specified spectral resolution.
1.6 Å) - several times the
specified spectral resolution.
Spectra of the variances and integrated covariances are shown for Cyg X-1 and Vela X-1 (Fig. D.2) as an example of the detection of intrinsic spectral variability. In the low-resolution spectra of Cyg X-1 the spectral features (notably the Si IV and C IV resonance lines near 1400 and 1550 Å, respectively) and their variability are unresolved. The calculation of covariances does not improve the detection sensitivity much. In the high-resolution spectra of Vela X-1, however, the integrated covariance spectrum is much more sensitive than the variance spectrum in detecting intrinsic variability. Events that are limited to only one or very few adjacent pixels (like cosmics or dead pixels) cause a "forest'' of sharp peaks in the variance spectrum, nearly completely obscuring the resolved but still narrow peaks of the intrinsic variability - the "trees'' of interest. By calculating the integrated covariance spectrum the forest is suppressed, and at the same time the features indicating intrinsic variability are enhanced. The variable spectral features can be identified easily.
Copyright ESO 2001